. 2020 Aug 17;11(1):4110.
doi: 10.1038/s41467-020-17901-2.

Vulnerability of progeroid smooth muscle cells to biomechanical forces is mediated by MMP13

Affiliations

Vulnerability of progeroid smooth muscle cells to biomechanical forces is mediated by MMP13

Patricia R Pitrez et al. Nat Commun. .

Abstract

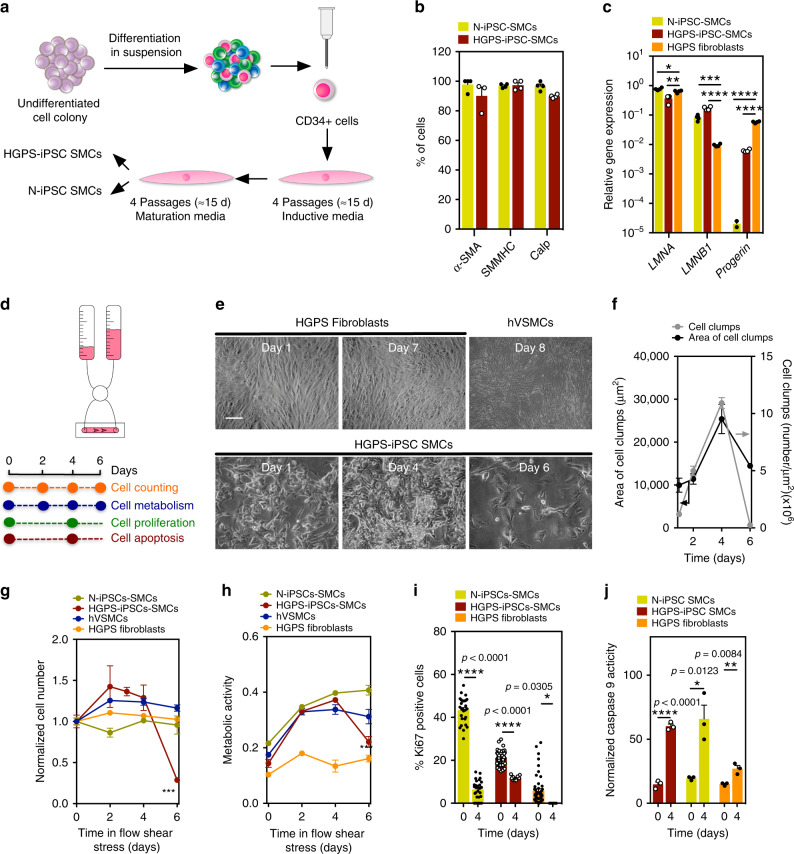
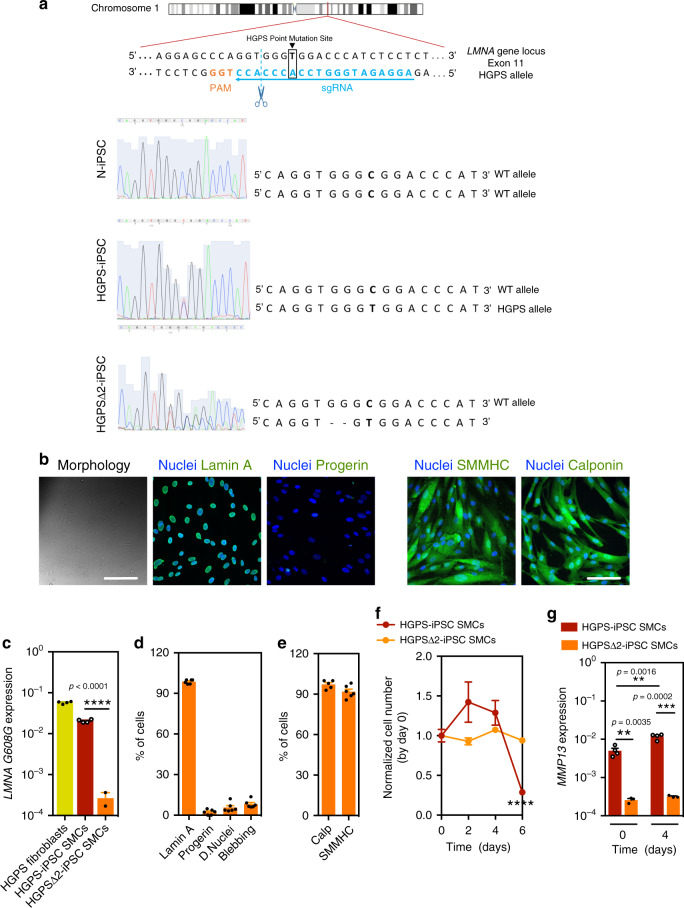
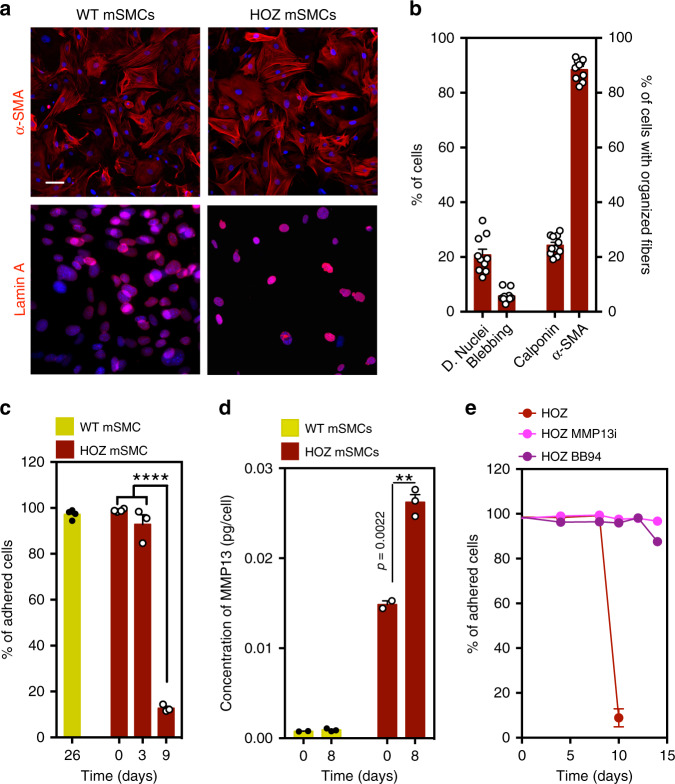
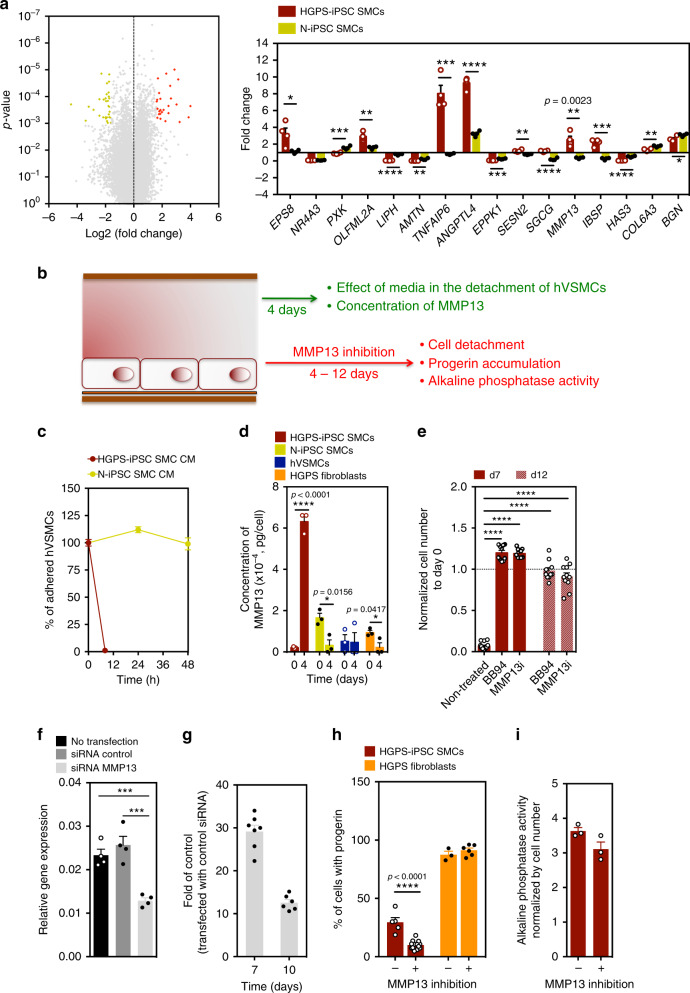
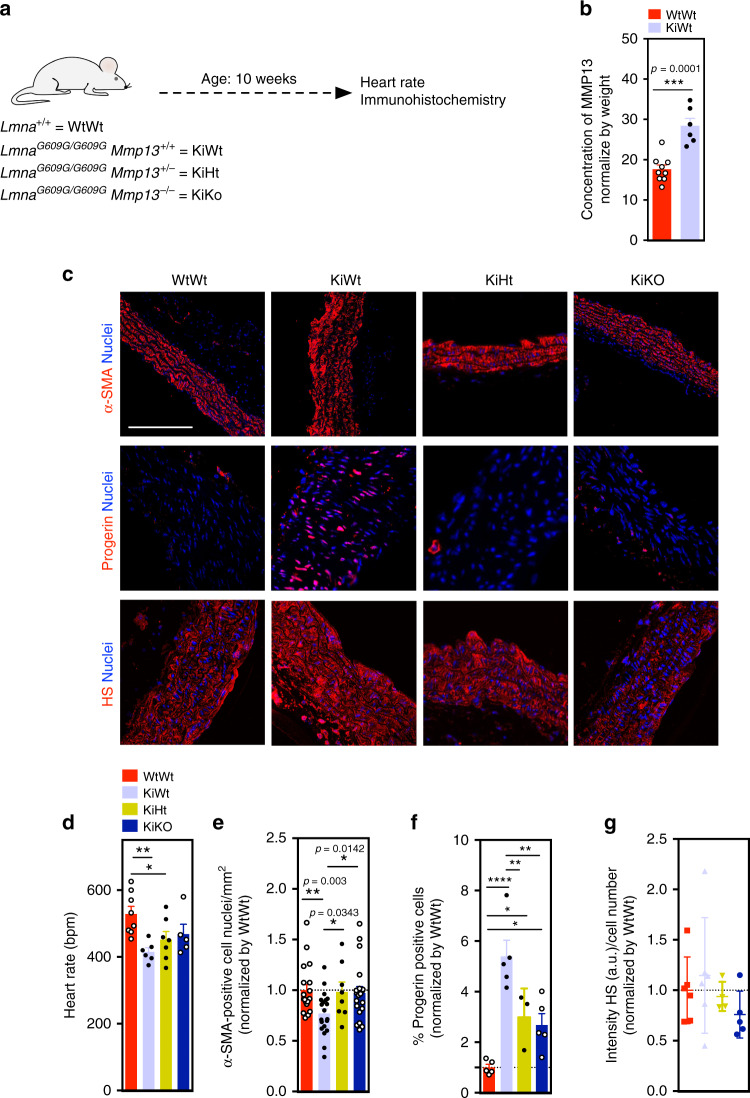
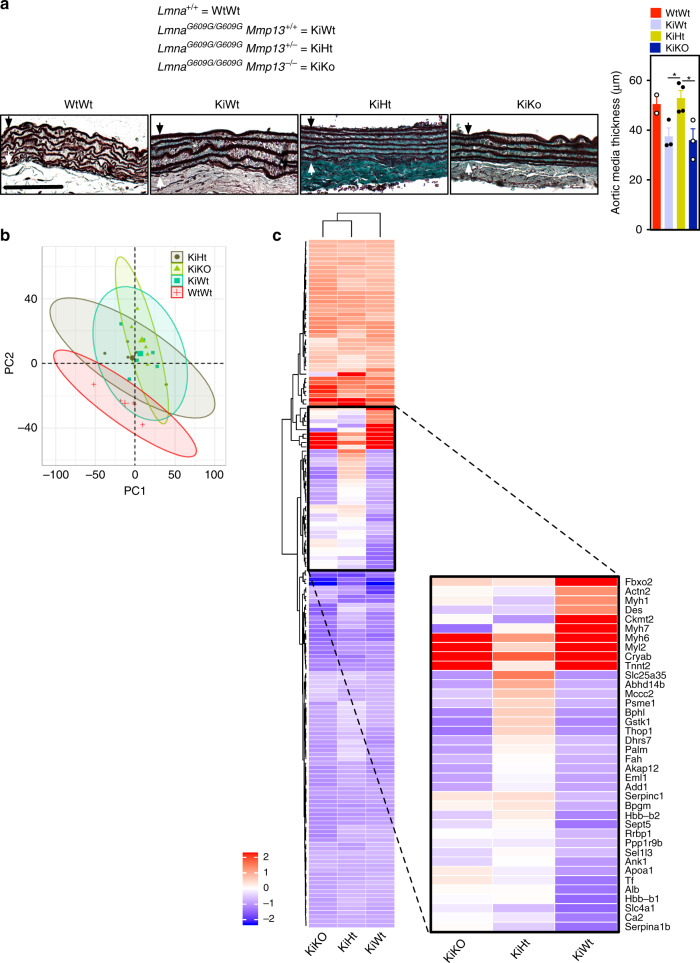
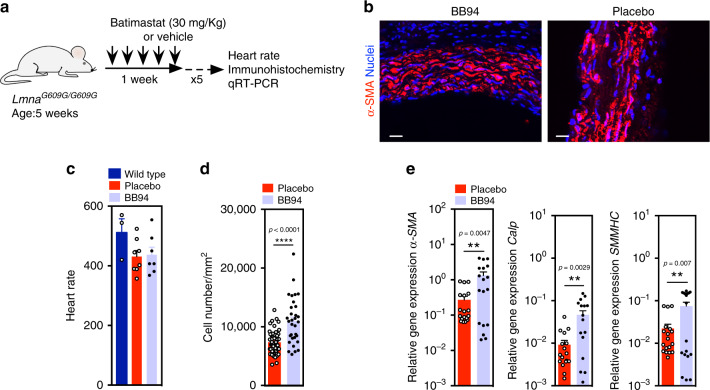
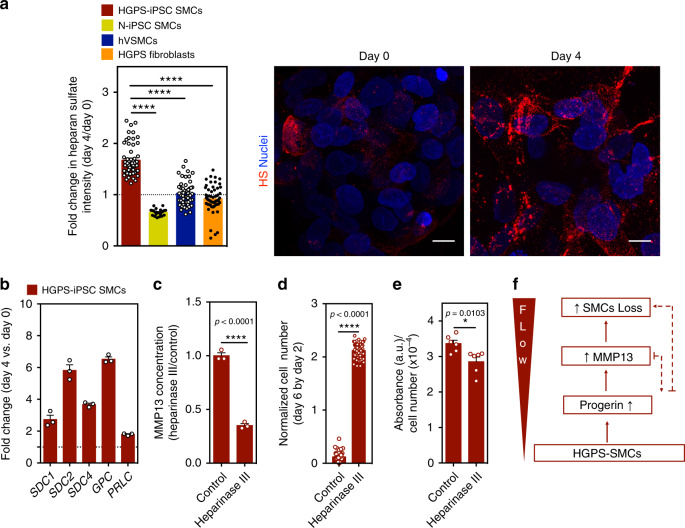
Hutchinson-Gilford Progeria Syndrome (HGPS) is a premature aging disease in children that leads to early death. Smooth muscle cells (SMCs) are the most affected cells in HGPS individuals, although the reason for such vulnerability remains poorly understood. In this work, we develop a microfluidic chip formed by HGPS-SMCs generated from induced pluripotent stem cells (iPSCs), to study their vulnerability to flow shear stress. HGPS-iPSC SMCs cultured under arterial flow conditions detach from the chip after a few days of culture; this process is mediated by the upregulation of metalloprotease 13 (MMP13). Importantly, double-mutant LmnaG609G/G609GMmp13-/- mice or LmnaG609G/G609GMmp13+/+ mice treated with a MMP inhibitor show lower SMC loss in the aortic arch than controls. MMP13 upregulation appears to be mediated, at least in part, by the upregulation of glycocalyx. Our HGPS-SMCs chip represents a platform for developing treatments for HGPS individuals that may complement previous pre-clinical and clinical treatments.


Conflict of interest statement

The authors declare no competing interests.

Figures

Fig. 1
Fig. 1. Vulnerability of HGPS-iPSC SMCs to arterial flow conditions.
a Schematic representation of the methodology used to differentiate iPSCs into SMCs. b Expression of SMC markers on iPSC-derived SMCs. Percentage of positive cells expressing SMC markers as evaluated by immunofluorescence (at least 100 cells were counted per each marker). Results are mean ± SEM (n = 3 independent experiments). c Expression of progeria markers on iPSC-derived SMCs. Gene expression by qRT-PCR (gene expression was normalized by the housekeeping gene GAPDH). HGPS fibroblasts were used as control. Results are mean ± SEM (n = 4 technical replicates from a pool of three independent experiments). *, **, ***, **** denote statistical significance (p < 0.05, p < 0.01, p < 0.001, p < 0.0001). Statistical analyses were performed by one-way ANOVA followed by Newman–Keuls’s post test. d Schematic representation of the protocol used. Cells were cultured for 6–8 days in arterial flow conditions (20 dyne/cm2). e Light microscopy images of HGPS fibroblasts, hVSMCs, or HGPS-iPSC SMCs (10% of the cells accumulate progerin protein) at different culture days. Only HGPS-iPSC SMCs detached from the microfluidic system at day 4. Scale bar is 50 μm. f Number and area of cell clumps in HGPS-iPSC SMCs at different times (at least two images (×10) have been quantified per time). For area of cell clumps n > 2 images examined over three independent experiments; for cell clumps, n = 3 independent experiments. g Number of cells per surface area (mm2) during cell culture under arterial flow (at least three images (×10) have been quantified per time; n = 3–7 independent experiments). Cell number was normalized by the number of cells present at day 0. h Cell metabolism evaluated by the Presto Blue assay. Absorbance at 570 nm was measured and normalized to the 600-nm values for the experimental wells. n = 3 independent experiments. i Expression of nuclear proliferation marker, Ki67 (at least three images (×10) have been quantified per time). The percentage of Ki67 positive cells was evaluated by immunofluorescence. n > 3 images examined over three independent experiments. j Cell apoptosis evaluated by caspase-9 activity. Results were normalized by cell number. n = 3 independent experiments. From c to g, results are mean ± SEM. *, **, ***, **** denote statistical significance (p < 0.05, p < 0.01, p < 0.001, p < 0.0001). Statistical analyses were performed by a two-tailed unpaired Student’s t test i and j.
Fig. 2
Fig. 2. Expression of progeria and SMC markers in HGPSΔ2-iPSC SMCs.
a gRNA directs Cas9 nuclease against mutated exon 11 of LMNA gene, upstream the HGPS mutation, disrupting progerin, without altering lamin A and lamin C. Sanger sequencing for LMNA (NM_170707.4 transcript) exon 11 was performed for: N-iPSCs, HGPS-iPSCs and HGPSΔ2-iPSCs, confirming the deletion of two-base pairs in the HGPSΔ2-iPSCs. b Expression of lamin A, progerin, and SMC proteins monitored by immunofluorescence. Scale bar is 100 μm. n = 6 independent experiments. c Expression of progerin (LMNA G608G gene) in HGPS and HGPSΔ2 cell lines. Results are mean ± SEM (n = 4 technical replicates from a pool of three independent experiments). Statistical analyses were performed by a two-tailed unpaired Student’s t test. d Quantification of lamin A, progerin, dysmorphic nuclei, and nuclei blebbing. Results are mean ± SEM (n = 6 independent experiments). **** denotes statistical significance (p < 0.0001). e Percentage of cells that have been differentiated from HGPSΔ2-iPSCs that express SMC markers at protein level. Results are mean ± SEM (n = 5–6 independent experiments). f Number of cells per surface (mm2) as quantified by high-content microscopy (at least three images (×10) have been quantified per time). The number of cells was evaluated after 6 days under arterial flow and was normalized by the number of cells present at day 0. n > 3 images examined over three independent experiments. g MMP13 mRNA transcripts quantified by qRT-PCR analyses in HGPS-iPSC SMCs or HGPSΔ2-iPSC SMCs cultured under flow conditions. MMP13 mRNA transcripts were normalized by GAPDH. n = 4 technical replicates from a pool of three independent experiments. **, *** denote statistical significance (p < 0.01, p < 0.001). Statistical analyses were performed by a two-tailed unpaired Student’s t test.
Fig. 3
Fig. 3. Characterization and impact of flow shear stress in SMCs isolated from wild-type (WT) and homozygous (HOZ) LmnaG609G/G609G mice.
a Mouse SMCs were cultured for 9–26 days in arterial flow conditions (120 dyne/cm2). Immunofluorescence analyses performed on mouse SMCs (6-week-old WT and HOZ Lmna G609G/G609G mice) at passage 4 for α-SMA and Lamin A. Nuclei were stained with DAPI. Scale bar is 20 µm. n = 3–4 images examined over three independent experiments. b Percentage of dysmorphic nuclei, nuclei blebbing, and SMC organized fibers in mSMCs (assessed in static conditions). n = 3-4 images examined over three independent experiments. c Percentage of adhered cells over time. Cells were cultured under flow conditions. n = 3–4 independent experiments. Statistical analyses were performed by one-way ANOVA followed by Newman–Keuls’s post test. d Quantification of MMP13 in HOZ mSMCs and WT mSMCs. Cells were analyzed at day 0 and day 8 under flow. Fluorescence signal was normalized by cell number. n = 3–4 independent experiments. Statistical analyses were performed by a two-tailed unpaired Student’s t test. e Percentage of adhered cells over time. Cells were cultured under flow conditions. n = 5–6 independent experiments. In graphs be, results are mean ± SEM. *,**,***,**** denote statistical significance (p < 0.05, p < 0.01, p < 0.001, p < 0.0001).
Fig. 4
Fig. 4. MMP13 activity in HGPS-iPSC SMCs cultured under flow shear stress.
a Volcano plot representing differentially expressed genes in HGPS-iPSC-SMC cultured under flow conditions at day 0 and 4. Each point represents one of 53,617 genes. 26 and 31 genes were upregulated (red; fold change ≥ 3; p < 0.001) and downregulated (yellow; fold change ≤ 3; p < 0.001), respectively. Graph shows qRT-PCR validation for 16 genes with fold changes >3. Fold change was between days 0 and 4. Gene expression was normalized by the housekeeping gene GAPDH. Results are mean ± SEM, n = 4 technical replicates from a pool of three independent experiments. Statistical analyses were performed by a two-tailed unpaired Student’s t test. b Schematic representation of the experimental protocol used. c Effect of HGPS-iPSC SMC or N-iPSC SMCs conditioned media (in both cases obtained after 4 days under flow conditions) on hVSMCs cultured under flow conditions. n = 1–5 images examined over three independent experiments. d Quantification of MMP13 activity (cell culture media) by ELISA. Cells were analyzed at days 0 and 4 under flow. Fluorescence signal was normalized by cell number. n = 3 independent experiments. Statistical analyses were performed by a two-tailed unpaired Student’s t test. e Effect of MMP13 or BB94 inhibition in HGPS-iPSC SMC detachment. The number of cells was evaluated after 7 and 12 days under arterial flow and was normalized by the number of cells present at day 0. n = 3–5 images examined over three independent experiments. Statistical analyses were performed by one-way ANOVA followed by Newman–Keuls’s post test. f MMP13 knockdown by siRNA in HGPS-iPSC SMCs. MMP13 mRNA transcripts were quantified by qRT-PCR and normalized by GAPDH. Mean ± SEM (n = 4 technical replicates from a pool of three independent experiments). Statistical analyses were performed by one-way ANOVA followed by Newman–Keuls’s post test. g Number of cells per microfluidic area during culture under flow shear conditions normalized by the number of cells in control experimental groups (i.e., cells transfected with control siRNA). n = 7 independent experiments for day 7 and n = 6 independent experiments for day 10. h Percentage of progerin-positive cells after 7 days under flow conditions with SmGM-2 media supplemented or not with MMP13 inhibitor. n = 1–5 images examined over three independent experiments. Statistical analyses were performed by a two-tailed unpaired Student’s t test. i Activity of alkaline phosphatase in HGPS-iPSCs-SMC normalized by cell number per mm2, in cells cultured 4 days under flow conditions. Cells were treated or not with MMP13 inhibitor. n = 3 independent experiments. In graphs ah, results are mean ± SEM. *, **, ***, **** denote statistical significance (p < 0.05, p < 0.01, p < 0.001, p < 0.0001).
Fig. 5
Fig. 5. MMP13 inhibition significantly increases SMC number in aortic arch of LmnaG609G/G609G mice.
a Schematic representation of the animal protocol. WtWt, KiWt, KiHt, and KiKo mice (age: 10 weeks) were evaluated. b Quantification of MMP13 activity (plasma from WtWt, n = 9, and KiWt, n = 6, mice) by ELISA. Fluorescence signal was normalized by mice weight. Statistical analyses were performed by a two-tailed unpaired Student’s t test. c Immunofluorescence analyses in the aortic arch for α-SMA, progerin, and heparan sulfate (HS). Cell nuclei were stained with DAPI. Scale bar is 100 µm for α-SMA staining and 50 µm for progerin and heparan sulfate staining. For α-SMA staining, n = 5 animals, except for KiHt (four animals). For progerin staining, n = 5 animals, except for KiHt (three animals). For heparan sulfate n = 6 WtWt, n = 6 KiWt, n = 4 KiHt, and n = 5 for KiKo. d Heart rates in mice (n = 8 WtWt, n = 6 KiWt, n = 7 KiHt, and n = 5 KiKo). Statistical analyses were performed by one-way ANOVA followed by Newman–Keuls’s post test. e Number of SMC nuclei in aortic arch per tissue area (mm2) (n = 2–3 slides examined over five animals, except for KiHt (four animals)). Statistical analyses were performed by a two-tailed unpaired Student’s t test. f Percentage of progerin-positive cells in SMCs. n = 5 animals, except for KiHt (three animals). Statistical analyses were performed by one-way ANOVA followed by Newman–Keuls’s post test. g Expression of heparan sulfate as evaluated by immunofluorescence. Intensity of heparan sulfate was calculated in each picture (at least 16 pictures per condition) and normalized by cell number mice (n = 6 WtWt, n = 6 KiWt, n = 4, KiHt and n = 5 KiKo). In b, dg, results are mean ± SEM. *, **, ***, **** denote statistical significance (p < 0.05, p < 0.01, p < 0.001, p < 0.0001).
Fig. 6
Fig. 6. Proteins differentially expressed in the aortic arch at week 10 on wild-type and mutant (LmnaG609G/G609GMmp13−/− and LmnaG609G/G609GMmp13+/−) mice.
a Orcein-stained ascending aorta (elastic fibers stain in dark brown/black). Black arrow defines the internal elastic lamina while the white arrow defines the adventitial border. Images illustrate morphological changes rather than aortic media thickness differences. KiWT mice show less compact elastic lamellae and higher irregular profiles of the elastic lamellae (labeled with *) than the other mice. Scale bar is 50 µm. In graph, aortic media thickness was measured from the internal elastic lamina to the adventitial border. Black arrow defines the internal elastic lamina while the white arrow defines the adventitial border. Results are mean ± SEM, n = 3 animals, except for KiHt (four animals). * denotes statistical significance (p < 0.05). Statistical analyses were performed by one-way ANOVA followed by Newman–Keuls’s post test. b Principal component analysis (PCA) of proteome profiles obtained from aortic arches of wild-type (WtWt) and mutant (KiWt, KiHt, KiKo) mice. c Heatmap based on 161 protein groups differentially expressed between KiWt and WtWt mice, in aortic arch, at week 10 (q < 0.05 and abs(log2 fold change) > 0.58). Progerin is a mutated protein and thus not identified by the mass spectrometry. MMP13 is a secreted protein and the levels in cells were not detectable by mass spectrometry. For comparison purposes, the protein fold changes of WtWt vs. KiHt and WtWt vs. KIKo were included in the heatmap. Blue color indicates proteins downregulated in KiWt, KiHt, or KiKo as compared with WtWt, whereas red color corresponds to proteins upregulated in KiWt, KiHt, or KiKo as compared with WtWt. n = 6 for KiWt and n = 5 for WtWt, KiHt, and KiKo; age: 10 weeks.
Fig. 7
Fig. 7. MMP treatment using BB94 significantly increases SMC number in aortic arch of LmnaG609G/G609G mice.
a Schematic representation of the animal protocol. LmnaG609G/G609G mice (n = 8 for treatment group and control group; age: 5 weeks) were IP injected five times a week (30 mg/kg/day; 3 mg/mL in PBS). b Immunofluorescence analyses performed on mouse SMC for α-SMA showing higher number of SMCs in treated aortic arch. Cell nuclei were stained with DAPI. SMCs were stained for α-SMA. Scale bar is 100 µm. For BB94 treatment n = 5 animals. For placebo treatment n = 7 animals. c Heart rates in mice. Wild-type mice were not exposed to BB94. n = 3 for wild-type mice, n = 8 for placebo treatment group and n = 7 for BB94 treatment group. d Number of SMC nuclei in aortic arch per tissue area (mm2) in mice treated or not with BB94. For BB94 treatment, n > 6 images examined over five animals. For placebo treatment, n > 9 images examined over seven animals. e Expression of SMC genes in aortic arches of mice treated or not with BB94. Gene expression was normalized by the housekeeping gene GAPDH. n > 3 technical replicates over six animals. **, ***, **** denote statistical significance (p < 0.01, p < 0.001, p < 0.0001). Statistical analyses were performed by a two-tailed unpaired Student’s t test d and e.
Fig. 8
Fig. 8. MMP13 expression in SMCs is triggered by an increase in heparan sulfate.
a Cells were cultured under flow conditions for 4 days and the expression of heparan sulfate was evaluated by immunofluorescence. Intensity of heparan sulfate was calculated in each picture and normalized by cell number. The normalized fluorescence intensity at day 4 was divided with the one at day 0. Scale bar is 10 μm. n > 4 images examined over six independent experiments. Statistical analyses were performed by one-way ANOVA followed by Newman–Keuls’s post test. b Gene expression of glycocalyx markers (SDC1: syndecan 1, SDC2: syndecan 2, SDC4: syndecan 4, GPC: glypican, PLC: perlecan), as evaluated by qRT-PCR, in HGPS-iPSC SMCs cultured under flow conditions. Gene expression was normalized by the housekeeping gene GAPDH, and the normalized gene expression at day 4 divided by day 0. n = 3 technical replicates from a pool of three independent experiments. c HGPS-iPSCs-SMC cultured under flow condition were treated or not with heparinase III and the number of cells per microfluidic area during culture was calculated and normalized by the number of cells present at day 2. n = 3 independent experiments. Statistical analyses were performed by a two-tailed unpaired Student’s t test. d Quantification of MMP13 activity (cell culture media) by ELISA. Cells were analyzed at day 4 under flow. Fluorescence signal was normalized by cell number and then by control experimental group. n > 9 images examined over six independent experiments. Statistical analyses were performed by a two-tailed unpaired Student’s t test. e Expression of alkaline phosphatase in HGPS-iPSCs SMC, normalized by cell number per mm2, in cells cultured 4 days under flow conditions. Cells were treated or not with heparinase III. n = 2 technical replicates over three independent experiments. Statistical analyses were performed by a two-tailed unpaired Student’s t test. In ae, results are mean ± SEM. *, **, ***, **** denote statistical significance (p < 0.05, p < 0.01, p < 0.001, p < 0.0001). f Summary of the results.

References

    1. Hennekam RC. Hutchinson-Gilford progeria syndrome: review of the phenotype. Am. J. Med. Genet. A. 2006;140:2603–2624. - PubMed
    1. Eriksson M, et al. Recurrent de novo point mutations in lamin A cause Hutchinson-Gilford progeria syndrome. Nature. 2003;423:293–298. - PMC - PubMed
    1. Varga R, et al. Progressive vascular smooth muscle cell defects in a mouse model of Hutchinson-Gilford progeria syndrome. Proc. Natl Acad. Sci. USA. 2006;103:3250–3255. - PMC - PubMed
    1. Hamczyk MR, et al. Vascular smooth muscle-specific progerin expression accelerates atherosclerosis and death in a mouse model of Hutchinson-Gilford progeria syndrome. Circulation. 2018;138:266–282. - PMC - PubMed
    1. Olive M, et al. Cardiovascular pathology in Hutchinson-Gilford progeria: correlation with the vascular pathology of aging. Arterioscler Thromb. Vasc. Biol. 2010;30:2301–2309. - PMC - PubMed

Publication types

MeSH terms