. 2020 Aug 17;11(1):4113.
doi: 10.1038/s41467-020-17756-7.

T-cells produce acidic niches in lymph nodes to suppress their own effector functions

Affiliations

T-cells produce acidic niches in lymph nodes to suppress their own effector functions

Hao Wu et al. Nat Commun. .

Abstract

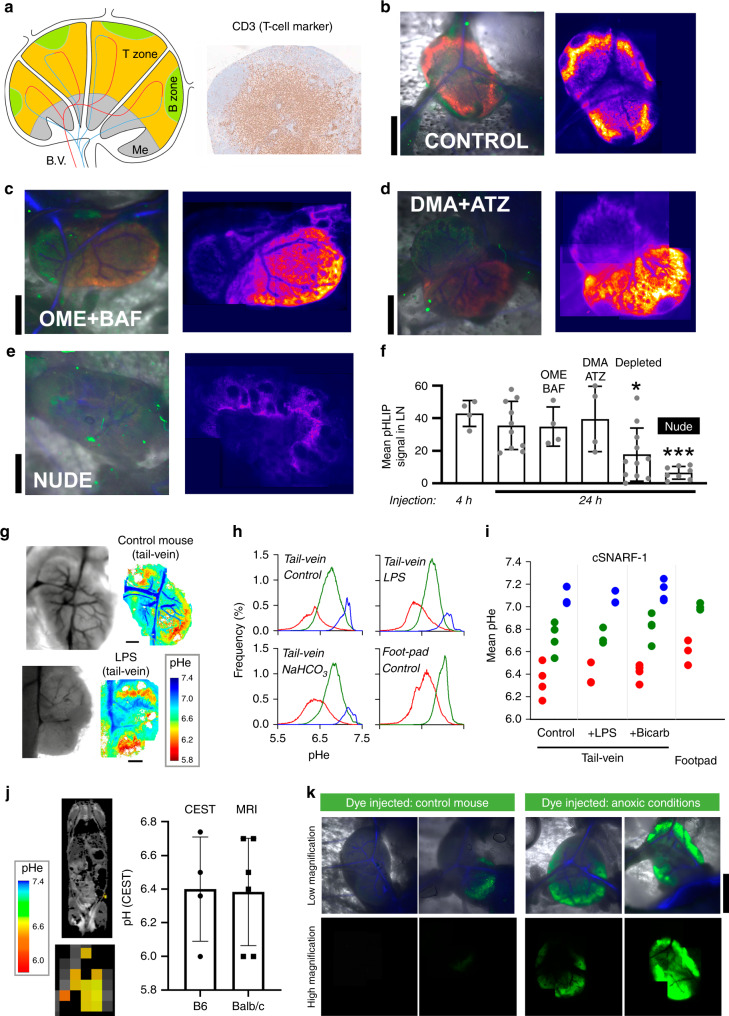
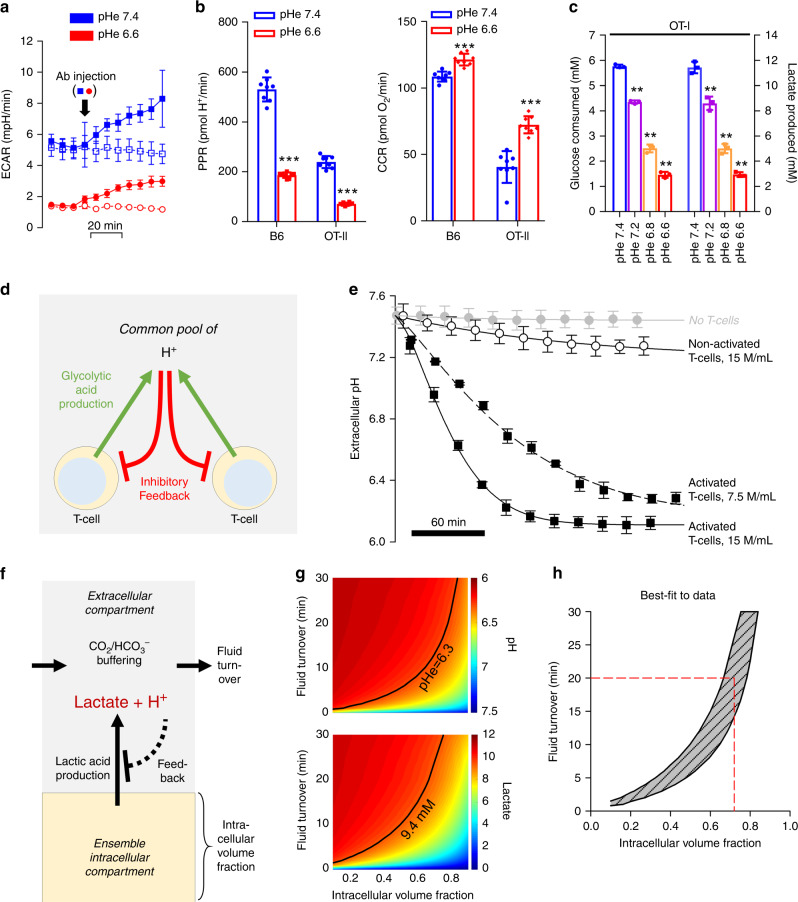
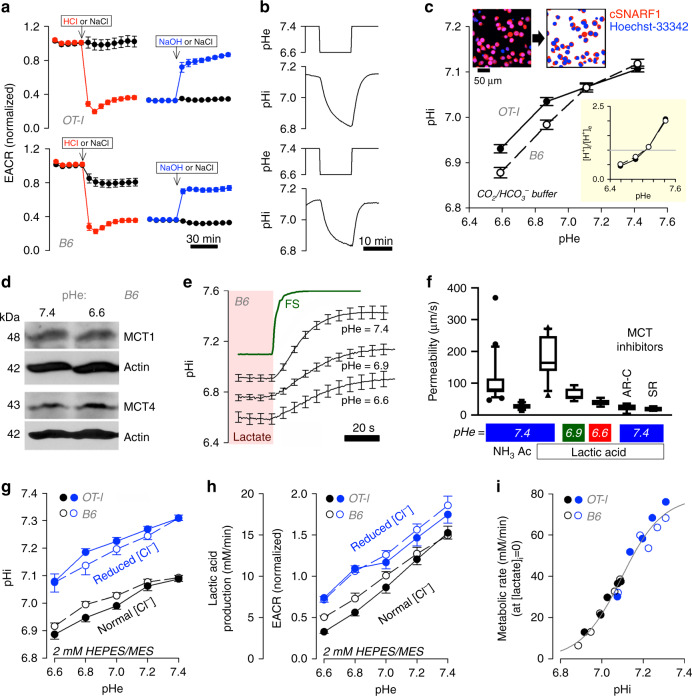
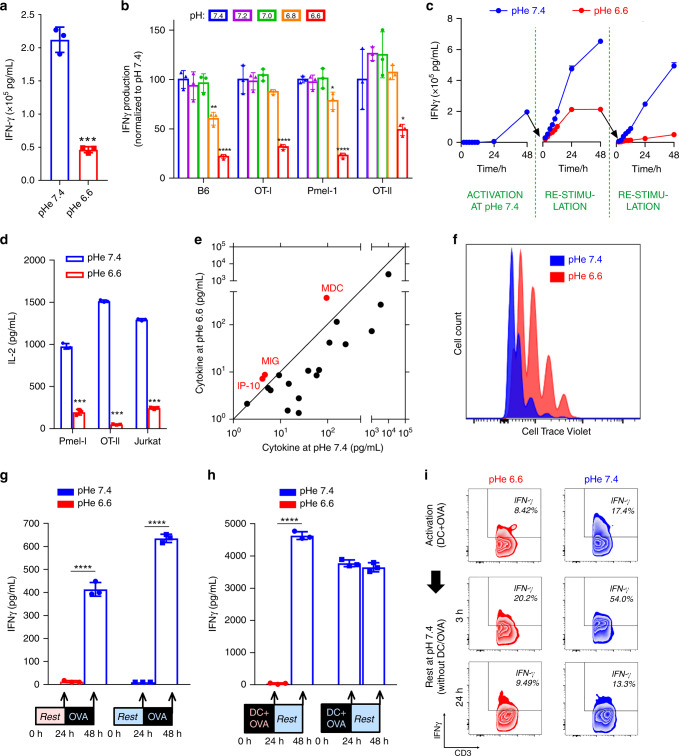
The acidic pH of tumors profoundly inhibits effector functions of activated CD8 + T-cells. We hypothesize that this is a physiological process in immune regulation, and that it occurs within lymph nodes (LNs), which are likely acidic because of low convective flow and high glucose metabolism. Here we show by in vivo fluorescence and MR imaging, that LN paracortical zones are profoundly acidic. These acidic niches are absent in athymic Nu/Nu and lymphodepleted mice, implicating T-cells in the acidifying process. T-cell glycolysis is inhibited at the low pH observed in LNs. We show that this is due to acid inhibition of monocarboxylate transporters (MCTs), resulting in a negative feedback on glycolytic rate. Importantly, we demonstrate that this acid pH does not hinder initial activation of naïve T-cells by dendritic cells. Thus, we describe an acidic niche within the immune system, and demonstrate its physiological role in regulating T-cell activation.


Conflict of interest statement

R.J.G. has research support form Helix Biopharma, who makes acid pH targeting agents. These agents were not used in the current work. O.A.A. and Y.K.R. are founders of pHLIP, Inc. They have shares in the company, but the company did not fund any part of the work reported in this paper, which was carried out in their academic laboratories. No other authors report competing interests.

Figures

Fig. 1
Fig. 1. Extracellular spaces of lymph node paracortical zones are acidic.
a Cartoon of lymph node (LN) showing zones occupied by T and B cells, blood vessels (B.V.) and the medulla (Me). Histological section of inguinal LN showing T-cell marker CD3 in paracortical zone (N = 3). b B6 mouse injected with pHLIP (40 µM in 60 µl) into footpad, followed by intravital imaging of inguinal LN 24 h later in window chamber. Left: composite image collected with ×1.6 objective for pHLIP-Cy5.5 (red; excited at 633 nm), autofluorescence (green; excited at 514 nm) and vasculature (blue; determined from transmission images). Right: montage of pHLIP fluorescence collected in overlapping fields of view with ×10 objective, summed across the depth of the LN (n = 10 mice). Experiment repeated on B6 mouse injected via the intraperitoneal cavity with c 200 µl of 12.5 mg/kg omeprazole (OME) and 1 mg/kg of bafilomycin (BAF) (n = 4). or d 200 µl of 5.2 mg/kg (5-N,N-dimethyl)amiloride (DMA) and 3.9 mg/kg acetazolamide (ATZ) 24 h prior to imaging (n = 3). e Experiment performed on athymic nude mouse, with same imaging settings, showing absence of pHLIP signal (n = 8). f Summary data for mean pHLIP fluorescence within LN boundary. Significance tested by one-way ANOVA with multiple comparisons (N = 5, 10, 4, 4, 8, 11); two sided at 5% significance. p-values compared to control: Depleted: P = 0.0237, Nude: P = 0.0004. g Intravital imaging of pH-sensitive cSNARF1 fluorescence in inguinal LN. Mice were injected with 70 kDa dextran-conjugated cSNARF1 into the tail-vein (20 mg/ml in 100 µl). Measurements on control mice, or mice treated with LPS (n = 4). h Statistical distribution of pHe data analyzed by Gaussian mixed models to separate pixels into clusters, representing compartments. Plots shows the pH-distribution in each of the LN compartments, averaged for all LNs. Note that compared to footpad injections, tail-vein injections detect an additional compartment corresponding to blood vessels. i Summary data for each LN compartment from 4, 3, 4, 3 LNs, respectively. j MRI-CEST pH imaging of control (B6) mice injected via i.v. with a 300 µl bolus of Isovue 370. pHe maps in inguinal LN region-of-interest are overlaid on anatomical T2-weighted images. Mean ± SEM pHe measured in B6 (n = 6) and BALB/c (n = 5) mice. k Intravital imaging for hypoxic regions using 12.5 nmoles of ImageIT-Green hypoxic probe injected into B6 mice via the footpad in a 50 µl volume. As a positive control, LNs were made anoxic by bubbling PBS with N2 and including the O2-scavenger dithionite (1 mM), followed by cessation of circulation by cervical dislocation. Upper panels: composite image collected with ×1.6 objective for ImageIT-Green (green; excited at 514 nm) and vasculature (blue; determined from transmission images). Bottom panels: montage of ImageIT-Green fluorescence collected in overlapping fields of view with ×10 objective, summed across the depth of the LN (N = 10 control and 10 anoxia). (Scale bars = 1.0 mm for be, k; 0.5 mm for g).
Fig. 2
Fig. 2. Feedback regulation of T-cell glycolysis by pH establishes an acidic extracellular milieu at the steady-state.
a Time course of extracellular acidification rate (ECAR) was measured by Seahorse in B6 T-cells (Mean ± SD, n = 7 biological samples.). Injection of activating antibody (or vehicle for control) at 20 min evoked an increase in ECAR, due to the activation of T-cell glycolysis. b Proton production rate (PPR) measured by Seahorse in B6 or OT-II T-cells is reduced under acidic conditions. In paired experiments on B6 or OT-II T-cells, oxygen consumption rate (OCR), measured by Seahorse, is increased under acidic conditions (two-tailed, unpaired t-test, mean ± SD, n = 8 biological samples. PPR (B6, p = 1.35E-11; OT-II, p = 1.62E-11), OCR (B6, p = 2.22E-5; OT-II, p = 1.14E-5). Asterisks (***) represent p < 0.0001). c Glucose consumption and lactate production as a function of pHe in OT-I T-cells, expressed as mean ± SD; n = 3 biological samples. Significance tested by one-way ANOVA with multiple comparisons p < 0.001. d Schematic diagram of feedback loop between lactic acid production by glycolysis, and its inhibitory feedback by extracellular pH. e Time course of pHe measured in 60 µl volumes of 5 mM HEPES-buffered media containing no cells, nonactivated T-cells or activated (CD3-coated plates, then incubated in media containing 2 µg/ml CD28) T-cells at the densities indicated. n = 3 biological replicates. Data shown as mean ± S.E.M. Activated T-cells acidify the restricted extracellular volume towards pH 6.3 within several hours. f Schematic representation of mathematical model used to simulate the relationship between extracellular pH and lactate for a system featuring glycolytic lactic acid production and feedback inhibition by extracellular pH, as determined from panel e (i.e. linear inhibition towards zero production at pH 6.3), for a LN paracortex of intracellular volume fraction vi, and fluid turnover (perfusion) of τ. (g) Results of simulation for extracellular pH (upper panel) and lactate (lower panel). Black line shows the combination of vi and τ that simulates experimentally observed data for pHe (6.3; Fig. 1) and lactate (9.4 mM; Fig. S5). h Replotting of the best-fit curves from panel g. Red dashed line shows solution of this mathematical problem using the literature value for τ of 20 min. This indicates that ~70% of the paracortical zone is occupied by T-cells, engaged in lactic acid production, the source of low pHe measured in LNs.
Fig. 3
Fig. 3. Mechanism of T-cell glycolysis inhibition by low pH.
a An injection of HCl abruptly reduces extracellular acidification rate (ECAR) in OT1 and B6 T-cells; this reverses upon an injection of NaOH. NaCl injections performed as sham controls. Solutions were lightly buffered with 2 mM HEPES/MES mixture and titrated to desired pH. Mean ± SEM (n = 4 biological replicates). b A reduction in extracellular pH (pHe) evokes a delayed fall in intracellular pH (pHi), as measured from cSNARF1 fluorescence (2 mM HEPES/MES mixture). Mean of 10 time course recordings; error bars not shown for clarity. c Fluorescence imaging of cells under superfusion with CO2/HCO3 buffer. Cells co-loaded with cSNARF1 (red) to report pH and Hoechst-33342 (blue) to exclude nuclear areas from the analysis. Plot shows relationship between pHe and pHi at the steady-state in OT1 and B6 cells. Note the transmembrane [H+] gradient, shown in inset, inverts near resting pHi. Mean ± SEM of 5 recordings of fields of view containing 40–60 cells. d Western blot for MCT1 (48 kDa) and MCT4 (43 kDa) relative to actin (42 kDa) on lysates collected from B6 T-cells that had been incubated at pHe 7.4 or 6.6 (N = 3). (See Supplementary Fig. S17 for full blot). e Measuring total MCT activity from the rate of pHi change driven by transmembrane lactate efflux. T-cells under superfusion were equilibrated with one of the three conditions, 30 mM lactate at pHe 7.4, 15 mM lactate at pHe 6.9 or 7.5 mM lactate at pHe 6.6. Note that, for lower pHe, the lactate concentration was reduced to ensure that comparable levels of lactic acid are present at equilibrium. Rapid switching to lactate-free solution at the same pHe evoked net lactate efflux. Apparent permeability to lactic acid can be calculated from the rate of pHi change, buffering capacity and transmembrane gradient. To confirm that the ensuing pHi response was not rate-limited by the speed of solution exchange, one solution was labelled with fluorescein sulphonic acid (FS) and the rate of fluorescence-change indicated an exchange time constant of 2.6 s. Mean ± SEM of 10 cells per condition. f Apparent membrane permeability for NH3 (added as 15 mM NH4Cl; n = 21) acetic acid (Ac; 30 mM NaAcetate; n = 12) and lactic acid (7.5–30 mM Na Lactate) at high (n = 12), intermediate (n = 6), and low (n = 8) pHe. Indicated experiments performed in the presence of MCT inhibitors AR-C (AR-C155858; 10 µM; n = 7) and SR (SR13800; 10 µM;; n = 7). Mean ± S.E.M. of 7–15 cells per condition. Box shows median and 25–75% percentiles and whiskers show 10–90% percentile. g Steady-state relationship between pHe and pHi mapped for 2 mM HEPES/MES solution containing either normal (140 mM) or reduced [Cl] (7 mM), iso-osmotically substituted with gluconate to offset pHi at constant pHe. Mean±SEM of 6 recordings with 40–60 cells each. h EACR, calibrated to units of lactic acid-production rate (mM/min), is shown not to be a unique function of pHe; Data shown are Mean ± S.D., n = 14 wells over two independently seeded plates. i Data from g and h analyzed to generate a relationship between metabolic rate, extrapolated to lactate-free conditions (see Eq. (1)). Best-fit is a simple function of pHi, described by a Hill curve.
Fig. 4
Fig. 4. T-cell effector functions are inhibited at acidic pH.
a Interferon γ (IFNγ) production from C57BL/6 (B6) T-cells is reduced at low pHe, as determined by ELISA; n = 3, p = 0.00013. b INFγ production, measured over a range of pHe in T-cells from B6 mice as well as three antigen-specific strains. n = 3. IFNγ levels were compared with those at pHe 7.4 within each strain. B6 (pHe 6.8, p = 0.0034; pHe 6.6, p = 0.00013), OT-I (pHe 6.6, p = 0.0013), Pmel-1 (pHe 6.8, p = 0.017; pHe 6.6, p = 6.25E-6), OT-II (pHe 6.6, p = 0.046). c Time course of IFNγ levels in media following pH-manoeuvres that demonstrate the reversal of acid inhibition upon subsequent exposure to alkaline pH (rescue experiment); n = 3. d Interleukin-2 (IL-2) release, measured by ELISA in Pmel-1 and OT-II T-cells and a Jurkat leukaemia cell line, is reduced at low pHe; n = 3. Pmel-1, p = 8.77E-6; OT-II, p = 6.85E-9; Jurkat, p = 5.64E-8. e Relationship between cytokine levels at low and high pH, determined in paired experiments by the Cytokine Beads Array (CBA) assay. For most cytokines, with the exception of those highlighted in red (IP-10, MIG, MDC), acidic conditions evoked a reduction in release. f Rate of B6 cell proliferation measured by CellTrace Violet assay. g IFNγ production was measured, by ELISA, at the end of a 24 h preconditioning period (no OVA added) at either pHe 6.6 or 7.4, and then at the end of a consecutive 24 h period in the presence of antigen (OVA) at pHe 7.4. IFNγ production can be activated irrespective of whether cells had been preconditioned at pHe 6.6 or 7.4; n = 3. pHe 6.6 precondition, p = 2.82E-5; pHe 7.4 precondition, p = 4.25E-7. Asterisks (****) represent p < 0.0001. h IFNγ production by T-cells activated with dendritic cells (DC) and antigen (OVA) measured after 24 h at pHe 6.6 or 7.4, followed by measurements at the end of a subsequent 24 h period without stimulation at pHe 7.4 (rest). T-cells can become activated by DC/OVA at acidic or alkaline pHe, and fully retain the capacity to produce cytokines when transferred to alkaline media; n = 3. pHe 6.6 activation, p = 3.22E-7; pHe 7.4 activation, p = 0.29. Asterisks (****) represent p < 0.0001. i Flow cytometry. Intracellular IFNγ staining of T-cells activated with DC and antigen (OVA) measured after 24 h of treatment in either pHe 6.6 or 7.4 (top panels). Cells were then transferred to pHe 7.4 to rest in the absence of DC and OVA, and measurements were performed after 3 h of resting. All the experiments were repeated at least twice and expressed as mean ± SD and analyzed by two-tailed, unpaired t-test unless indicated otherwise. Significance level: *p < 0.05; **p < 0.01; ***p < 0.001; ****p < 0.0001.

Similar articles

Cited by

References

    1. Card CM, Yu SS, Swartz MA. Emerging roles of lymphatic endothelium in regulating adaptive immunity. J. Clin. Invest. 2014;124:943–952. - PMC - PubMed
    1. Hirosue S, et al. Steady-state antigen scavenging, cross-presentation, and CD8+ T cell priming: a new role for lymphatic endothelial cells. J. Immunol. 2014;192:5002–5011. - PMC - PubMed
    1. Buck MD, Sowell RT, Kaech SM, Pearce EL. Metabolic instruction of immunity. Cell. 2017;169:570–586. - PMC - PubMed
    1. Chang CH, et al. Posttranscriptional control of T cell effector function by aerobic glycolysis. Cell. 2013;153:1239–1251. - PMC - PubMed
    1. Ohta A, et al. In vivo T cell activation in lymphoid tissues is inhibited in the oxygen-poor microenvironment. Front. Immunol. 2011;2:27. - PMC - PubMed

Publication types

Substances