. 2020 Aug 17;11(1):4116.
doi: 10.1038/s41467-020-17885-z.

OSMR controls glioma stem cell respiration and confers resistance of glioblastoma to ionizing radiation

Affiliations

OSMR controls glioma stem cell respiration and confers resistance of glioblastoma to ionizing radiation

Ahmad Sharanek et al. Nat Commun. .

Abstract

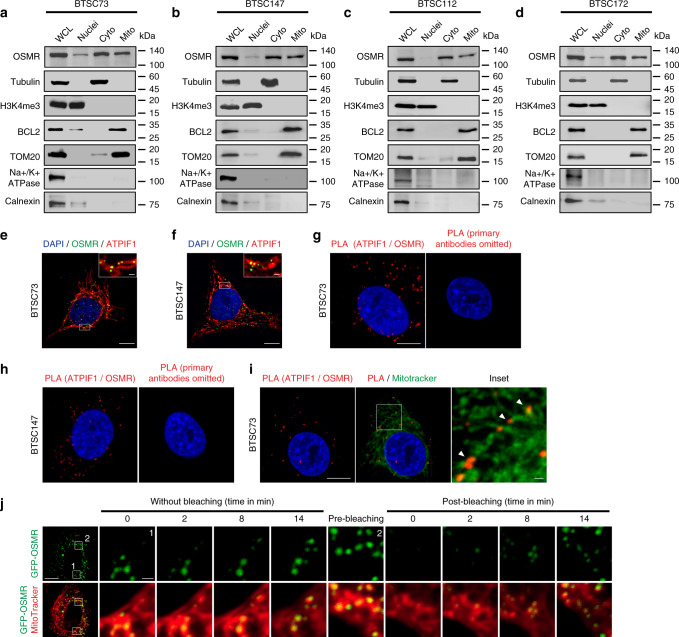
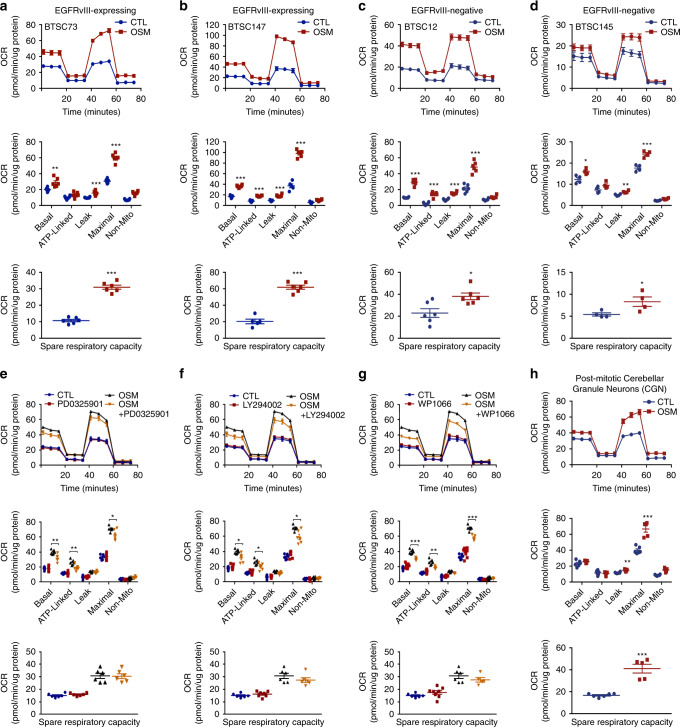
Glioblastoma contains a rare population of self-renewing brain tumor stem cells (BTSCs) which are endowed with properties to proliferate, spur the growth of new tumors, and at the same time, evade ionizing radiation (IR) and chemotherapy. However, the drivers of BTSC resistance to therapy remain unknown. The cytokine receptor for oncostatin M (OSMR) regulates BTSC proliferation and glioblastoma tumorigenesis. Here, we report our discovery of a mitochondrial OSMR that confers resistance to IR via regulation of oxidative phosphorylation, independent of its role in cell proliferation. Mechanistically, OSMR is targeted to the mitochondrial matrix via the presequence translocase-associated motor complex components, mtHSP70 and TIM44. OSMR interacts with NADH ubiquinone oxidoreductase 1/2 (NDUFS1/2) of complex I and promotes mitochondrial respiration. Deletion of OSMR impairs spare respiratory capacity, increases reactive oxygen species, and sensitizes BTSCs to IR-induced cell death. Importantly, suppression of OSMR improves glioblastoma response to IR and prolongs lifespan.


Conflict of interest statement

The authors declare no competing interests.

Figures

Fig. 1
Fig. 1. Presence of mitochondrial OSMR in human BTSCs.
ad Four different patient-derived BTSC lines were subjected to subcellular fractionation, and the lysates for each fraction were analyzed by immunoblotting using antibodies to OSMR. α-Tubulin, H3K4me3, BCL2/TOM20, Na+/K+ ATPase, and calnexin. WCL: Whole-cell lysates; Cyto: cytoplasmic; Mito: mitochondrial. The Western blots represent a minimum of three replicates from different passage numbers for each BTSC. e, f BTSC73 and BTSC147 were subjected to immunostaining using antibodies to OSMR (green) and the mitochondrial matrix protein ATP synthase inhibitor F1 (ATPIF1, red). Nuclei were stained with DAPI. White rectangles mark the inset to demonstrate the co-localization of OSMR with ATPIF1. g, h PLA of OSMR and ATPIF1 were performed in BTSC73 (g) and BTSC147 (h). Primary antibodies were omitted as controls. i Double labeling of the PLA signal (red) and the MitoTracker (green) in BTSC73 is shown. j A FRAP assay was performed on BTSC73 transduced with GFP-OSMR and stained with MitoTracker (red). Different regions of interest (ROIs) containing GFP-OSMR in the mitochondria were defined. ROI1 indicates a non-bleached area and ROI2, a photobleached area. The fluorescence recovery was monitored over time following photobleaching. Images were obtained on a laser scanning confocal microscope (ZEISS LSM 800). Scale bar = 10 μm; Inset scale bar = 1 μm. Representative images of three independent experiments are shown.
Fig. 2
Fig. 2. OSMR interacts with different components of ETC in human BTSCs.
a, b Mitochondrial fractions from BTSC73 (a) and BTSC147 (b) were treated with 0.5 mg/mL proteinase K or proteinase K and 1% Triton X-100. Lysates were analyzed by immunoblotting using indicated antibodies. cf WCL and mitochondrial fractions from BTSC73 (c, d) and BTSC147 (e, f) were subjected to immunoprecipitation using antibodies to OSMR or mouse IgG control, followed by immunoblotting with mtHSP70 and TIM44 antibodies. g, h PLA of OSMR and mtHSP70 were performed in BTSC73 (g) and BTSC147 (h). Primary antibodies were omitted for the controls. i Double labeling of the PLA signal (red) from the OSMR/mtHSP70 interaction and MitoTracker (green) is shown. j OSMR protein expression level was assessed in the mitochondrial fractions obtained from BTSC73 electroporated with siRNA control (siCTL) or siRNA against mtHSP70 (simtHSP70). BLC2 was used as a loading control. k OSMR protein expression level was assessed in the mitochondrial fractions obtained from BTSC73 electroporated with siCTL or siRNA against TIM44 (siTIM44). BCL2 was used as a loading control. lo WCL or mitochondrial fractions from BTSC73 (l, m) and BTSC147 (n, o) were subjected to immunoprecipitation using an antibody to OSMR or mouse IgG control followed by immunoblotting with NDUFS1 and NDUFS2 antibodies. p, q PLA analyses of OSMR/NDUFS1 and OSMR/NDUFS2 were carried out in BTSC73 (p) and BTSC147 (q). r, s Double labeling of the PLA signal (red) and the MitoTracker (green) is shown. Images were obtained with a 63X objectives on a laser scanning confocal microscope (ZEISS LSM 800). Scale bar = 10 μm. Inset scale bar = 1 μm. Representative images of three independent experiments are shown. The Western blots represent a minimum of three replicates from different passage numbers for each BTSC.
Fig. 3
Fig. 3. OSMR regulates mitochondrial OXPHOS and ROS generation.
ae Enzymatic activities of mitochondrial ETC were analyzed in OSMR CRISPR or control BTSC73. Complex I, **p = 0.0037 (a); Complex II, **p = 0.0027 (b); Complex III, *p = 0.0126 (c); Complex IV, *p = 0.0488 (d); ATP synthase, p = 0.2506 (e); Unpaired two-tailed t-test, n = 4. f ROS generation was measured by flow cytometry using H2DCFDA in OSMR CRISPR and control BTSC73. ***p < 0.0001; Unpaired two-tailed t-test, n = 4. g Mitochondrial superoxide abundance was assessed by flow cytometry using MitoSOX in OSMR CRISPR and control BTSC73. ***p < 0.0001; Unpaired two-tailed t-test, n = 4. h Tumor sections from OSMR CRISPR and control BTSC73 were subjected to staining using OxyIHC oxidative stress detection kit. Representative images of 4 different tumor sections are shown. Scale bar = 20 µm. i RFP OSMR or RFP control BTSC73 (in the absence and presence of OSM) were subjected to bioenergetic analysis using a Seahorse XFe96 Bioenergetic Flux Analyzer. Oxygen consumption rates (OCR) are plotted (top panel). Data is plotted to demonstrate the differences between basal, ATP-linked, proton leak, maximal, and non-mitochondrial (mito) respiration (middle panel). Spare respiratory capacity (SRC), which is maximal minus basal respiration, is plotted (bottom panel). ***p < 0.0001 for each pairwise comparison except: *pLeak (RFP CTL vs. RFP OSMR) = 0.0225, **pMaximal (RFP CTL vs. RFP OSMR) = 0.0021, ***pSRC (RFP CTL vs. RFP OSMR) = 0.0004; One-way ANOVA followed by Dunnett’s test, n ≥ 5. j BTSC73 transfected with non-targeting (NT) gRNA control and two different gRNAs against OSMR were subjected to bioenergetic analysis as described in i. ***p < 0.0001; One-way ANOVA followed by Dunnett’s test, n ≥ 5. k BTSC147 transduced with two different OSMR shRNA (shOSMR 1 and shOSMR 2) and scramble shRNA control (SCR CTL) were subjected to bioenergetic analysis as described in i. ***p < 0.0001 for each pairwise comparison except: ***pSRC (CTL vs. shOSMR 2) = 0.0003; One-way ANOVA followed by Dunnett’s test, n ≥ 5. Data are presented as the mean ± SEM. n represents an independent biological sample.
Fig. 4
Fig. 4. The ligand OSM regulates mitochondrial OXPHOS.
a, b Bioenergetic analysis using a Seahorse XFe96 Bioenergetic Flux Analyzer in the absence and presence of OSM was performed in EGFRvIII-expressing BTSCs. BTSC73 (a): ***p < 0.0001 for each pairwise comparison except: **pBasal = 0.0045, ***pLeak = 0.0006; Unpaired two-tailed t-test, n = 6; BTSC147 (b): ***p < 0.0001 for each pairwise comparison; Unpaired two-tailed t-test, n ≥ 5. c, d Bioenergetic analysis in the absence and presence of OSM was performed in BTSCs lacking the EGFRvIII mutation. BTSC12 (c): ***p < 0.0001 for each pairwise comparison except: *pSRC = 0.0124; Unpaired two-tailed t-test, n = 6; BTSC145 (d): *pBasal = 0.0179, *pSRC = 0.0435, **pLeak = 0.0056, ***pMaximal = 0.0008; Unpaired two-tailed t-test, n = 4. eg BTSC73 were subjected to bioenergetic analysis in the absence and presence of 10 ng/mL of OSM and either of pharmacological inhibitors 10 µM PD0325901, 10 µM LY294002, or 20 µM WP1066. PD0325901 (e): *pMaximal = 0.0303, **pATP-Linked = 0.0088, **pBasal = 0.0071; Unpaired two-tailed t-test, n = 6; LY294002 (f): *pATP-Linked = 0.0322, *pBasal = 0.0104, *pMaximal = 0.0101; Unpaired two-tailed t-test, n ≥ 6; WP1066 (g): **pATP-Linked = 0.0029, ***pBasal = 0.0001, ***pMaximal = 0.0002; Unpaired two-tailed t-test n ≥ 5. h OSMR-overexpressing primary CGN cultures were subjected to bioenergetic analysis in the absence or presence of OSM. **pLeak = 0.0014, ***pMaximal = 0.0001, ***pSRC < 0.0001; Unpaired two-tailed t-test, n ≥ 5. Data are presented as the mean ± SEM. n represents an independent biological sample.
Fig. 5
Fig. 5. OSM/OSMR confers resistance of BTSCs to IR.
a, b LDA was performed following 4 Gy of IR in the absence or presence of OSM. BTSC73 (a): 200 cells (**pCTL vs. OSM = 0.0011, **pIR vs. IR + OSM = 0.0054, ***pCTL vs. IR = 0.0007), 100 cells (*pCTL vs. OSM = 0.0185, **pCTL vs. IR = 0.0078, **pIR vs. IR + OSM = 0.0093), 50 cells (*pCTL vs. OSM = 0.0246, *pCTL vs. IR = 0.0389, **pIR vs. IR + OSM = 0.0054); BTSC147 (b): 200 cells (**pCTL vs. OSM = 0.0012, **pIR vs. IR + OSM = 0.0088, ***pCTL vs. IR = 0.0009), 100 cells (*pIR vs. IR + OSM = 0.0236, **pCTL vs. OSM = 0.0026, **pCTL vs. IR = 0.0012), 50 cells: (*pCTL vs. OSM = 0.0301, **pCTL vs. IR = 0.0039, **pIR vs. IR + OSM = 0.0087), 25 cells (*pCTL vs. OSM = 0.0382, **pCTL vs. IR = 0.0094), 12 cells (*pIR vs. IR + OSM = 0.0207, **pCTL vs. OSM = 0.0044). c, d ELDA was performed following 4 Gy of IR in the absence or presence of OSM in either BTSC73 (c) or BTSC147 (d). e, f LDA were performed following 4 Gy of IR in OSMR KD and control BTSCs. ***p < 0.0001 except: BTSC73 (e): 200 cells (**pIR vs. IR + OSMR CRISPR = 0.0030, ***pCTL vs. OSMR CRISPR = 0.0004), 100 cells (*pIR vs. IR + OSMR CRISPR = 0.0286, **pCTL vs. IR = 0.0021, **pCTL vs. OSMR CRISPR = 0.0052), 50 cells (**pCTL vs. IR = 0.0061, ***pCTL vs. IR + OSMR CRISPR = 0.0004), 25 cells (**pCTL vs. IR = 0.0018, **pCTL vs. OSMR CRISPR + IR = 0.0016), 12 cells (*pCTL vs. IR + OSMR CRISPR = 0.0404); BTSC147 (f): 200 cells (*psiCTL vs. siOSMR = 0.0184), 100 cells (*pIR vs. IR + siOSMR = 0.0414, **psiCTL vs. siOSMR = 0.0035), 50 cells (**psiCTL vs. siOSMR = 0.0050), 25 cells (*psiCTL vs. siOSMR = 0.0264, ***pCTL vs. IR = 0.0001), 12 cells (*psiCTL vs. IR = 0.0194, **psiCTL vs. IR + siOSMR = 0.0070). g, h ELDA was performed following 4 Gy of IR in OSMR CRISPR vs. control BTSC73 (g) or in siOSMR vs. siCTL BTSC147 (h). i, j Cell viability was measured by alamarBlue assay following 4 Gy of IR in OSMR KD and control BTSCs. ***p < 0.0001 except: BTSC73 (i): *pIR vs. IR + OSMR CRISPR = 0.0490, **pCTL vs. OSMR CRISPR = 0.0044, ***pCTL vs. IR = 0.0003; BTSC147 (j): *pIR vs. IR + siOSMR = 0.0213. Data are presented as the mean ± SEM, n = 3 independent biological cell cultures, one-way ANOVA followed by Tukey’s test for multiple comparisons.
Fig. 6
Fig. 6. OSMR CRISPR induces ROS generation and promotes apoptosis in response to IR.
ac OSMR CRISPR and control BTSC73 were subjected to IR (8 Gy). ROS generation was analyzed by flow cytometry following 24 h after IR using H2DCFDA (a): *pCTL vs. OSMR CRISPR = 0.0416, *pOSMR CRISPR vs. IR + OSMR CRISPR = 0.0158, **pIR vs. IR + OSMR CRISPR = 0.0033, ***pCTL vs. IR + OSMR CRISPR = 0.0004; One-way ANOVA followed by Tukey’s test for multiple comparisons, n = 3 independent biological samples. Mitochondrial superoxide abundance was assessed by flow cytometry 24 h after IR using MitoSOX (b): ***p < 0.0001 for each pairwise comparison except: ***pCTL vs. IR = 0.0003, ***pOSMR CRISPR vs. IR + OSMR CRISPR = 0.0002; One-way ANOVA followed by Tukey’s test for multiple comparisons, n = 3 independent biological samples. Apoptosis analysis was performed by flow cytometry 48 h after IR by annexin V and PI double staining (c). The percentage of cell death (annexin V positive cells) is presented in the histogram (right panel), **pCTL vs. IR = 0.0094, **pIR vs. IR + OSMR CRISPR = 0.0029, ***pOSMR CRISPR vs. IR + OSMR CRISPR = 0.0002, ***pCTL vs. IR + OSMR CRISPR < 0.0001; One-way ANOVA followed by Tukey’s test for multiple comparisons, n = 3 independent biological samples. Data are presented as the mean ± SEM. Representative scatter plots (left) and histograms (right) of flow cytometry analyses are shown.
Fig. 7
Fig. 7. Suppression of OSMR improves glioblastoma response to therapy.
a Schematic diagram of the experimental procedure in which OSMR CRISPR and control BTSC73 (3 × 105 cells per brain) were intracranially injected into randomized Fox Chase SCID mice and then treated with or without 4 Gy of IR. b Representative bioluminescence real-time images tracing BTSCs and tumor growth are shown. c Intensities of luciferase signal were quantified at different time points using Xenogen IVIS software. *pOSMR CRISPR vs. IR + OSMR CRISPR, day 26 = 0.0289; Unpaired two-tailed t-test, n = 4 mice. d Kaplan–Meier survival plot was graphed to evaluate mice lifespan in each group, mice were collected at end stage. *pCTL vs. IR = 0.0311, **pCTL vs. OSMR CRISPR = 0.0069, **pCTL vs. IR + OSMR CRISPR = 0.0069, **pOSMR CRISPR vs. IR + OSMR CRISPR = 0.0067; Two-sided log-rank test, n = 4 mice. e Coronal sections of mouse brains were stained with hematoxylin and eosin on day 22 after injection. Representative images of 3 different tumor sections are shown. Scale bar = 1 mm. Inset scale bar = 0.1 mm. f Tumor sections from OSMR CRISPR and control BTSC73 treated with or without IR (4 Gy) were stained with MitoSOX. The fluorescent intensity was quantified using ImageJ software. ***p < 0.0001 for each pairwise comparison except: *pCTL vs. OSMR CRISPR = 0.0215, *pCTL vs. IR = 0.0129; One-way ANOVA followed by Tukey’s test for multiple comparisons, n = 4 different tumor sections. Data are presented as the mean ± SEM.

Similar articles

Cited by

References

    1. Stupp R, et al. Radiotherapy plus concomitant and adjuvant temozolomide for glioblastoma. N. Engl. J. Med. 2005;352:987–996. - PubMed
    1. Louis DN, et al. The 2016 World Health Organization classification of tumors of the central nervous system: a summary. Acta Neuropathol. 2016;131:803–820. - PubMed
    1. Chen J, McKay RM, Parada LF. Malignant glioma: lessons from genomics, mouse models, and stem cells. Cell. 2012;149:36–47. - PMC - PubMed
    1. Singh SK, et al. Identification of human brain tumour initiating cells. Nature. 2004;432:396–401. - PubMed
    1. Galli R, et al. Isolation and characterization of tumorigenic, stem-like neural precursors from human glioblastoma. Cancer Res. 2004;64:7011–7021. - PubMed

Publication types

MeSH terms

LinkOut - more resources