. 2020 Aug 17;11(1):4115.
doi: 10.1038/s41467-020-17920-z.

Selective inhibition of STAT3 signaling using monobodies targeting the coiled-coil and N-terminal domains

Affiliations

Selective inhibition of STAT3 signaling using monobodies targeting the coiled-coil and N-terminal domains

Grégory La Sala et al. Nat Commun. .

Abstract

The transcription factor STAT3 is frequently activated in human solid and hematological malignancies and remains a challenging therapeutic target with no approved drugs to date. Here, we develop synthetic antibody mimetics, termed monobodies, to interfere with STAT3 signaling. These monobodies are highly selective for STAT3 and bind with nanomolar affinity to the N-terminal and coiled-coil domains. Interactome analysis detects no significant binding to other STATs or additional off-target proteins, confirming their exquisite specificity. Intracellular expression of monobodies fused to VHL, an E3 ubiquitin ligase substrate receptor, results in degradation of endogenous STAT3. The crystal structure of STAT3 in complex with monobody MS3-6 reveals bending of the coiled-coil domain, resulting in diminished DNA binding and nuclear translocation. MS3-6 expression strongly inhibits STAT3-dependent transcriptional activation and disrupts STAT3 interaction with the IL-22 receptor. Therefore, our study establishes innovative tools to interfere with STAT3 signaling by different molecular mechanisms.


Conflict of interest statement

A.K. and S.K. are listed as inventors on issued and pending patents on the monobody technology filed by The University of Chicago (US Patent 9512199 B2 and related pending applications). The other authors declare no competing interests.

Figures

Fig. 1
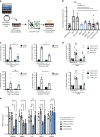
Fig. 1. Selection of high affinity, STAT3-selective monobody binders.
a Schematic representation of the recombinant STAT3 constructs used for monobody selection. b Binding titration of yeast cells displaying monobodies (MS3-6: light blue line, MS3-N3: dark blue line) at their surface to recombinant STAT3 proteins. The mean fluorescence intensity of yeast cells bound to the target are plotted as a function of the protein concentration. Data from three individual experiments, mean ± SD are shown and a curve fitting 1:1 binding model was used. c Isothermal calorimetric titration (ITC) of STAT3 (100 µM) to a MS3-6 solution (10 µM) performed at 25 °C. The upper panel shows raw heat signal, while the lower panel shows the integrated calorimetric data of the area for each peak. A best fit 1:1 binding model was used and is illustrated by a black line (Microcal software). KD and stoichiometry values (N) are indicated in the figure. ∆H (kcal mol−1) = −22.5 ± 0.5; ∆G (kcal mol−1) = −11.1. d Representative immunoblot analysis from three independent experiments of monobody-VHL fusion expression overtime upon doxycycline treatment (1 µg ml−1) leading to STAT3 degradation. e STAT3 degradation levels were quantified and plotted from three independent experiments. Mean ± SD are shown and significance is indicated according to a two-sided unpaired t-test against HA4-Y87A control: MS3-6 *P = 0.033, **P = 0.0011, MS3-N3 *P = 0.0125. Source data are provided as a source data file.
Fig. 2
Fig. 2. Monobody inhibition of STAT3 transcriptional activity.
a Scheme depicting the initial screening strategy to identify monobodies with STAT3 inhibitory activity. b Luciferase reporter activity inductions normalized to that of unstimulated cells, which was arbitrarily set to 1, are reported for the expression of the indicated monobodies and control treatments. Results from two individual experiments performed in triplicate and/or duplicate are shown (data presented as mean ± SD, n = 5 or 6). Two-tailed unpaired t-test analysis was performed against the HA4-Y87A monobody control: MS3-6 **P = 0.0027, Ruxolitinib *P = 0.0158, siRNA JAK1 *P = 0.0147, STAT3-Y705F *P = 0.028. c BW5147 or Ba/F3 cells (107) were electroporated with the monobody plasmid, the pGL3-Pap1 luciferase reporter plasmid as a specific promoter for STAT3 activation and the pRL-TK plasmid. Cells were stimulated with control medium or murine IL-9 (100 ng ml−1, left upper panel, n = 11), human IL-22 (500 ng ml−1, right upper panel, n = 12), human IL-24 (HEK293 supernatant 2%, lower left panel, n = 9) or human IFNλ3 (HEK293 supernatant 2%, lower right panel, n = 6) for 4 h. Data are presented as mean ± SEM from two to four independent experiments performed in triplicates. d Luciferase assay on A549 with inducible monobody (HA4-Y87A or MS3-6) expression. A549 cells (5 × 103) were plated in 96-well plate and treated for 24 h with control medium or doxycycline (1 µg ml−1). Cells were transiently transfected with the pGL3-Pap1 luciferase reporter plasmid and the pRL-TK plasmid as internal control of transfection. In all, 4 h after transfection, cells were stimulated with control medium or human IL-6 (100 ng ml−1, upper panel) or human IL-22 (500 ng ml−1, lower panel) for 20 h. Data are presented as mean ± SEM of three independent experiments performed in triplicates. Significance in c, d is shown according to two-tailed Mann–Whitney test: *P = 0.026, ****P ≤ 0.0001. e RT-qPCR for expression of STAT3 downstream genes in A549 cells expressing monobodies upon IL-22 stimulation (100 ng ml-1, 1 hr at 37 °C). Gene expression was normalized to actin and is presented as fold change against that of untreated A549 cells (no monobody expression), which was set to 1. Data from three independent experiments performed in triplicates (n = 9) are presented as mean ± SD. Significance was calculated against mRNA levels in the HA4-Y87A monobody control conditions. Significance is shown according to two-tailed unpaired t-test analysis: *P ≤ 0.05, **P ≤ 0.01, ***P ≤ 0.001, ****P ≤ 0.0001. Source data are provided as a source data file.
Fig. 3
Fig. 3. MS3-6 inhibits STAT3 DNA binding, but does not bind the SH2 domain.
a Addition of increasing recombinant MS3-6 concentrations to a STAT3/phospho-gp130 peptide complex. Fluorescence polarization was measured at the indicated concentration and bound pY-peptide relative to samples in the absence of MS3-6 are plotted. Data from three independent experiments (mean ± SD). b Addition of increasing concentrations of recombinant MS3-6 (blue line and grey dashed line) to a pY705-STAT3 dimer bound to fluorescent DNA probes corresponding to downstream promoter sequences (SOCS3 and a2M). Fluorescence polarization was measured at the indicated concentrations of monobodies and bound DNA levels relative to samples in the absence of monobodies are plotted. All fluorescence polarization experiments were performed at 25 °C. Data from two independent experiments (mean ± SD). Significance according to a two-tailed unpaired t-test analysis: *P ≤ 0.05, **P ≤ 0.01. Source data are provided as a source data file.
Fig. 4
Fig. 4. Co-crystal structure of MS3-6 bound to the STAT3.
a Cartoon representation of the structure of STAT3 (light gray) and monobody MS3-6 (blue). The upper panel shows an overview of MS3-6 binding to the coiled-coil domain of STAT3, with key residues of the nuclear localization sequence (NLS) in close proximity to the monobody binding site highlighted in red. The lower panel shows a magnification of the binding interface with epitope residues (threshold set at 4 Å) depicted as sticks. b Surface representation of STAT3 (light gray), with the area covered by the monobody colored in blue. c Structural alignment of the coiled-coil domains of STAT3 in complex with MS3-6 together with an unbound STAT3 structure previously published (PDB: 4E68, light brown). Monobody binding leads to a conformational distortion of the helixes α1 and α2. The angles formed between helices are indicated in green and red, respectively.
Fig. 5
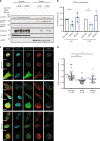
Fig. 5. MS3-6 reduces STAT3 nuclear localization.
a Representative immunoblot analysis of cellular fractionation experiments from three independent experiments. A549 expressing monobodies upon 48 h of 1 µg ml−1 doxycycline treatment were stimulated with either IL-6 or IL-22 for 15 min. Nuclear (RCC1) and cytosolic (Tubulin) fractions were recovered and probed for total, p-Y705 and p-S727 STAT3. Quantification of three independent experiments normalized to the HA4-Y87A monobody control are shown in b and are plotted as mean ± SD. Significance according to a two-tailed unpaired t-test analysis: *P = 0.0278, **P = 0.0028. c Confocal microscopy images from two independent experiments of HEK293 cells expressing a monobody-GFP fusion and treated with IL-6 to assess nuclear translocation. Scale bar represents 10 µm. The right column shows the outlines used to determine nuclear and cellular compartments indicated by blue and green lines, respectively, using the CellProfiler software. The number of individual cells analyzed (n) is indicated on the figure. Quantification of STAT3 nuclear/cytoplasmic levels from two independent experiments is shown in d. Significance according to a two-tailed unpaired t-test analysis: **P = 0.0065, ****P ≤ 0.0001. The number of analyzed cells is indicated below the graph. Source data are provided as a source data file.
Fig. 6
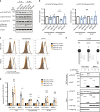
Fig. 6. MS3-6 reduces STAT3 Y705 phosphorylation levels upon IL-22 stimulation.
a Representative immunoblot from five (pY705) and three (pS727) independent experiments of STAT3 phosphorylation levels following IL-6 and IL-22 stimulation for 15 min. All immunoblots are available as Source data Files. b Quantification (mean ± SD) of the results in a from all independent experiments for the indicated STAT3 phosphorylation sites. Significance according to an unpaired two-tailed t-test analysis: ****P ≤ 0.0001. c Flow cytometry analysis on Ba/F3 cells expressing IL-22R. Four hours after electroporation of the monobody vectors (15 µg), cells were stimulated with IL-22 (500 ng ml−1) and staining was performed. A live-cell gating strategy was applied and phospho-STAT3 staining was analyzed in cMyc-tag+ and cMyc-tag cells. Unstimulated cells are reported as colored bar plot and stimulated cells are reported as empty bar plots. d Quantification of pY705-STAT3 staining from c. Data are presented as mean ± SEM of two independent experiments performed in duplicates (n = 4). Significance according to a two-tailed Mann–Whitney test analysis: *P ≤ 0.05. e Upper panel, schematic representation of GST fusion proteins with intracytoplasmic domain of IL-22R. Lower panel, COS-7 cells were seeded in six-well plate and transfected with a vector coding for the GST-fusion protein or STAT3. Cells were lysed and the recovered STAT3 protein was mixed with the recombinant monobody (10 µM) before incubation with IL-22R-GST overnight. Proteins eluted on GST SpinTrap columns as well as input samples were analyzed by western blot with an anti-STAT3 antibody. Membrane was then re-probed with anti-GST and anti-tag antibodies. Source data are provided as a source data file.
Fig. 7
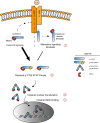
Fig. 7. Model of the mode-of-action of MS3-6.
The cumulative influences (labeled 1–4) of MS3-6 binding on inhibition of STAT3 transcriptional activity is schematically illustrated based on the presented results. MS3-6 decreases STAT3 Y705 phosphorylation levels by impairing the binding of STAT3 to the IL-22R cytosolic tail, thus specifically blocking the alternative IL-22R/STAT3 signaling axis (1) and (2). Additionally, MS3-6 leads to the reduction of STAT3 translocation in the nucleus upon cytokine stimulation (3) and decreases STAT3 binding to DNA (4). Legend: U-STAT3: unphosphorylated STAT3.

Similar articles

Cited by

References

    1. Loh C-Y, et al. Signal Transducer and Activator of Transcription (STATs) proteins in cancer and inflammation: functions and therapeutic implication. Front. Oncol. 2019;9:48. - PMC - PubMed
    1. Schindler C, Levy DE, Decker T. JAK-STAT signaling: from interferons to cytokines. J. Biol. Chem. 2007;282:20059–20063. - PubMed
    1. Johnson D, O’Keefe R, Grandis J. Targeting the IL-6/JAK/STAT3 signalling axis in cancer. Nat. Rev. Clin. Oncol. 2018;15:234–248. - PMC - PubMed
    1. Haura EB, Turkson J, Jove R. Mechanisms of disease: insights into the emerging role of signal transducers and activators of transcription in cancer. Nat. Clin. Pract. Oncol. 2005;2:315–324. - PubMed
    1. Reich NC. STATs get their move on. JAKSTAT. 2013;2:e27080. - PMC - PubMed

Publication types