. 2020 Aug 17;11(1):4120.
doi: 10.1038/s41467-020-17916-9.

Widespread protein lysine acetylation in gut microbiome and its alterations in patients with Crohn's disease

Affiliations

Widespread protein lysine acetylation in gut microbiome and its alterations in patients with Crohn's disease

Xu Zhang et al. Nat Commun. .

Abstract

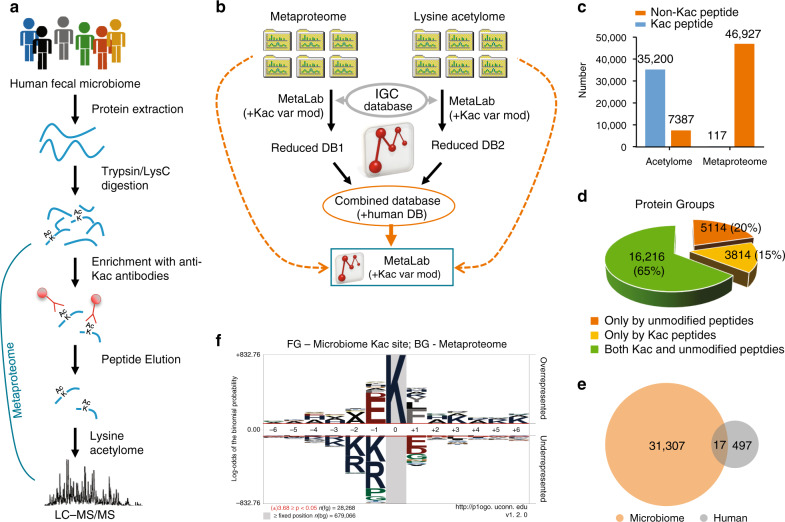
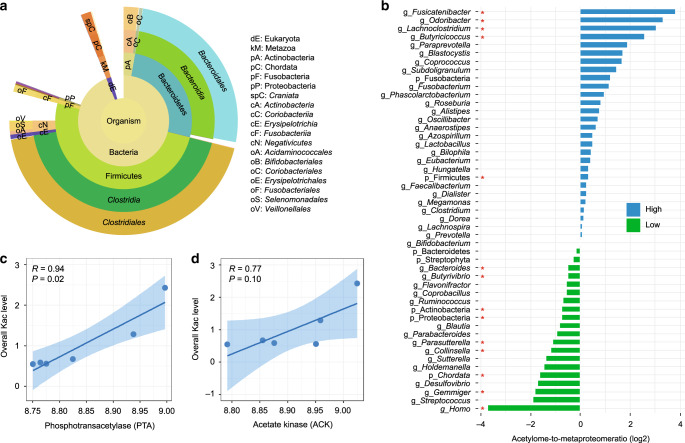
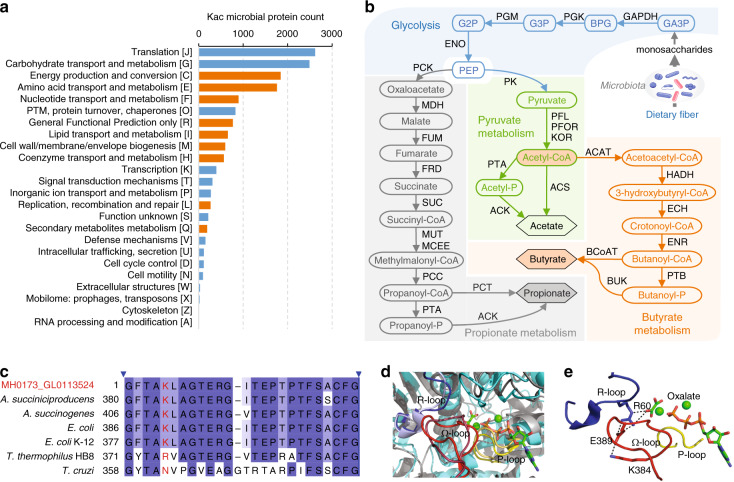
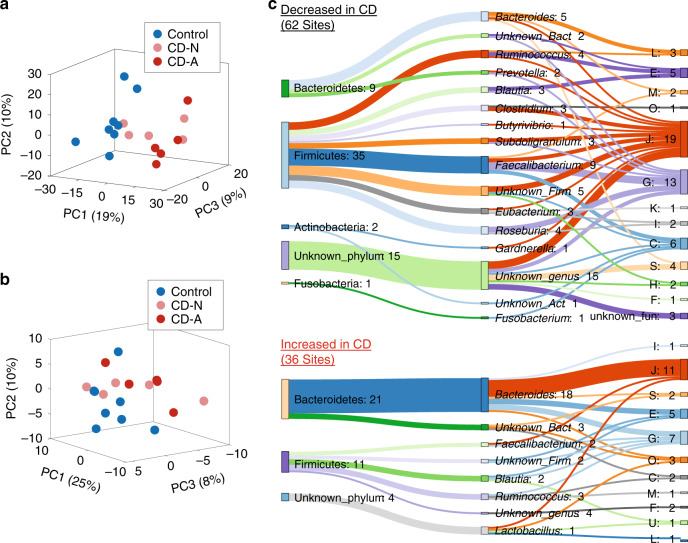
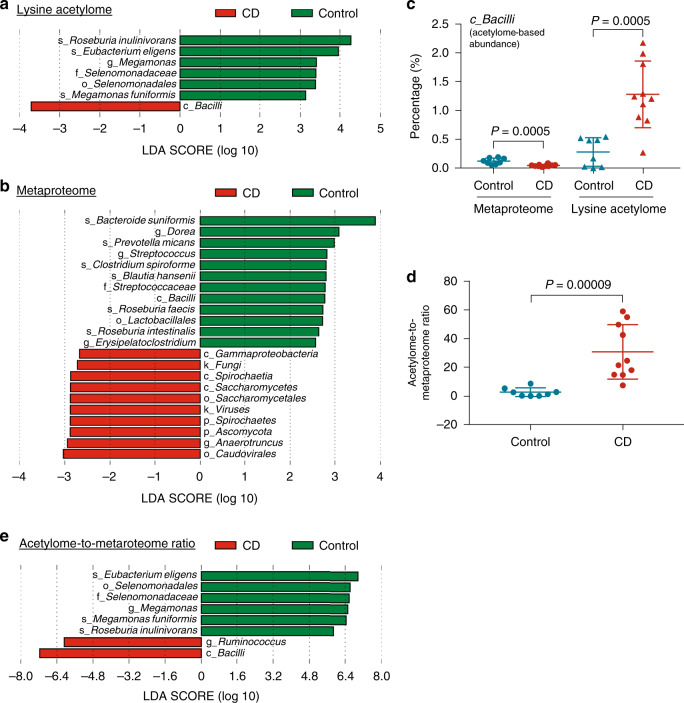
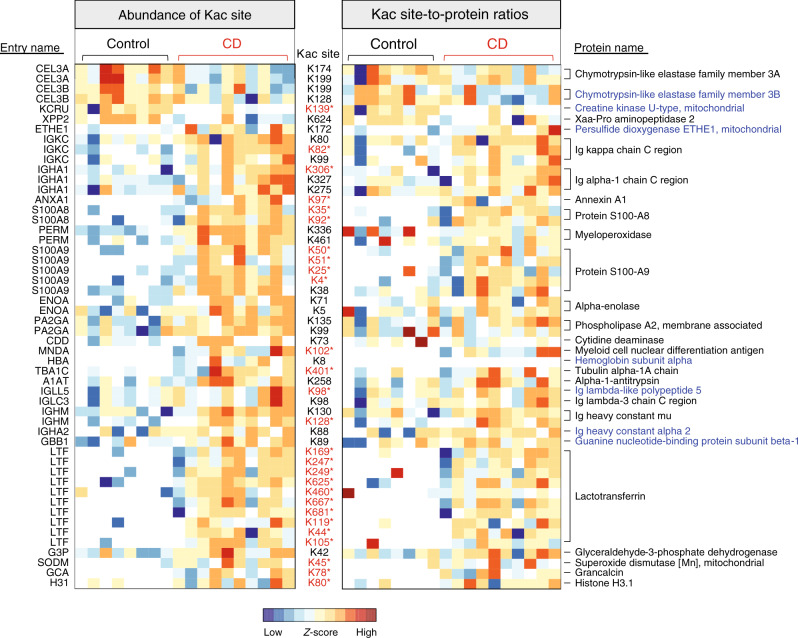
Lysine acetylation (Kac), an abundant post-translational modification (PTM) in prokaryotes, regulates various microbial metabolic pathways. However, no studies have examined protein Kac at the microbiome level, and it remains unknown whether Kac level is altered in patient microbiomes. Herein, we use a peptide immuno-affinity enrichment strategy coupled with mass spectrometry to characterize protein Kac in the microbiome, which successfully identifies 35,200 Kac peptides from microbial or human proteins in gut microbiome samples. We demonstrate that Kac is widely distributed in gut microbial metabolic pathways, including anaerobic fermentation to generate short-chain fatty acids. Applying to the analyses of microbiomes of patients with Crohn's disease identifies 52 host and 136 microbial protein Kac sites that are differentially abundant in disease versus controls. This microbiome-wide acetylomic approach aids in advancing functional microbiome research.


Conflict of interest statement

D.F., A.S., and D.M. have co-founded MedBiome, a clinical microbiomics company. C.F. and M.S. are employees of Cell Signaling Technology. The remaining authors declare no competing interests.

Figures

Fig. 1
Fig. 1. Experimental and bioinformatic workflows.
a Experimental workflow. b Integrated metaproteomics/acetylomics data-processing workflow. c Total number of identified Kac and non-Kac peptides in metaproteomic and lysine acetylomic aliquots, respectively. d Identified protein groups with non-Kac peptide and Kac peptide sequences in the whole data set (both lysine acetylomic and metaproteomic aliquots). e Venn diagram shows the overlap of identified human and microbial protein Kac sites. f pLogo of all identified microbiome Kac sites. The n(fg) and n(bg) values indicate the number of foreground and background sequences, respectively. The red horizontal bars on the pLogo correspond to a threshold of P < 0.05. Statistical significance of motif residues at given positions was assessed using binomial probability test. Source data are provided as a Source Data file.
Fig. 2
Fig. 2. Taxon-specific lysine acetylation in human gut microbiome.
a Sunburst plot of microbial taxa that were assigned using all identified Kac peptides. Sunburst plot is generated using Unipept (https://unipept.ugent.be/). b Lysine acetylome-to-metaproteome ratios of quantified phyla and genera in human gut microbiome. The ratios were log2-transformed for plotting. High indicates higher lysine acetylation levels, and low indicates lower lysine acetylation levels. Red star indicates statistically significance (P < 0.05, paired, two-sided Wilcoxon signed-rank test) when comparing the percentage in lysine acetylomic aliquot with that in metaproteomic aliquot. c, d Correlations of overall Kac peptide abundances with the relative abundances of protein phosphotransacetylase (c) and acetate kinase (d) in metaproteome. Mean and 95% confidence interval of the correlation coefficient are shown as line and error band, respectively. Spearman’s correlation R and P values are indicated. Source data are provided as a Source Data file.
Fig. 3
Fig. 3. Functional characterization of identified Kac proteins.
a COG category distribution of microbial Kac proteins. Significantly enriched categories are highlighted in orange. Significance was determined with a hypergeometric test using the unmodified microbial proteins identified in the metaproteomic samples as background. Source data are provided as a Source Data file. b SCFA-producing metabolic pathways constructed using the identified Kac proteins. Identified Kac enzymes and metabolites are indicated using abbreviations as follows: GA3P glyceraldehyde-3-phosphate, BPG 1,3-bisphospho-glycerate, G3P glycerate 3-phosphate, G2P glycerate 2-phosphate, GAPDH glyceraldehyde-3-phosphate dehydrogenase, PGK phosphoglycerate kinase, PGM phosphoglycerate mutase, ENO enolase, MDH malate dehydrogenase, FUM fumarate hydratase, FRD fumarate reductase, SUC succinyl-CoA synthetase, MUT methylmalonyl-CoA mutase, MCEE methylmalonyl-CoA epimerase, PCC propionyl-CoA carboxylase, PCT propionate CoA transferase, PK pyruvate kinase, PFL pyruvate formate-lyase, KOR 2-oxoglutarate/2-oxoacid ferredoxin oxidoreductase, HADH 3-hydroxyacyl-CoA dehydrogenase, ECH enoyl-CoA hydratase, ENR enoyl-[acyl-carrier protein] reductase, PTB phosphate butyryltransferase, BUK butyrate kinase, BCoAT butyryl CoA:acetate CoA transferase. c Sequence alignment of identified acetylated PCK (MH0173_GL0113524, Kac peptide GFTAKacLAGTER) with known PCKs in PDB database. Taxonomic origin and starting amino acid position are indicated in the left side. The consensus sequence is colored in blue gradient according to the percentage identity. A. succinogenes Actinobacillus succinogenes, E. coli Escherichia coli, T. thermophiles Thermus thermophiles, T. cruzi Trypanosoma cruzi. d GTP-dependent and ATP-dependent PCKs share the same catalytic structural elements. The structure of the catalytic pocket of the GTP-dependant rat PCK (colored in gray, PBD 3DT4) is superposed with A. succiniciproducens ATP-dependant PCK (colored in Cyan, PBD 1YTM). Three catalytic elements: R loop, P loop, and Ω-loop are highlighted with light blue, light red, and light yellow, respectively, in rat PCK, and with bright blue, bright red, and bright yellow, respectively, in A. succiniciproducens PCK. The oxalate and ATP are indicated as sticks and colored by atom type. The Mg and Mn metals are indicated as green spheres. e Interaction among K384, E389, R60, and oxalate in A. succiniciproducens PCK. Protein structure was generated with PyMOL (https://pymol.org/).
Fig. 4
Fig. 4. Lysine acetylome alterations of the intestinal microbiome in pediatric CD.
a PCA score plot of the metaproteome of the intestinal microbiome. b PCA score plot of the lysine acetylome of the intestinal microbiome. c Differentially abundant microbial Kac sites. The COG category and taxonomy (phylum and genus) for the differentially abundant Kac sites are shown in the Sankey plot. The numbers after the colons indicate the numbers of differentially abundant Kac sites. The phylum-genus links and genus-function (COG category) links are shown. Each letter corresponds to a COG category as shown in Fig. 3. The Sankey plot was generated using SankeyMATIC (http://sankeymatic.com/). Source data are provided as a Source Data file.
Fig. 5
Fig. 5. Taxonomic alterations of protein acetylation in the pediatric CD microbiome.
a LEfSe analysis of lysine acetylome-based taxonomic compositions. b LEfSe analysis of metaproteome-based taxonomic compositions. c Percentage of Bacilli in metaproteome and lysine acetylome data sets. Control, n = 8 biologically independent samples; CD, n = 10 biologically independent samples. Statistical significance of the difference between groups was evaluated using two-sided Mann–Whitney U test. d Acetylome-to-metaproteome ratios of Bacilli in pediatric CD and control subjects. Control, n = 8 biologically independent samples; CD, n = 10 biologically independent samples. Statistical significance of the difference between groups was evaluated using two-sided Mann–Whitney U test. e LEfSe analysis of the acetylome-to-metaproteome ratios of all quantified taxa in the lysine acetylome data set. For scatter dot plot, mean (long line) and standard deviation (short line) are indicated. Source data are provided as a Source Data file.
Fig. 6
Fig. 6. Abundance alterations of human protein Kac sites in CD microbiome samples.
A heatmap of differentially abundant human protein Kac sites is shown on the left, and a Kac site-to-protein ratio heatmap is shown on the right. Each row of the heatmap is a protein Kac site (indicated in between the two panels). The UniProt protein entry name and protein name for each Kac site are indicated on the left side and right side, respectively. The Kac sites highlighted in red stars retained the differences in their site-to-protein ratios. Protein names highlighted in blue indicate the proteins with no significant difference between CD and control in unenriched samples. The heatmap was generated using iMetaLab (http://imetalab.ca/). Source data are provided as a Source Data file.

Similar articles

Cited by

References

    1. O’Hara AM, Shanahan F. The gut flora as a forgotten organ. EMBO Rep. 2006;7:688–693. - PMC - PubMed
    1. Clemente JC, Ursell LK, Parfrey LW, Knight R. The impact of the gut microbiota on human health: an integrative view. Cell. 2012;148:1258–1270. - PMC - PubMed
    1. Zhang X, et al. Metaproteomics reveals associations between microbiome and intestinal extracellular vesicle proteins in pediatric inflammatory bowel disease. Nat. Commun. 2018;9:2873. - PMC - PubMed
    1. Gevers D, et al. The treatment-naive microbiome in new-onset Crohn’s disease. Cell Host Microbe. 2014;15:382–392. - PMC - PubMed
    1. Lewis JD, et al. Inflammation, antibiotics, and diet as environmental stressors of the gut microbiome in pediatric Crohn’s disease. Cell Host Microbe. 2015;18:489–500. - PMC - PubMed

Publication types