. 2020 Oct;26(10):1583-1592.
doi: 10.1038/s41591-020-1013-2. Epub 2020 Aug 17.

Articular cartilage regeneration by activated skeletal stem cells

Affiliations

Articular cartilage regeneration by activated skeletal stem cells

Matthew P Murphy et al. Nat Med. 2020 Oct.

Abstract

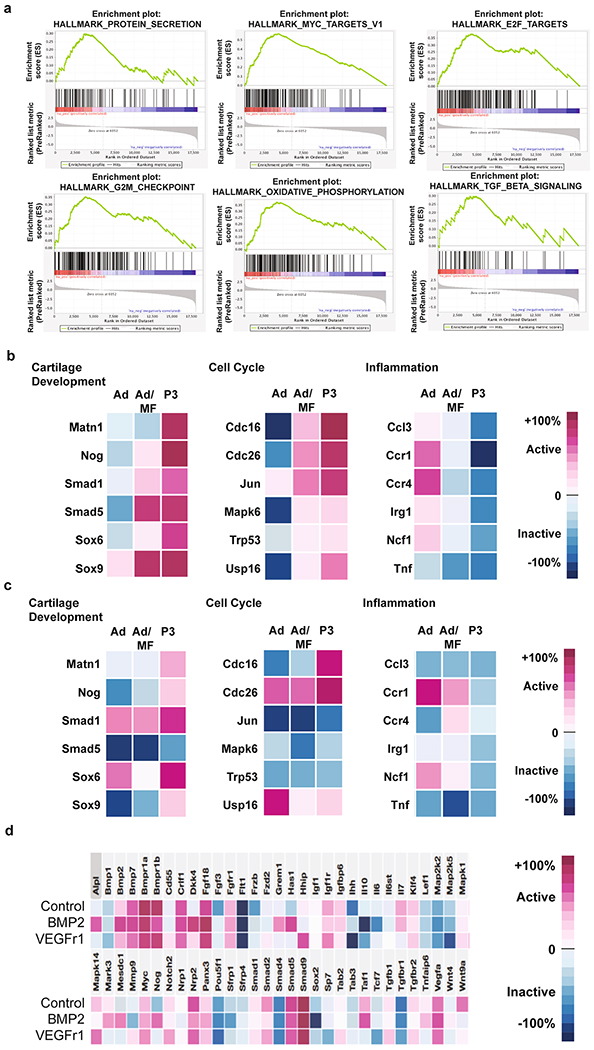
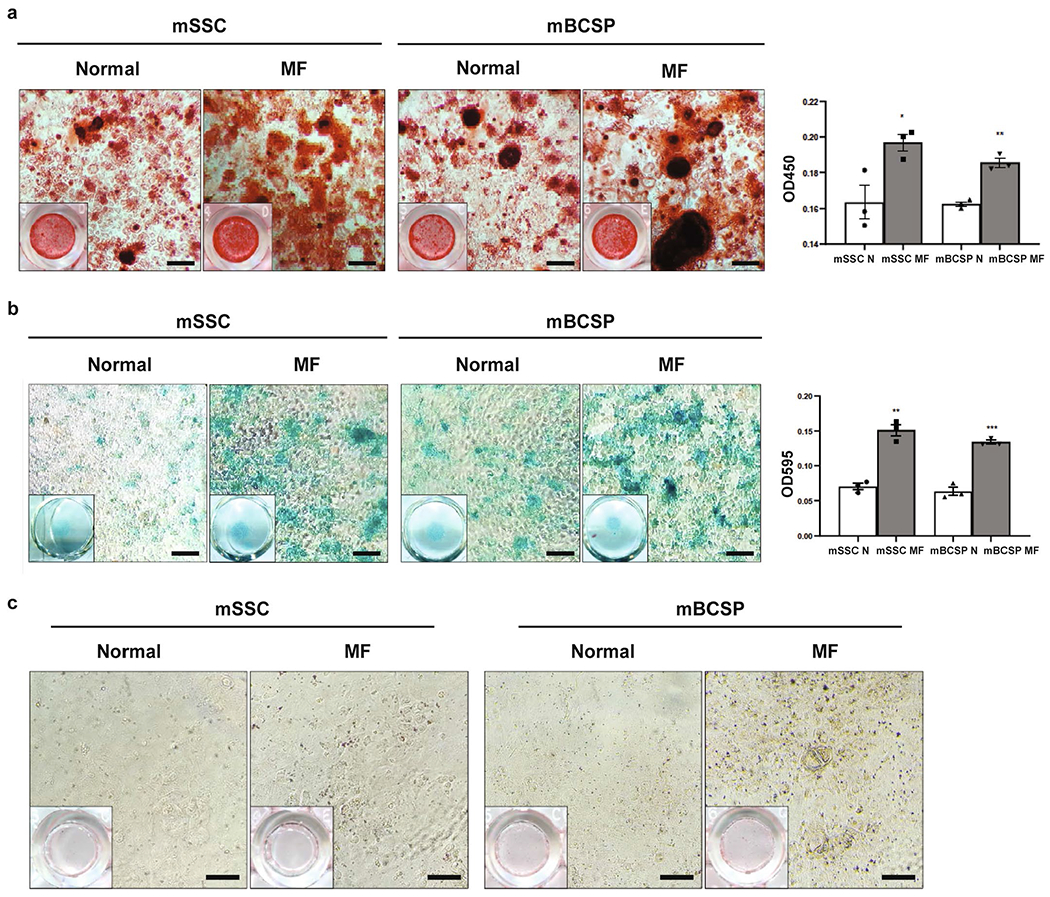
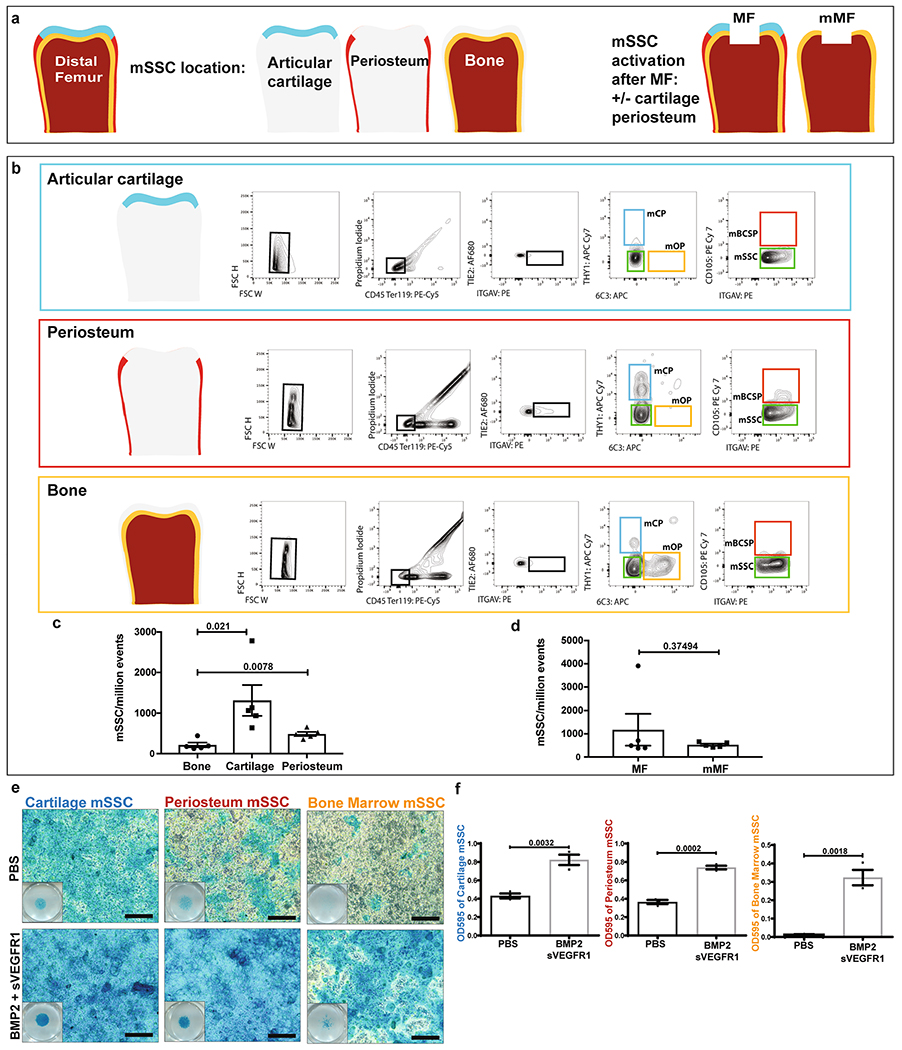
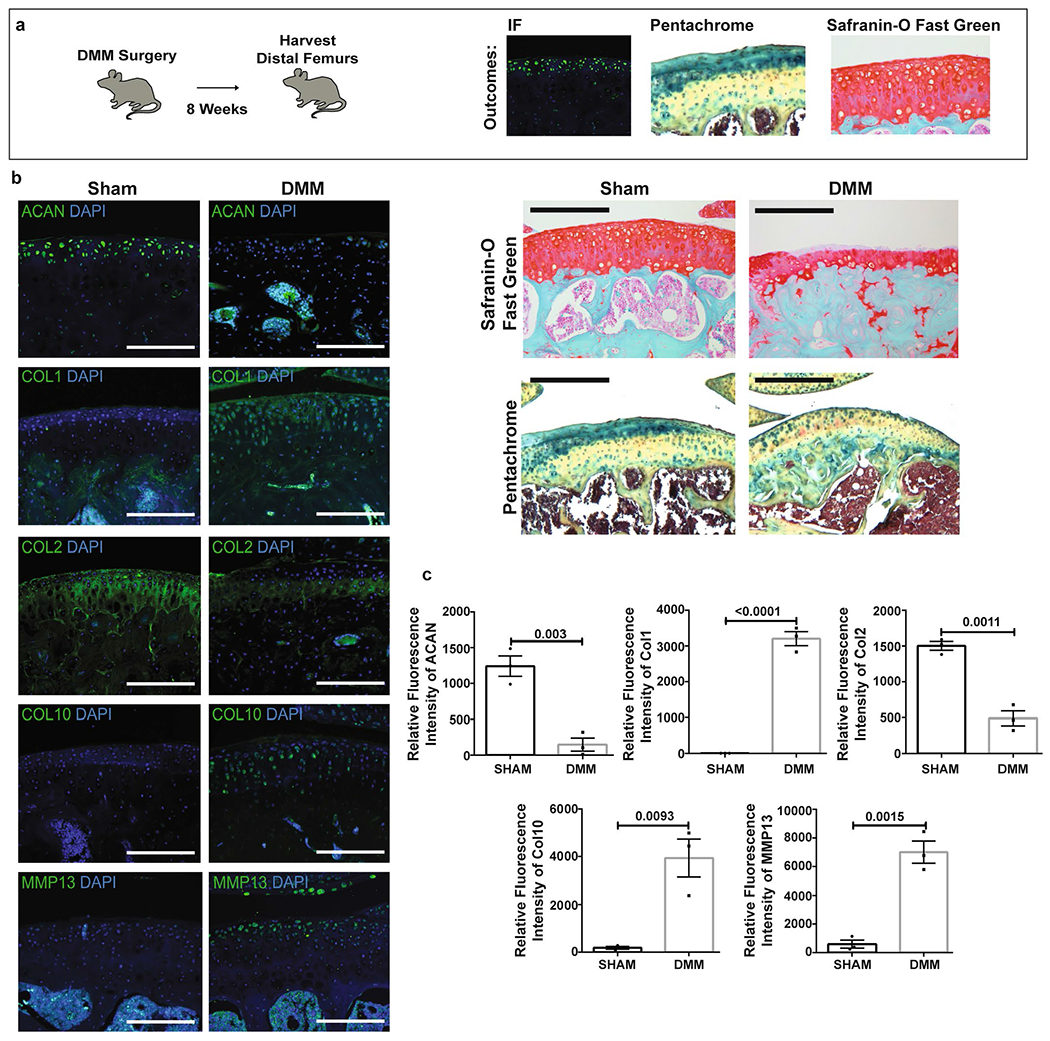
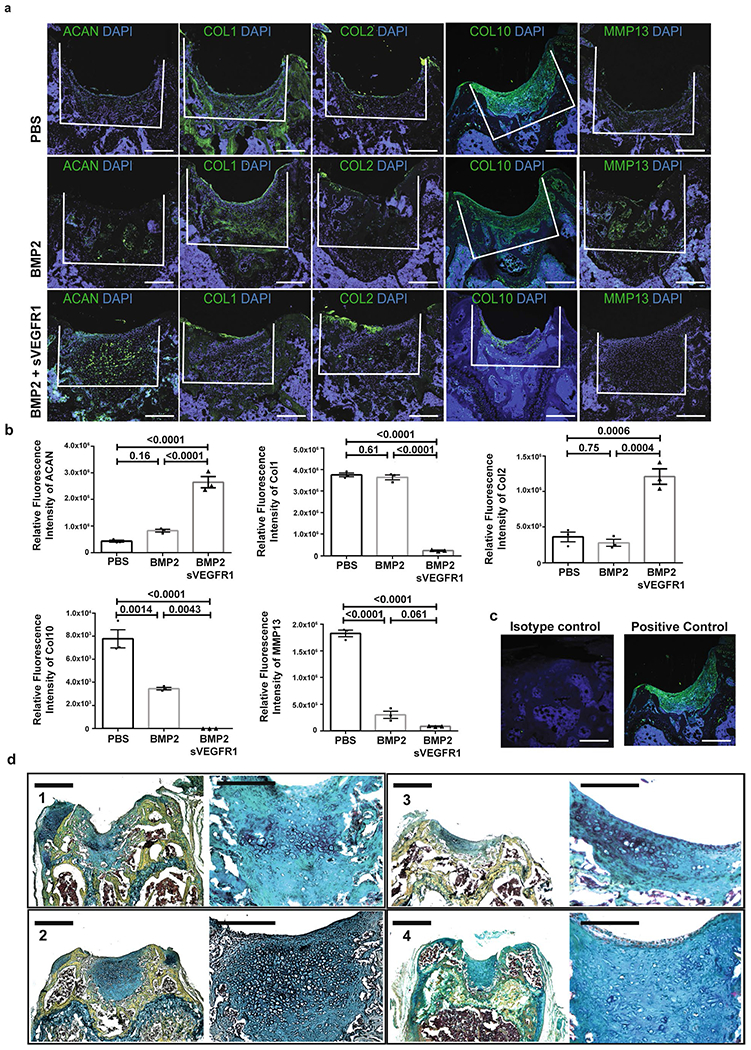
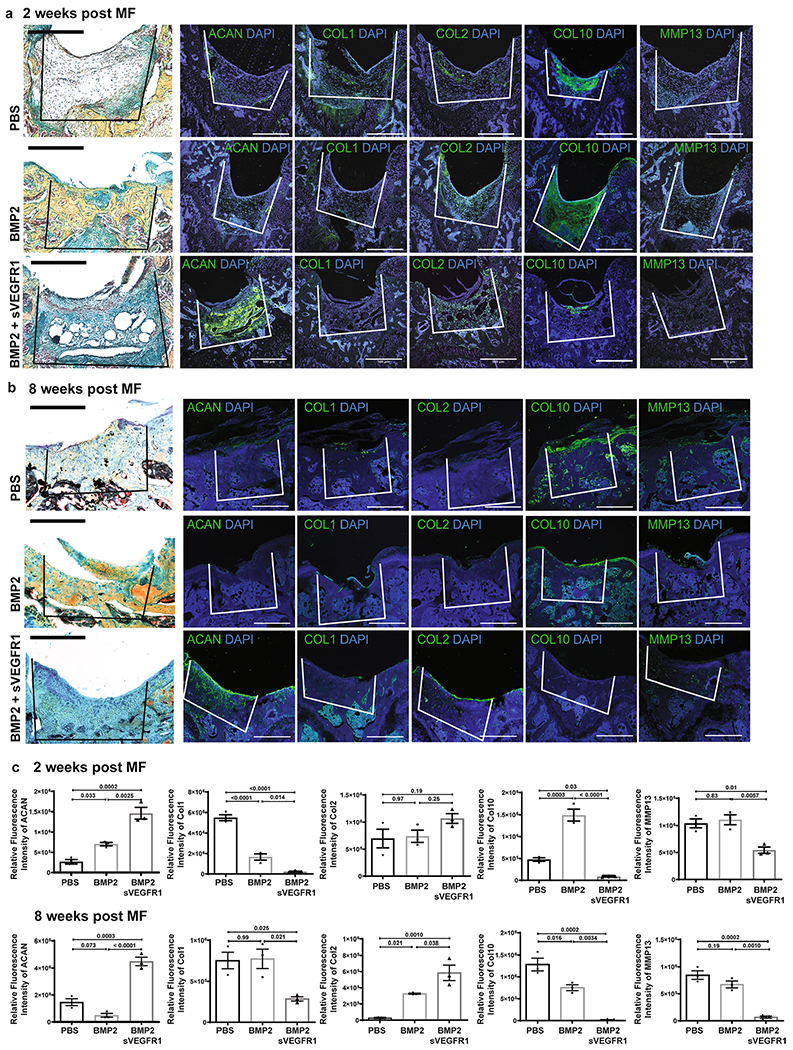
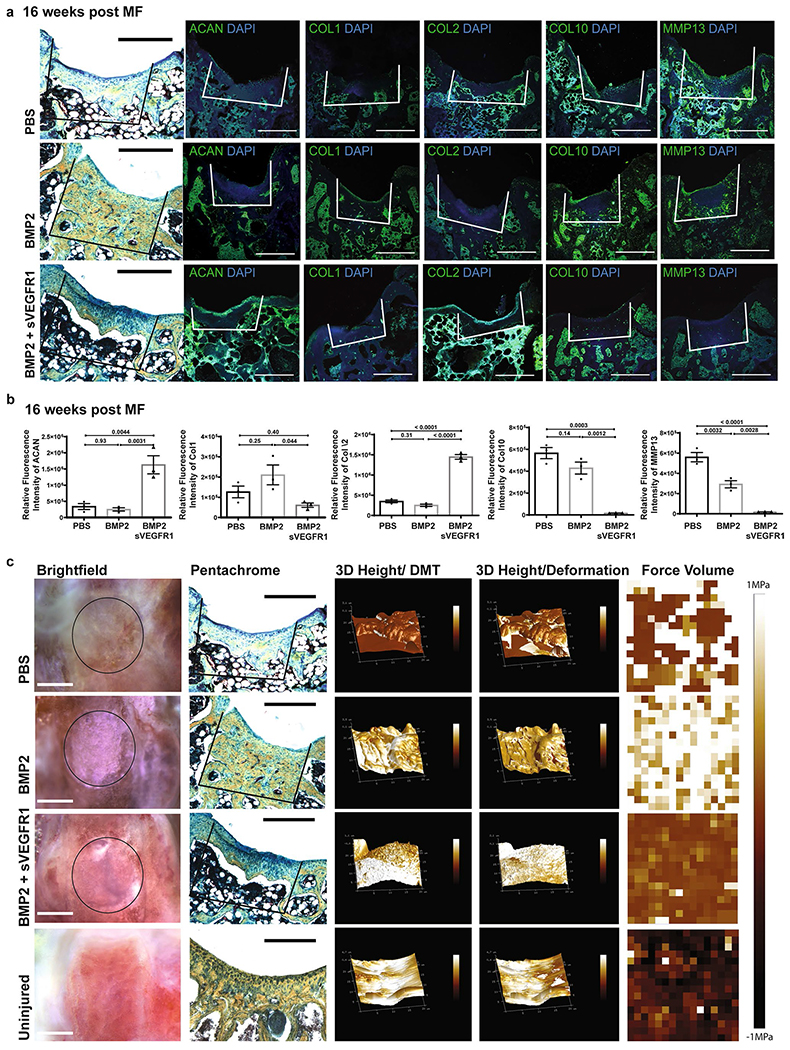
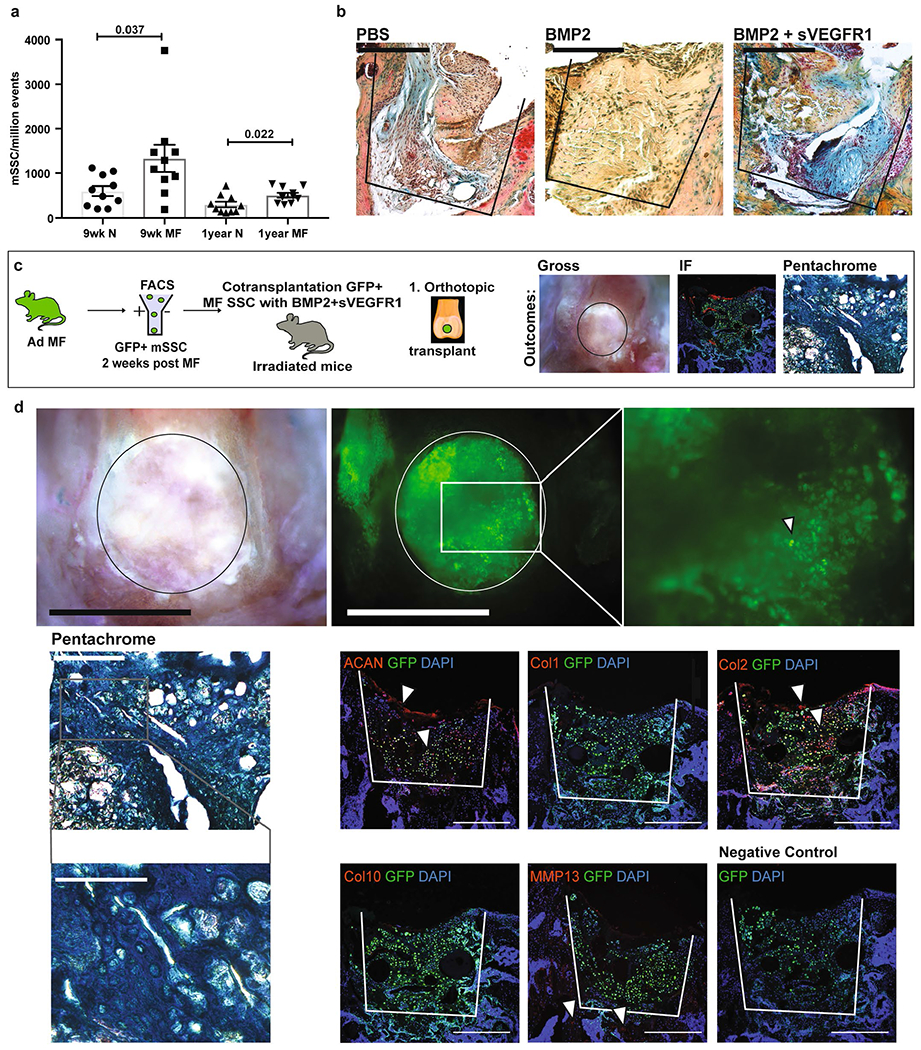
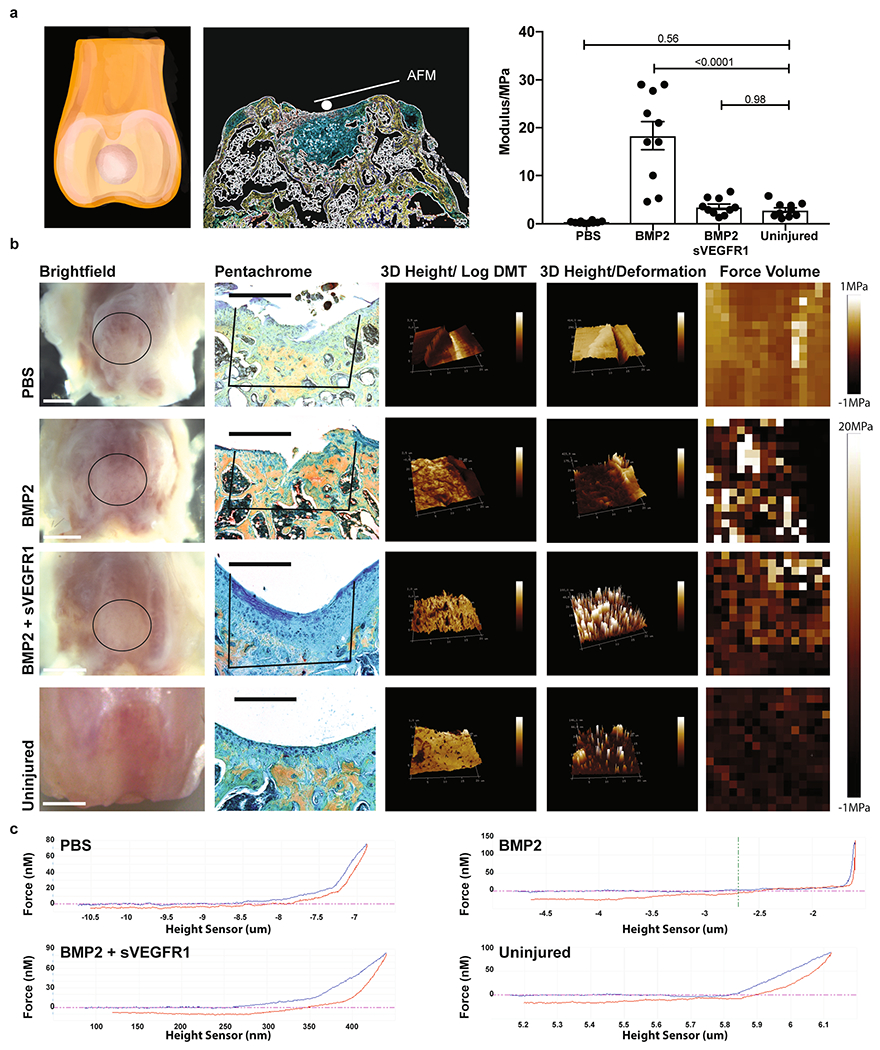
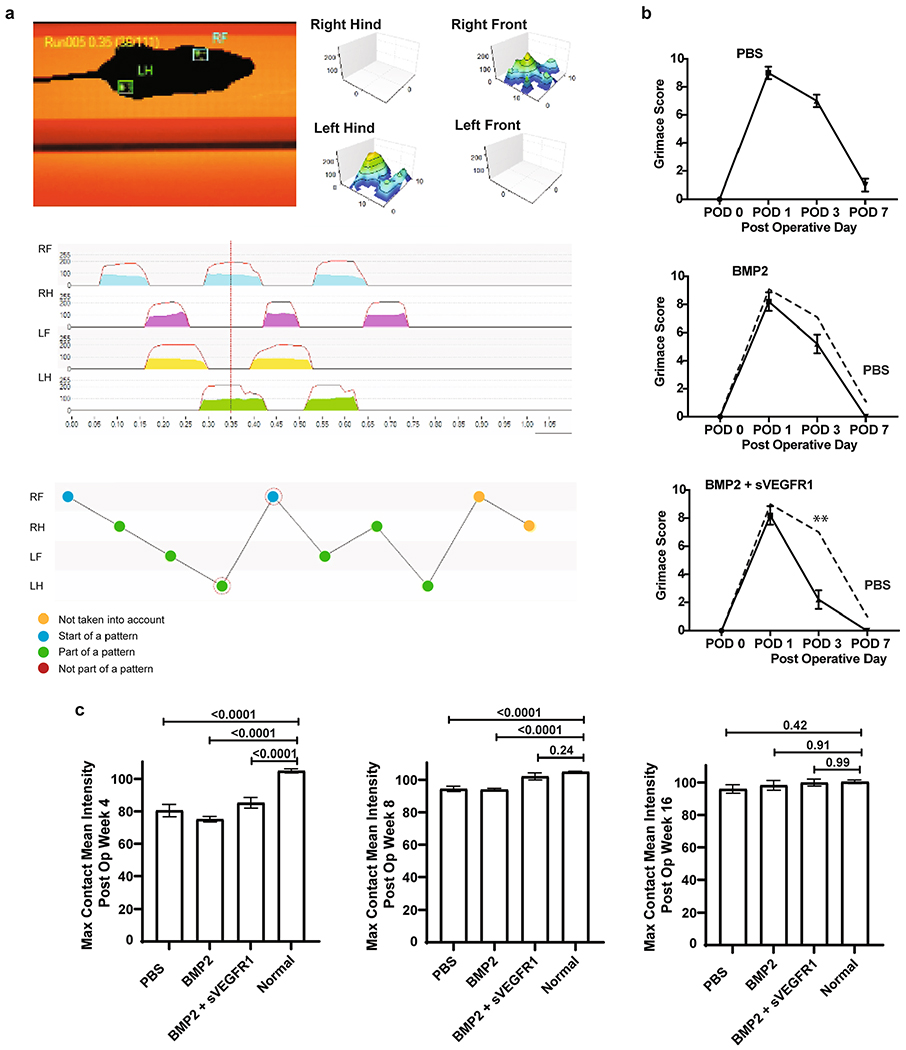
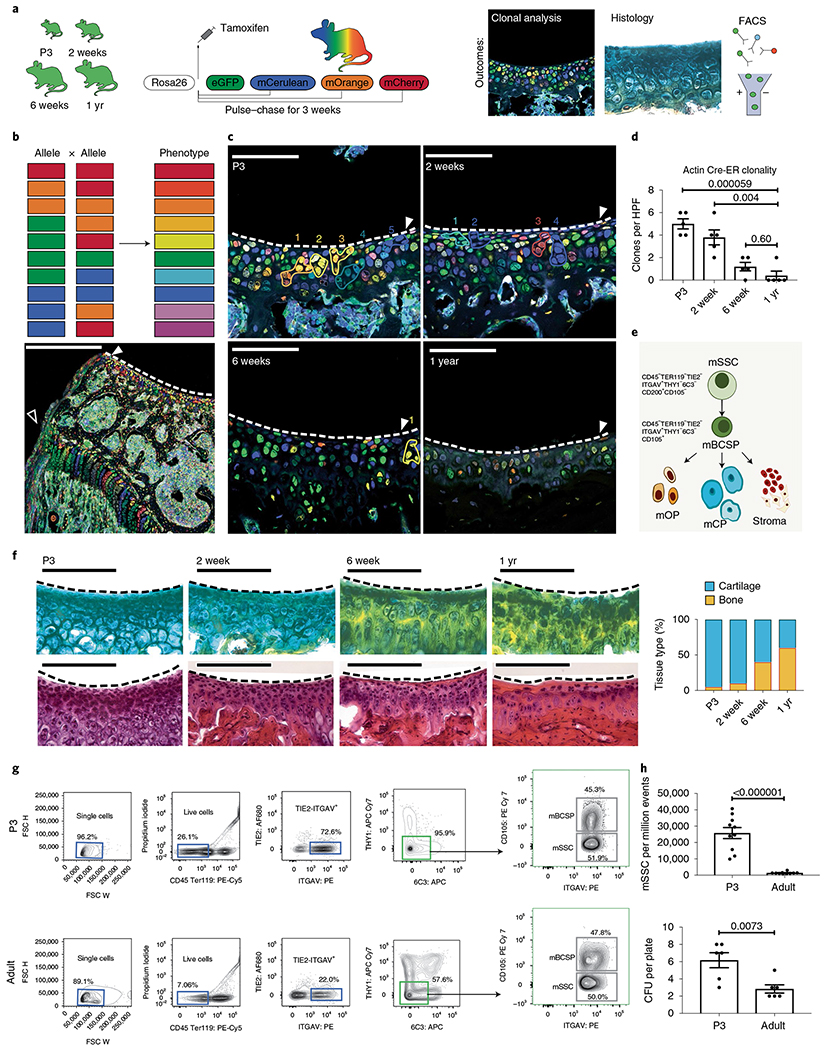
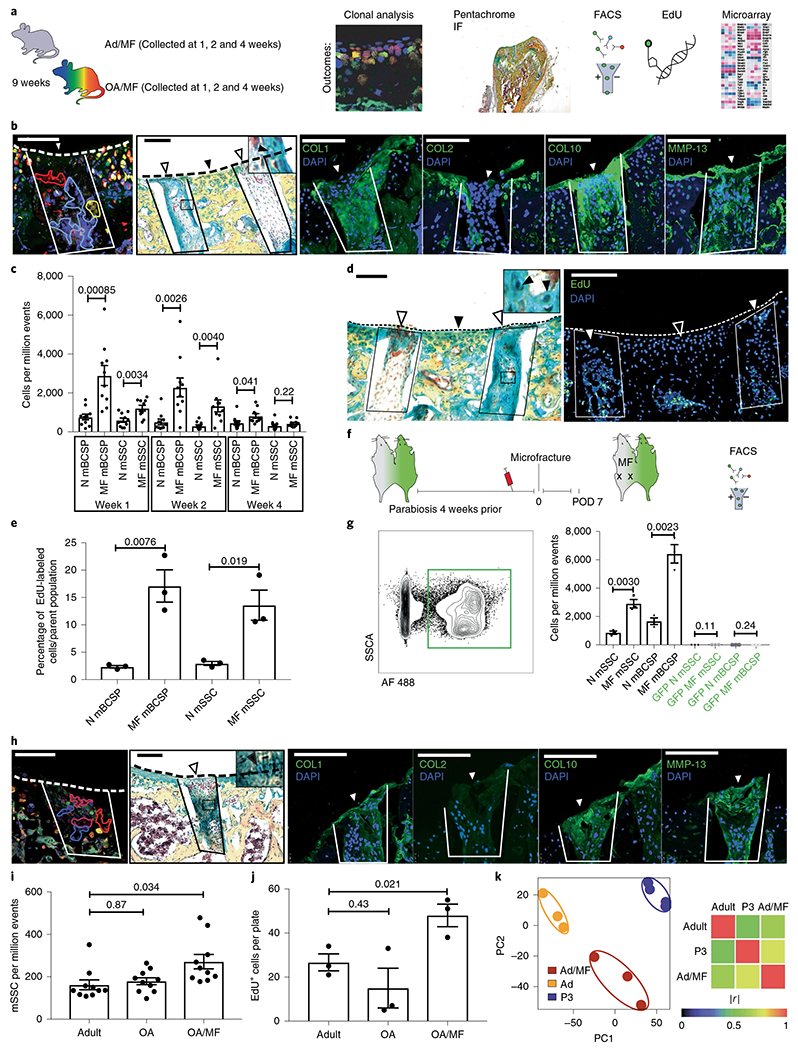
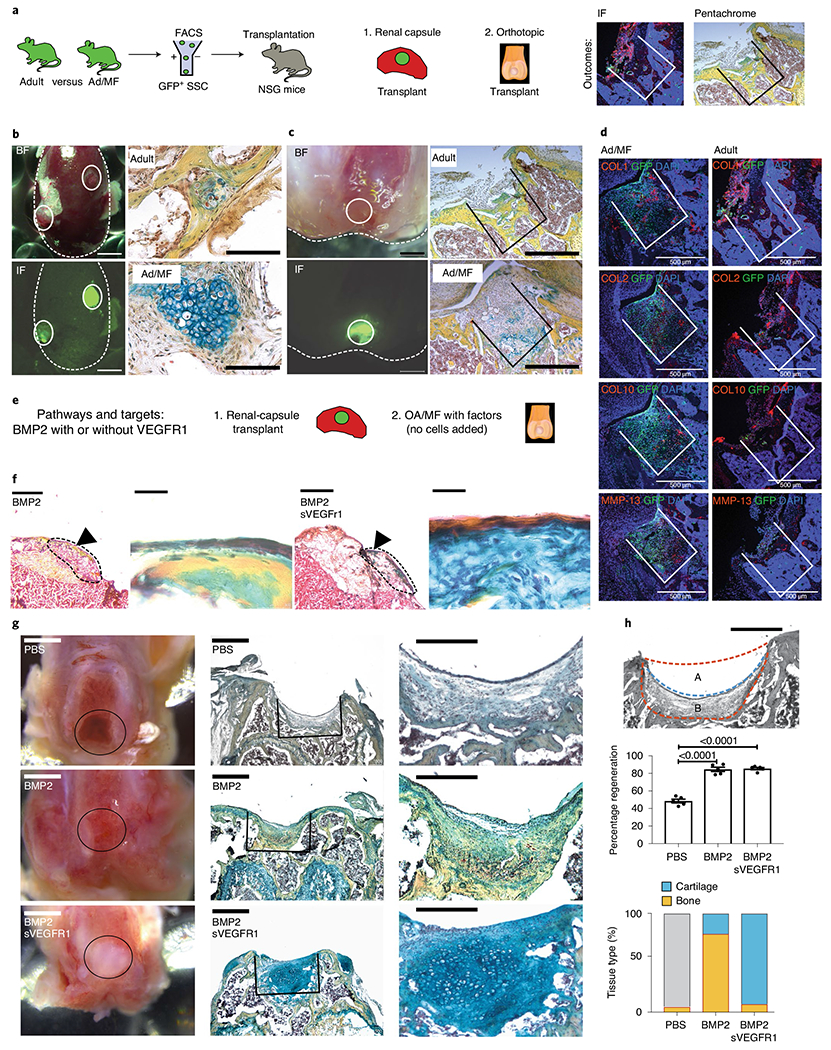
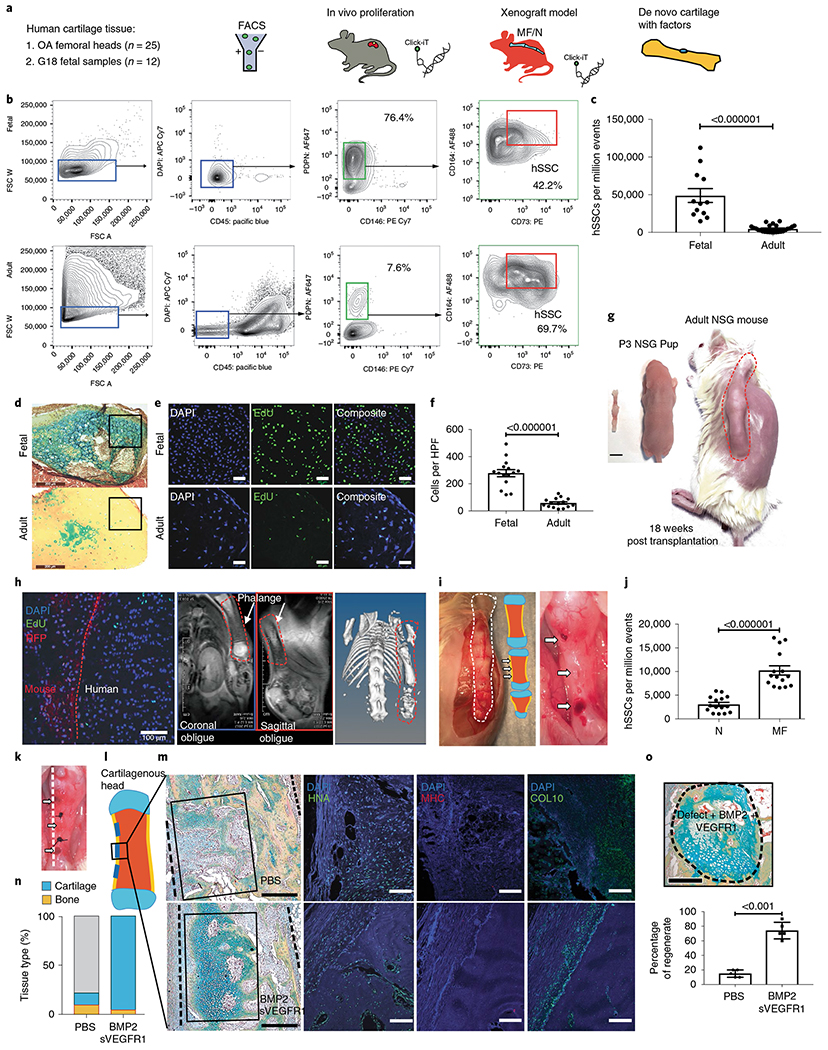
Osteoarthritis (OA) is a degenerative disease resulting in irreversible, progressive destruction of articular cartilage1. The etiology of OA is complex and involves a variety of factors, including genetic predisposition, acute injury and chronic inflammation2-4. Here we investigate the ability of resident skeletal stem-cell (SSC) populations to regenerate cartilage in relation to age, a possible contributor to the development of osteoarthritis5-7. We demonstrate that aging is associated with progressive loss of SSCs and diminished chondrogenesis in the joints of both mice and humans. However, a local expansion of SSCs could still be triggered in the chondral surface of adult limb joints in mice by stimulating a regenerative response using microfracture (MF) surgery. Although MF-activated SSCs tended to form fibrous tissues, localized co-delivery of BMP2 and soluble VEGFR1 (sVEGFR1), a VEGF receptor antagonist, in a hydrogel skewed differentiation of MF-activated SSCs toward articular cartilage. These data indicate that following MF, a resident stem-cell population can be induced to generate cartilage for treatment of localized chondral disease in OA.


Conflict of interest statement

Competing interests

The authors declare no competing interests.

Figures

Extended Data Fig. 1 |
Extended Data Fig. 1 |. Mouse microarray data analysis.
a, Pathways significantly enriched in Ad/MF and P3 mSSC populations. Top, (from left-right) Protein secretion, MYC targets, E2F targets. Bottom, (from left-right) G2M checkpoint, oxidative phosphorylation and TGFb signaling. b-c, mSSC expression (b) and bulk tissue expression (c) of key genes involved in cartilage development, cell cycle and inflammation. d, mSSC gene expression levels after in vitro treatment of PBS, BMP2, or sVEGFR1.
Extended Data Fig. 2 |
Extended Data Fig. 2 |. In vitro assays for groups (N, MF).
a, Alizarin red staining of uninjured/normal adult (N) and adult MF mSSCs (left) and mBCSPs (right), and quantification of the alizarin red stain after extraction and photometric measurement at OD450. (n = 3 mice per group). * 0.032; ** 0.0014. b, Alcian blue staining of N and MF mSSCs (left) and mBCSPs (right), and quantification of the Alcian blue stain after extraction and photometric measurement at OD595. (n = 3 mice per group). ** 0.0010; *** 0.0004. c, Oil red O staining of Ad and Ad/MF mSSCs (Left) and mBCSPs (Right). Scale bar 100μm. (n = 3 mice per group). Graphs show mean+/− s.e.m. Two-tailed Student’s t-test. Exact P values to 2 significant figures.
Extended Data Fig. 3 |
Extended Data Fig. 3 |. Microdissection before and after MF surgery.
a, Schematic depicting the distal femur of a mouse and its major tissue layers before and after MF surgery. b, Representative flow cytometry analysis of the articular surface (top), the periosteum (middle), and bone (bottom) with relative populations of mOP, mCP, mBCSP, and mSSC. c, Quantification of mSSC/million events in bone, cartilage, and periosteum. Graph shows mean +/− s.e.m. Ordinary one-way ANOVA test with post-hoc analysis using Šídák method to compare between specific means. Exact P values to 2 significant figures. (n = 5 mice per group). d, Quantification of mSSC/million events comparing MF joints and joints with articular cartilage and periosteum removed prior to MF surgery (mMF). (n = 5 mice per group). e, Alcian blue staining of mSSC following chondrogenic differentiation with treatment of PBS or BMP2 + sVEGFR1. Scale bars 100μm. Representative of three independent experiments. f, Quantification of the Alcian blue stain after extraction and photometric measurement at OD595. Unless otherwise stated, graphs show mean +/− s.e.m. Two-tailed Student’s t-test. Exact P values to 2 significant figures.
Extended Data Fig. 4 |
Extended Data Fig. 4 |. OA progression.
a, Schematic of the experimental outline. Destabilization of the medial meniscus (DMM) was performed on adult mice, and the distal femurs were harvested after 8 weeks. Analysis was performed by IF, pentachrome, and Safranin-O Fast Green staining. b, Left, representative IF of indicated markers in sham and DMM joints. Scale bars 100μm. Right, Safranin-O Fast Green and pentachrome stains of sham and joints 8 weeks after DMM. Scale bars 500μm. (n = 3 per group). c, Quantification of IF stains in sham versus DMM. Graphs show mean+/− s.e.m. Two-tailed Student’s t-test. Exact P values to 2 significant figures. (n = 3 per group).
Extended Data Fig. 5 |
Extended Data Fig. 5 |. IHC and quantification of OA/MF with factors at 4 weeks.
a, Representative IF of (from left-right) ACAN, COL 1, COL 2, COL 10 and MMP 13 in 3 treatment conditions (top: PBS, middle: BMP2, bottom: BMP2 + sVEGFR1) at 4 weeks after MF. Scale bars 250μm. (n = 8 per group). b, Quantification of IF stains for indicated markers of MF + factors at 4 weeks. Graphs show mean +/− s.e.m. Ordinary one-way ANOVA test with post-hoc analysis using Šídák method to compare between specific means. Exact P values to 2 significant figures. c, Representative IF isotype and positive controls. (n = 3 per group). d, Repeat examples of pentachrome staining of BMP2 + sVEGFR1 sections at low (scale bars 500μm) and high (scale bars 100μm) magnification. Representatives of eight independent experiments.
Extended Data Figure 6 |
Extended Data Figure 6 |. Histology of OA/MF at 2 weeks and 8 weeks.
a, Representative pentachrome stains and respective IF of (from left-right) ACAN, COL 1, COL 2, COL 10 and MMP 13 in 3 treatment conditions (top: PBS; middle: BMP2; bottom: BMP2 + sVEGFR1) at 2 weeks after MF. Scale bars 500μm. (n = 4 per group). b, Representative pentachrome stains and respective IF stains for the indicated markers in 3 treatment conditions (top row: PBS; middle: BMP2; bottom: BMP2 + sVEGFR1) at 8 weeks after MF. Scale bars 500μm. (n = 4 per group). c, Quantification of IF stains for the indicated markers at 2 weeks (top) and 8 weeks (bottom) after MF. (n = 3 per group per timepoint). Graphs show mean +/− s.e.m. Ordinary one-way ANOVA test with post-hoc analysis using Šídák method to compare between specific means. Exact P values to 2 significant figures.
Extended Data Fig. 7 |
Extended Data Fig. 7 |. Week 16 timepoint.
a, Representative pentachrome and respective IF of (from left-right) ACAN, COL 1, COL 2, COL 10 and MMP 13 in 3 treatment conditions (top: PBS, middle: BMP2, bottom: BMP2 + sVEGFR1). Scale bars 500μm. (n = 4 per group). b, Quantification of IF stains for indicated markers of MF + factors. Graphs show Mean +/− SEM. Ordinary one-way ANOVA test with post-hoc analysis using Šídák method to compare between specific means. Exact P values to 2 significant figures. (n = 3 per group). c, From left-right, gross images of distal femur (scale bars 1 mm); respective pentachrome (scale bars 500μm); 3D Peak Force Error; 3D Deformation; Force Volume in 4 conditions (PBS, BMP2, BMP2 + sVEGFR1, Uninjured). (n = 4 per group).
Extended Data Fig. 8 |
Extended Data Fig. 8 |. Effects of aged and irradiated niches.
a, Quantification of mSSC/million events in normal and MF joints of adult (9wks) and aged (1 yr) mice. Graph shows mean +/− s.e.m. Two-tailed Student’s t-test. Exact P values to 2 significant figures. (n = 10 mice per group). b, Representative pentachrome stains of 2-weeks post MF surgery in aged joints with (from left-right) PBS, BMP2, and BMP2 + sVEGFR1. Scale bar 500μm. (n = 3 per group). c, Schematic of the experimental outline. Microfracture surgery is performed on the joints of GFP + adult mice (Ad/MF). GFP + mSSCs are sorted by flow cytometry and cotransplanted with BMP2 + sVEGFR1 into MF defects of irradiated mice. Analysis is performed by brightfield microscopy (BF), immunofluorescence (IF), and pentachrome staining. d, Top, Representative BF (left) and fluorescence microscopy (right) of GFP + Ad/MF mSSC 4 weeks after they were transplanted into the MF defect of an irradiated joint. Scale bars 500μm. (n = 5 mice). Middle, Representative pentachrome stain (scale bar 500μm) shown with higher magnification (scale bar 100μm) and respective IF of GFP + Ad/MF mSSC 4 weeks after they were transplanted into the MF defect of an irradiated joint. Positive staining marked by white arrows. Representatives of three separate experiments. Bottom right, a negative control IF stain was performed for each experiment. Scale bars 500μm.
Extended Data Fig. 9 |
Extended Data Fig. 9 |. Atomic Force Microscopy at 8 weeks post MF.
a, Left and middle, schematic of Rheology experimental outline. Right, Quantification for the modulus of the regenerate (PBS, BMP2, BMP2 + sVEGFR1.) Graph shows mean +/− s.e.m. Ordinary one-way ANOVA test (p = <0.0001) with post-hoc analysis using Šídák method to compare between specific means. Exact P values to 2 significant figures. (n = 10 mice per group). b, From left-right, gross images of distal femur (scale bars 1 mm); respective pentachrome (scale bars 500μm); 3D Peak Force Error; 3D Deformation; Force Volume in 4 conditions (PBS, BMP2, BMP2 + sVEGFR1, Uninjured) (n = 4 per group). Scale bar 500μm. c, Force graphs for PBS, BMP2, BMP2 + sVEGFR1, and uninjured. (n = 4 per group).
Extended Data Fig. 10 |
Extended Data Fig. 10 |. Functional assessment.
a, Schematic of the gait analysis performed on Ad/MF mice. b, Grimace assessment scores for adult mice following MF surgery of the distal femur with 3 treatment conditions (PBS, BMP2, BMP2 + sVEGFR1). Graphs show mean +/− s.e.m. Ordinary one-way ANOVA test (p = <0.0001) with post-hoc analysis using Šídák method to compare between specific means. Exact P values to 2 significant figures. (n = 5 mice per group). c, Gait assessment scores for maximum contact mean intensity with 4 conditions (PBS, BMP2, BMP2 + sVEGFR1, and Uninjured) at 4, 8, and 16 weeks after surgery. (n = 3 mice per group per timepoint).
Fig. 1 |
Fig. 1 |. Age-related changes in articular mSSC activity.
a, Schematic of the experimental outline. βactin-CreERT/Rainbow mice were injected with tamoxifen and analyzed after 3 weeks using fluorescence microscopy and histology, and C57BL/6 mice were analyzed using FACS. eGFP, enhanced GFP. b, Top, schematic of the ten potential colors that can be generated (phenotype) following recombination of alleles in the β actin-CreERT/Rainbow mouse model. Bottom, low magnification of the distal femur showing clonality at the growth plate (white outline arrowhead) and articular surface (white solid arrowhead) of a P3 pup. Scale bar, 500 μm. c, Representative confocal images of articular surfaces (white solid arrowhead and dotted white line) in mice at the indicated ages. Numbers refer to cell clones, outlined in their respective colors. Scale bar, 20μm. n = 5 mice per group. d, Quantitation of the number of clones per high-power field (HPF) at the indicated ages. Ordinary one-way analysis of variance (ANOVA) (P ≤ 0.0001) with post hoc analysis using the Sidak method to compare between specific means. n = 5 mice per group. e, Schematic of the mSSC hierarchy, which can be identified by the indicated cell surface markers. mSSCs differentiate into mBCSPs, which give rise to osteoprogenitors (mOP), chondroprogenitors (mCP) and stromal progenitors (stroma). f, Left, staining of articular cartilage with pentachrome (top) and H&E (bottom) in mice at the indicated ages. Scale bar 100 μm. Representative of three independent experiments. Right, quantitation of the composition of the articular surface in mice at the indicated ages (pentachrome: yellow, bone; blue, cartilage. H&E: purple, cartilage, pink, extracellular material). g, Representative flow cytometry analysis of mSSC populations in P3 (top) and adult (bottom) mice (n = 10 mice per group). h, Top, quantitation of the numbers of mSSCs per million events in FACS analysis of P3 and adult mice (n = 10 mice per group). Bottom, quantitation of colony-forming units (CFUs) isolated by FACS from P3 and adult distal femurs and seeded at a density of 1,000 cells per plate (n = 6 mice per group). Unless otherwise stated, graphs show mean ± s.e.m.; two-tailed Student’s t-test. Exact P values to two significant figures are shown.
Fig. 2 |
Fig. 2 |. The effect of focal MF on mSSCs at the articular surface.
a, Schematic of the experimental outline. MF surgery was performed on the distal femurs of adult mice. The tissue was collected at 1, 2 and 4 weeks after surgery and analyzed using the indicated techniques. b, Histological analysis of 9-week-old adult mice that underwent MF surgery; tissue was collected 4 weeks after MF surgery. From left to right, representative fluorescence microscopy of the clonal expansion within the MF defect in an adult β actin-CreERT/Rainbow mouse; representative pentachrome staining of fibrocartilage within the MF defect of a C57BL/6 mouse (inset shows higher magnification of chondrocytes marked by the black arrowhead); and representative IF staining for collagen COL1, COL2, COL10 and MMP-13 of the same C57BL/6 mouse. The MF defect is outlined in solid lines, and white arrowheads indicate the surface of the regenerate. Black arrowheads indicate uninjured tissue. The dotted line indicates the articular surface. Scale bars, 100 μm. n = 3 mice per group. c, Quantitation of mSSCs and mBCSPs numbers over the course of 4 weeks after MF surgery. N, normal/uninjured mice (n = 10 mice per group per timepoint). Left, representative pentachrome staining for fibrocartilage. White arrowheads indicate the surface of the regenerate. Black arrowhead indicates uninjured tissue. Inset shows higher magnification view, with chondrocytes marked by black arrowheads. n = 5 mice. Right, the adjacent section stained for EdU within the regenerate (outlined by a box and marked with a white arrowhead); the black arrowhead marks uninjured articular cartilage. The dotted line indicates the articular cartilage surface. Scale bars, 100 μm. n = 3 mice. e, Quantitation of the percentage of EdU+ mSSCs and mBCSPs 1 week after MF surgery. n = 3 mice per group. f, Schematic of the experimental design. A parabiosis model was established with a C57BL/6 mouse and a GFP+ mouse. Blood was drawn from the tail vein to assess chimerism. After 4 weeks, MF surgery was performed on the non-GFP mouse, and cells were analyzed on postoperative day (POD) 7 by FACS. g, Left, Representative flow cytometry plot showing GFP+ cells within the circulation of a non-GFP parabiont. Right, Quantitation of non-GFP and GFP+ mSSCs and mBCSPs in the non-GFP mouse (n = 3 per group). h, Histological analysis of OA/MF mice 4 weeks after MF surgery. From left to right, Representative fluorescence microscopy of the clonal expansion within the MF defect of a β actin-CreERT/Rainbow mouse (n = 3 mice); representative pentachrome staining of fibrocartilage within the regenerate of a C57BL/6 mouse (inset shows higher magnification of chondrocytes marked by the black arrowhead); and IF staining for COL1, COL2, COL10 and MMP-13 of the same C57BL/6 mouse. Dotted line indicates the articular surface. White arrowheads indicate the surface of the regenerate. Scale bars, 100 μm. n = 3 mice. i, Quantification of the numbers of mSSCs in adult mice, OA mice and OA/MF mice. Ordinary one-way ANOVA (P = 0.012) with post hoc analysis using the Sidak method to compare between specific means. n = 10 mice per group. j, Quantification of an in vitro EdU assay of FACS-isolated adult, OA and OA/MF mSSCs. Ordinary one-way ANOVA (P = 0.028) with post hoc analysis using the Sidak method to compare between specific means. n = 3 mice per group. k, Left, PCA plot showing clustering of microarray data from adult, Ad/MF and P3 mice. Right, Pearson product-moment correlation coefficient (r) of gene-expression activity. |r| = 1 signifies identical correlation, or no variance. n = 3 for Ad and Ad/MF; n = 4 for P3. Unless otherwise stated, graphs show mean ± s.e.m.; two-tailed Student’s t-test. Exact P values to two significant figures shown.
Fig. 3 |
Fig. 3 |. Manipulating the adult articular microenvironment to facilitate mSSC-derived chondrogenesis.
a, Schematic of the experimental outline to assess cell intrinsic changes in GFP+ adult mice (Ad) versus adult microfractured mice (Ad/MF). Cells were isolated using FACS and transplanted either within the renal capsule or within a MF defect at the distal femur of immunocompromised NSG mice. b, Transplantation of Ad and Ad/MF GFP+ mSSCs into the renal capsule of an NSG mouse. Left, brightfield and fluorescence microscopy show gross images of two grafts within the renal capsule. Solid lines indicate the grafts. Scale bar, 1 mm. Right, pentachrome staining of the Ad and Ad/MF mSSC grafts. Scale bar, 100 μm. n = 4 mice per group. c, Transplantation of adult and Ad/MF GFP+ mSSCs orthotopically. Left, brightfield and fluorescence microscopy show gross images of the orthotopic transplant within the MF defect. Solid lines indicate the grafts. Right, pentachrome staining of the Ad and Ad/MF mSSC grafts within the MF defects. Scale bar, 500 μm. n = 4 mice per group. d, Representative IF staining for COL1, COL2, COL10 and MMP-13 of GFP+ mSSC transplants within the MF defects. Scale bars, 500 μm. n = 3 mice per group. e, Schematic of the experimental design to assess cell-extrinsic effects of the niche. Ad/MF mSSCs are isolated by FACS and transplanted into the renal capsules of NSG mice along with hydrogels containing either BMP2 or BMP2 + sVEGFR1. OA/MF mice are treated with hydrogels containing PBS, BMP2 or BMP2 + sVEGFR1. f, Representative pentachrome stains of Ad/MF renal-capsule transplants treated with either BMP2 or BMP2 + sVEGFR1. Left, low magnification (scale bar, 1 mm) with the region of interest (ROI) indicated by the black arrowhead. Right, higher magnification of ROI. Scale bars, 500 μm. n = 4 mice per group. g, OA/MF defects with transplants of hydrogels with the indicated factors. From left to right, gross images (scale bars, 1 mm); representative pentachrome stains of the regenerate (scale bars, 500 μm); and higher magnification (scale bars, 100 μm) of the pentachrome stains. n = 8 mice per group. h, Tissue regeneration. Top, a schematic of the MF defect outlined by the dotted orange line and the regenerate outlined by the blue line (scale bar, 500 μm). The percentage regeneration was calculated as: 100 × (A / A + B). Middle, quantification of regeneration with treatment of BMP2, BMP2 + sVEGFR1 or PBS. Graph shows mean ± s.e.m.; ordinary one-way ANOVA (P < 0.0001) with post hoc analysis using the Sidak method to compare between specific means. Exact P values to two significant figures shown. Bottom, quantitation of the composition of the articular surface in mice after treatment with the indicated factors. Yellow signifies bone, and blue signifies cartilage within the regenerate (n = 5 mice per group).
Fig. 4 |
Fig. 4 |. Regeneration of human articular cartilage in a preclinical xenograft model.
a, Schematic of the experimental outline. Human adult and fetal SSCs are isolated by FACS and transplanted within the kidney capsule of immunocompromised NSG mice. Cell proliferation is analyzed by Click-iT EdU. A human xenograft MF model is established by transplanting whole fetal phalanges under the dorsum of P3 NSG pups. Click-iT EdU is used to analyze cell proliferation. Hydrogels are transplanted in MF defects of the phalanges, and tissue regeneration is analyzed by histology. b, Representative flow cytometry showing the validated human articular SSC (hSSC) profile and percentages of PDPN+CD146 cells from human fetal cartilage (top) and human adult cartilage (bottom). c, Quantification of the numbers of hSSC per million events in FACS analysis of fetal and adult cartilage. (b,c, adult cartilage n = 25 biologically independent samples, 20 male, 5 female. 48-90 years; fetal cartilage n = 12 biologically independent samples, 18 weeks gestation). d, Representative pentachrome stains of human fetal (top) and human adult (bottom) articular cartilage 4 weeks after transplantation into NSG mice. Scale bars, 200 μm (n = 8 biologically independent samples per group). e, Representative fluorescence microscopy of in vivo Click-iT EdU assays of hSSC transplants within the renal capsule of NSG mice. Top, human fetal articular cartilage. Bottom, human adult articular cartilage transplant. Scale bars, 45 μm. n = 8 biologically independent samples per group. f, Quantitation of the number of clones per HPF (n = 15 biologically independent samples per group). g, Gestation-week-18 human fetal phalanges were transplanted subcutaneously into the dorsum of P3 RFP NSG mice (scale bar, 5 mm); the same mouse is shown at 18 weeks post-transplant. h, From left to right, EdU GFP+ non-RFP human tissue proliferating in vivo. Scale bar 100 μm. MRI shows healthy human tissue, and micro-CT shows evidence of ossification of the human diaphysis in vivo. The xenograft is outlined with an orange dotted line. Representative of two independent experiments. i, Left, evidence of healthy viable human fetal phalangeal tissue with a schematic showing areas of MF. Right, three areas of MF on a human fetal phalangeal diaphysis indicated by white arrows. Representative of 15 independent experiments. j, Quantification of hSSC post MF of human fetal phalangeal diaphyseal regions. (n = 15 per group). k, Gross image of MF human fetal phalangeal diaphysis with transplanted hydrogels marked by white arrows. Sutures indicate the sites between MF defects. Dotted line indicates the plane of sectioning. l, Schematic showing the regions where MF surgery was performed on the human fetal phalangeal diaphysis, as indicated by blue lines. Topical factors were applied within the MF defect. m, Top, PBS control. Bottom, BMP2 + sVEGFR1. Left, pentachrome stains for cartilage within the MF defect. Right, corresponding IF staining of the regenerate for (left to right) human nuclear antigen (HNA), mouse-specific MHC and COL10. Scale bars, 500 μm. n = 8 mice per group. n, Quantification of the tissue composition within the MF defects that were treated with PBS or BMP2 + sVEGFR1. Yellow signifies bone and blue signifies cartilage within the regenerate. o, Top, representative pentachrome staining of de novo cartilage formation within a MF defect treated with BMP2 + sVEGFR1. Scale bar, 500 μm. Bottom, quantification of the tissue regeneration within the MF defects that were treated with PBS or BMP2 + sVEGFR1. n = 5 mice per group. Unless otherwise stated, graphs show mean ± s.e.m.; two-tailed Student’s t-test. Exact P values to two significant figures.

Comment in

  • Cartilage repaired by resident stem cells in an OA model.
    Clarke J. Clarke J. Nat Rev Rheumatol. 2020 Oct;16(10):537. doi: 10.1038/s41584-020-0501-6. Nat Rev Rheumatol. 2020. PMID: 32873967 No abstract available.
  • 'Actum ne agas'.
    Madry H, Hunziker EB. Madry H, et al. Osteoarthritis Cartilage. 2021 Mar;29(3):300-303. doi: 10.1016/j.joca.2020.12.010. Epub 2020 Dec 31. Osteoarthritis Cartilage. 2021. PMID: 33387652 No abstract available.

References

    1. Robinson WH et al. Low-grade inflammation as a key mediator of the pathogenesis of osteoarthritis. Nat. Rev. Rheumatol 12, 580–592 (2016). - PMC - PubMed
    1. Rahmati M, Mobasheri A & Mozafari M Inflammatory mediators in osteoarthritis: a critical review of the state-of-the-art, current prospects, and future challenges. Bone 85, 81–90 (2016). - PubMed
    1. Marques-Rocha JL et al. Noncoding RNAs, cytokines, and inflammation-related diseases. FASEB J. 29, 3595–3611 (2015). - PubMed
    1. Liu-Bryan R & Terkeltaub R Emerging regulators of the inflammatory process in osteoarthritis. Nat. Rev. Rheumatol 11, 35–44 (2015). - PMC - PubMed
    1. Hoemann CD et al. Chondroinduction is the main cartilage repair response to microfracture and microfracture with BST-CarGel: results as shown by ICRS-II histological scoring and a novel zonal collagen type scoring method of human clinical biopsy specimens. Am. J. Sports Med 43, 2469–2480 (2015). - PubMed

Publication types

MeSH terms