. 2020 Oct;21(10):1181-1193.
doi: 10.1038/s41590-020-0753-y. Epub 2020 Aug 17.

Basophils prime group 2 innate lymphoid cells for neuropeptide-mediated inhibition

Affiliations

Basophils prime group 2 innate lymphoid cells for neuropeptide-mediated inhibition

Juan M Inclan-Rico et al. Nat Immunol. 2020 Oct.

Abstract

Type 2 cytokine responses promote parasitic immunity and initiate tissue repair; however, they can also result in immunopathologies when not properly restricted. Although basophilia is recognized as a common feature of type 2 inflammation, the roles basophils play in regulating these responses are unknown. Here, we demonstrate that helminth-induced group 2 innate lymphoid cell (ILC2) responses are exaggerated in the absence of basophils, resulting in increased inflammation and diminished lung function. Additionally, we show that ILC2s from basophil-depleted mice express reduced amounts of the receptor for the neuropeptide neuromedin B (NMB). Critically, NMB stimulation inhibited ILC2 responses from control but not basophil-depleted mice, and basophils were sufficient to directly enhance NMB receptor expression on ILC2s. These studies suggest that basophils prime ILC2s to respond to neuron-derived signals necessary to maintain tissue integrity. Further, these data provide mechanistic insight into the functions of basophils and identify NMB as a potent inhibitor of type 2 inflammation.


Conflict of interest statement

Competing Interests Statement

Mark C. Siracusa is the founder and president of NemaGen Discoveries.

Figures

Extended Data Figure 1.
Extended Data Figure 1.. Basophils limit helminth-induced pulmonary inflammation.
(a) Supernatant levels of IL-4, IL-5 and IL-13 from re-stimulated mesenteric lymph nodes (mLNs) isolated from control or basophil-depleted mice. Mucus production was evaluated in control and basophil-depleted mice on day 7 post-Nb infection by (b), periodic acid shiff (PAS) staining and (c), Muc5ac expression in the lungs by real-time PCR. (d), Lung pathology was evaluated by H&E-stained sections with individual images digitally tiled together to provide a larger overview. P values were determined by two-tailed Student’s t-tests. (a-d), Representative of at least 3 separate experiments with at least 5 mice per group. *P < 0.05, **P < 0.01, ***P < 0.001. (b), Illustrate data pooled from 2 separate experiments.
Extended Data Figure 2.
Extended Data Figure 2.. Basophil depletion results in elevated ILC2 responses.
(a), Lung neutrophils and (b), eosinophils were quantified by flow cytometry on day 7 post-Nb infection in control or baso-dep mice. (c), Representative flow cytometric gating strategy to evaluate neutrophils and eosinophils. (d), ILC2s in the lung were quantified on day 7 post-Nb infection in control or baso-dep mice. Intracellular cytokine staining for (e, f), IL-5 and IL-13 was performed on lineage negative, CD90+, CD127+ ILC2s in lung on day 7 post-Nb infection and cytokine positive cells were quantified. (g), Representative flow cytometric gating strategy to evaluate ILC2 populations. P values were determined by two-tailed Student’s t-tests. *P < 0.05, **P < 0.01, ***P < 0.001. (a-g), Representative of at least 3 separate experiments with at least 5 mice per group.
Extended Data Figure 3.
Extended Data Figure 3.. Constitutive ablation of basophils is associated with increased ILC2 activation.
(a, b), IL-5+ and IL-13+ ILC2s, as well as (c), eosinophils in the BAL and (d-f), lungs were quantified in control and Mcpt8Cre-4get mice that constitutively lack basophils, 7 days post-Nb infection. P values were determined by two-tailed Student’s t-tests. *P < 0.05, **P < 0.01, ***P < 0.001. (a-f), Representative of at least 3 separate experiments with at least 5 mice per group.
Extended Data Figure 4.
Extended Data Figure 4.. Basophils are sufficient to limit helminth-induced ILC2 responses.
(a), ILC2 numbers, (b), ILC2 production of IL-5, and (c), IL-13, as well as (d) eosinophil numbers were quantified in the lung on day 7 post-Nb infection in control mice, baso-dep mice, or baso-dep mice that received adoptive transfers of basophils. (e), H&E staining of lung sections on day 7 post-Nb infection with individual images digitally tiled together to provide a larger overview. Mucus production in the lung was evaluated by (f), PAS staining of lung sections and (g), Muc5ac expression. P values were determined by two-tailed Student’s t-tests. *P < 0.05, **P < 0.01, ***P < 0.001. (a-g), Representative of at least 3 separate experiments with at least 4 mice per group.
Extended Data Figure 5.
Extended Data Figure 5.. Basophils regulate ILC2s independently of adaptive lymphocytes.
Nb-infected Rag2−/− mice were treated with isotype control or the basophil-depleting antibody MAR-1 and (a), ILC2 responses and (b), eosinophilia were determined in the BAL and (c,d), lung on day 7 post-infection. (e), H&E staining of lung sections on day 7 post-Nb infection with individual images digitally tiled together to provide a larger overview. (f), Mucus production in the lung was evaluated by Muc5ac expression. P values were determined by two-tailed Student’s t-tests. *P < 0.05, **P < 0.01, ***P < 0.001. (a-f), Representative of at least 3 separate experiments with at least 2 mice per naive groups and at least 4 mice per infected groups.
Extended Data Figure 6.
Extended Data Figure 6.. Elevated ILC2 responses are not associated with increased cytokine alarmin expression.
(a-c), Expression of cytokine alarmins in the lungs of control and baso-dep mice was determined on day 7 post-Nb infection by real-time PCR. (d, e), Numbers of IL-33-GFP+ type 1 and type 2 pneumocytes were evaluated in IL-33-GFP-reporter mice infected with Nb and treated with the basophil-depleting antibody MAR-1. Expression of (f), Il10 and (g), Areg in the lungs of control and baso-dep mice was determined on day 7 post-Nb infection by real-time PCR. Splenic basophils were sort-purified and cultured (O/N) with IL-3 and anti-IgE antibody and supernatant levels of (h), IL-6, (i), amphiregulin (Areg), and (j), IL-10 were evaluated by ELISA. P values were determined by two-tailed Student’s t-tests. *P < 0.05, **P < 0.01, ***P < 0.001. (a-g), Representative of at least 2 separate experiments with at least 2 mice per naive groups and at least 5 mice per infected groups. (h-j) Representative of at least 3 separate experiments with at least 5 individual samples of sort-purified basophils from 5 mice per experimental group.
Extended Data Figure 7.
Extended Data Figure 7.. Single cell RNAseq analysis of lung-resident ILC2s.
(a), Uniform Manifold Approximation and Projection (UMAP) plot illustrating defined clusters of cells generated by single cell RNA-sequencing of lung-resident live ILC2 populations (CD45+Lin-CD90+CD127+) sort-purified from control (and basophil-depleted (baso-dep) mice 5 days post-Nb infection. (b), Top 10 marker genes expressed by each cluster of ILC2s. (c), Single-cell expression of Il5, Il13, Areg, Arg1, Il1rl1, and Il17rb in ILC cell clusters as defined in A. Horizontal bars represent mean normalized expression. P values were determined by Wilcoxon signed rank sum test. *P < 0.05, **P < 0.01, ***P < 0.001.
Extended Data Figure 8.
Extended Data Figure 8.. Analysis of NMBR expression in the hematopoietic compartment.
(a), Heat map illustrating representative genes of interest expressed in control or baso-dep ILC2s. Surface NMBR expression by (b), CD4+ T cells, (c), alveolar macrophages, (d), non-alveolar macrophages, (e), neutrophils, and (f), eosinophils was determined in lung suspensions of naïve and mice infected with Nb 7 days prior. P values were determined by two-tailed Student’s t-tests. *P < 0.05, **P < 0.01, ***P < 0.001. (b-f), Representative of at least 3 separate experiments with at least 2 mice per naive groups and at least 4 mice per infected groups.
Extended Data Figure 9.
Extended Data Figure 9.. NMB-NMBR signaling suppresses helminth-induced ILC2 responses.
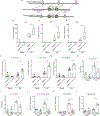
(a), Schematic illustrating targeting strategy and placement of loxP cassettes upstream and downstream of exon 2 of the Nmbr gene. (b-d), Type 2 cytokine expression in the lungs of NMBRfl/fl controls and NMBRfl/fl x Vav-iCre+ mice was determined on day 7 post-Nb infection by real-time PCR. (e), IL-5+ and (f), IL-13+ ILC2s, as well as (g), eosinophils were quantified in the lungs of NMBRfl/fl x Vav-iCre+ mice 7 days post-Nb. Nb-infected Rag2−/− mice were treated with PBS or rNMB (i.t.) and (h, i), the percentage of IL-5+ and IL-13+ ILC2s were determined in the BAL and (j), the total number of IL-5+ and IL-13+ ILC2s were determined in the lung on day 7 post-infection. (k), eosinophils and (l), neutrophils were determined in the lungs of Rag2−/− mice treated with PBS or rNMB on day 7-post infection. P values were determined by two-tailed Student’s t-tests. *P < 0.05, **P < 0.01, ***P < 0.001. (b-l), Representative of 3 separate experiments with at least 3 mice per naive groups and at least 5 mice per infected groups.
Extended Data Figure 10.
Extended Data Figure 10.. Basophils are required for NMBR-mediated inhibition of ILC2s.
Sort-purified ILC2s were cultured (O/N) with vehicle or rNMB in the presence of IL-2 and IL-7 or IL-2, IL-7, and IL-33. (a, b), The percentage of IL-5+ and IL-13+ ILC2s were quantified by intracellular staining. (c, d), IL-5 and IL-13 levels in the supernatant were quantified by ELISA. Sort-purified ILC2s were cultured (O/N) alone or with activated basophils. (e), Cytokine levels in the supernatant were monitored by ELISA and (f, g), cell proliferation was evaluated by CTV dilution 4 days post-culture. (h), Heat map illustrating genes differentially expressed at 2.0-fold or higher between control or NMB-treated ILC2s. (i), Heat map illustrating genes not differentially expressed in control or NMB-treated ILC2s. P values were determined by two-tailed Student’s t-tests. *P < 0.05, **P < 0.01, ***P < 0.001. (a-g) Representative of at least 3 separate experiments with at least 5 individual samples of sort-purified ILC2s in each experimental group.
Figure 1.
Figure 1.. Basophils regulate helminth-induced inflammation.
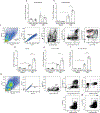
(a), Intestinal worm burdens were quantified on day 7 post-Nb infection in control or basophil-depleted (baso-dep) mice. (b), Type 2 cytokine expression in the lungs of control and baso-dep mice was determined on day 7 post-Nb infection by real-time PCR. (c), Lung-resident basophils were determined by in vivo staining with anti-CD200R1 at day 3 post-infection (d), The percentages of lung-resident basophils were quantified post-Nb infection. (e), Lung pathology was evaluated on day 7 post-Nb infection by hematoxylin and eosin (H&E) staining. (f), Oxygen levels were determined by pulse oximetry for control and baso-dep mice. P values were determined by two-tailed Student’s t-tests. *P < 0.05, **P < 0.01, ***P < 0.001. (a-f), Representative of at least 3 separate experiments with at least 4 mice per group. (a,b,f), Illustrate data pooled from 2 separate experiments.
Figure 2.
Figure 2.. Basophils negatively regulate ILC2 responses.
(a), Neutrophils, (b), eosinophils, and (c), ILC2s in the BAL were quantified on day 7 post-Nb infection in control or baso-dep mice. Intracellular cytokine staining for (d), IL-5 and (e), IL-13 was performed on Lin-D90+CD127+ ILC2s in the BAL on day 7 post-Nb infection and cytokine-positive cells were quantified. Basophils were adoptively transferred (i.t.) into baso-dep mice post-Nb infection and the number of (f), total ILC2s, (g), IL-5+ (h), IL-13+ ILC2s, or (i), eosinophils in the BAL was quantified. P values were determined by two-tailed Student’s t-tests. *P < 0.05, **P < 0.01, ***P < 0.001. (a-i), Representative of at least 3 separate experiments with at least 4 mice per group.
Figure 3.
Figure 3.. Basophils regulate ILC2 responses independently of T cells.
Nb-infected Rag2−/− mice were treated with isotype control or the basophil-depleting antibody Ba103 and (a), IL-5+ and IL-13+ ILC2s as well as (b), eosinophilia were determined in the BAL and (c, d), lungs on day 7 post-infection. (e), Mucus production in the lung was evaluated by Muc5ac expression. (f), H&E staining of lung sections on day 7 post-Nb infection with individual images digitally tiled together to provide a larger overview. P values were determined by two-tailed Student’s t-tests. *P < 0.05, **P < 0.01, ***P < 0.001. (a-e), Representative of at least 3 separate experiments with at least 2 mice per group. (D), Illustrated data pooled from 2 separate experiments.
Figure 4.
Figure 4.. Basophils promote expression of NMBR on ILC2s.
RNA-sequencing analysis of sort-purified ILC2s from the lungs of control or basophil-depleted (baso-dep) mice was performed on day 5 post-Nb. (a), Heat map illustrating genes expressed differently at 2.0-fold or higher between control or baso-dep ILC2s. DAVID pathways analysis of the genes enriched in control ILC2s was performed. (b), Genes enriched in control ILC2s that define the rhodopsin-like pathway. For RT-qPCR studies, lung-resident ILC2s from control or basophil-depleted mice were sort-purified on day 7 post-Nb and (c), Nmbr and Nmur1 expression levels were evaluated. (d), Representative histograms of surface NMBR expression by ILC2s or (f), alveolar macrophages from the lungs of control or baso-dep mice on day 7 post-Nb. (e), gMFI quantification of NMBR expression by ILC2s. (g), Nmb, Nmu, and Mcpt8 expression in the lungs of control or baso-dep mice was determined on day 7 post-Nb by real-time PCR. P values were determined by two-tailed Student’s t-tests. *P < 0.05, **P < 0.01, ***P < 0.001. (c-g), Representative of at least 3 separate experiments with at least 3 mice per experimental group. (a, b), Represents data generated from 3 individual samples of ILC2s sort-purified from 5 mice per experimental group.
Figure 5.
Figure 5.. NMB suppresses helminth-induced type 2 cytokine responses.
Nb-infected WT mice were treated daily with PBS or rNMB (i.t.) and (a,b), ILC2 responses and (c), eosinophilia in the BAL were quantified on day 7 post-Nb. (d,e), ILC2 responses, (f), eosinophilia and (g), Muc5ac expression were determined in the lungs. (h), Worm burdens were determined in the intestine. (i), Representative lung pathology (H&E staining) and (j), (PAS staining) observed in naïve and Nb-infected mice treated with PBS or rNMB. P values were determined by two-tailed Student’s t-tests. *P < 0.05, **P < 0.01, ***P < 0.001. (a-j), Representative of at least 2 separate experiments with at least 5 mice per group.
Figure 6.
Figure 6.. NMBR expression is required to limit helminth-induced inflammation.
NMBRfl/fl mice were generated and crossed with Vav-iCre mice to selectively ablate NMBR expression in hematopoietic cells. Surface expression of NMBR was evaluated in (a), CD45 cells, (b), CD45+ cells, and (c), ILC2s of NMBRfl/fl and NMBRfl/fl x Vav-iCre+ mice by flow cytometric analysis 7 days post-Nb. (d, f), IL-5+ and (e, g) IL-13+ ILC2s, as well as (h), eosinophils were quantified in the BAL of NMBRfl/fl x Vav-iCre+ mice 7 days post-Nb. (i), RT-qPCR analysis of Muc5ac expression and (j), lung pathology (H&E staining) were determined 7 days post-Nb. P values were determined by two-tailed Student’s t-tests. *P < 0.05, **P < 0.01, ***P < 0.001. (a-j), Representative of at least 3 separate experiments with at least 5 mice per group.
Figure 7.
Figure 7.. NMB inhibits ILC2-mediated anti-helminth immunity.
Nb-infected Rag2−/− mice were treated daily with PBS or rNMB (i.t.) and (a, b), ILC2 responses and (c), eosinophilia in the BAL were quantified 7 days post-Nb infection. (d), Muc5ac expression in the lung and (e), worm burdens in the intestine were determined. (f), Il17 expression and (g), neutrophils in the lungs of Rag2−/− mice that were treated with PBS or rNMB (i.t.) following Nb. (h), Lung sections stained with H&E illustrating representative pathology observed in Nb-infected Rag2−/− mice were treated with PBS or rNMB. (i), Representative picture illustrating appearance of BAL fluid and (j), quantification of red blood cells in the BAL isolated from Nb-infected Rag2−/− mice treated with PBS or rNMB. P values were determined by two-tailed Student’s t-tests. *P < 0.05, **P < 0.01, ***P < 0.001. (a-j), Representative of at least 3 separate experiments with at least 5 mice per group.
Figure 8.
Figure 8.. Basophils prime ILC2s for negative regulation by NMB.
ILC2s were sort-purified from the lungs of control or basophil-depleted (baso-dep) mice on day 7 post-Nb and cultured (O/N) with IL-2 and IL-7 in the presence or absence of rNMB. (a), IL-5 and IL-13 levels in culture supernatants were determined by ELISA and (b), cell viability was evaluated by negative staining for 7-AAD and Annexin V. (c), Representative histograms of surface NMBR expression in sort-purified ILC2s cultured (O/N) with L-2 and IL-7 alone, or with activated basophils. (d), gMFI quantification of NMBR expression by ILC2s. (e), NMBR surface expression was evaluated in sort-purified ILC2s cultured (O/N) with IL-33, basophils, IL-4, and PGE2 in the presence of IL-2 and IL-7. Sort-purified ILC2s were cultured for 4 days with vehicle, rNMB, PGE2, or both, in the presence of IL-2 and IL-7 and (f, g), cell proliferation by CTV dilution, (h), surface NMBR expression, and (i), cytokine levels in the supernatant were monitored. (j), Volcano plot of differentially-expressed genes of ILC2s treated with vehicle or rNMB (O/N). (k), Levels of cytokines in the supernatant of ILC2s cultured (O/N) with vehicle, or in the presence of the P2rx7 inhibitor, brilliant blue G. P values were determined by two-tailed Student’s t-tests. *P < 0.05, **P < 0.01, ***P < 0.001. (a,b), Representative of 3 separate experiments with at least 5 mice per group. (c-i, k), Representative of 3 separate experiments with data generated from at least 5 individual samples of ILC2s sort-purified from 5 mice per experimental group.

Comment in

  • Basophils balance ILC2s.
    Bird L. Bird L. Nat Rev Immunol. 2020 Oct;20(10):592-593. doi: 10.1038/s41577-020-00437-3. Nat Rev Immunol. 2020. PMID: 32807864 No abstract available.

Similar articles

Cited by

References

    1. Schistosomiasis and soil-transmitted helminthiases: number of people treated in 2015. Wkly Epidemiol Rec 91, 585–595 (2016). - PubMed
    1. Jourdan PM, Lamberton PHL, Fenwick A & Addiss DG Soil-transmitted helminth infections. Lancet, doi:10.1016/S0140-6736(17)31930-X (2017). - DOI - PubMed
    1. Jia TW, Melville S, Utzinger J, King CH & Zhou XN Soil-transmitted helminth reinfection after drug treatment: a systematic review and meta-analysis. PLoS neglected tropical diseases 6, e1621, doi:10.1371/journal.pntd.0001621 (2012). - DOI - PMC - PubMed
    1. Zhan B et al. Advancing a multivalent ‘Pan-anthelmintic’ vaccine against soil-transmitted nematode infections. Expert Rev Vaccines 13, 321–331, doi:10.1586/14760584.2014.872035 (2014). - DOI - PMC - PubMed
    1. Allen JE & Maizels RM Diversity and dialogue in immunity to helminths. Nature reviews. Immunology 11, 375–388, doi:10.1038/nri2992 (2011). - DOI - PubMed

Methods-only references

    1. Han H et al. IL-33 promotes gastrointestinal allergy in a TSLP-independent manner. Mucosal Immunol 11, 394–403, doi:10.1038/mi.2017.61 (2018). - DOI - PMC - PubMed
    1. Wada T et al. Selective ablation of basophils in mice reveals their nonredundant role in acquired immunity against ticks. The Journal of clinical investigation 120, 2867–2875, doi:10.1172/jci42680 (2010). - DOI - PMC - PubMed
    1. Bouchery T et al. The Study of Host Immune Responses Elicited by the Model Murine Hookworms Nippostrongylus brasiliensis and Heligmosomoides polygyrus. Current protocols in mouse biology 7, 236–286, doi:10.1002/cpmo.34 (2017). - DOI - PubMed
    1. Ohmori K et al. IL-3 induces basophil expansion in vivo by directing granulocyte-monocyte progenitors to differentiate into basophil lineage-restricted progenitors in the bone marrow and by increasing the number of basophil/mast cell progenitors in the spleen. Journal of immunology (Baltimore, Md. : 1950) 182, 2835–2841, doi:10.4049/jimmunol.0802870 (2009). - DOI - PMC - PubMed
    1. Anderson KG et al. Intravascular staining for discrimination of vascular and tissue leukocytes. Nature protocols 9, 209–222, doi:10.1038/nprot.2014.005 (2014). - DOI - PMC - PubMed

Publication types