. 2020 Dec;23(12):1629-1636.
doi: 10.1038/s41593-020-0692-9. Epub 2020 Aug 17.

Viral manipulation of functionally distinct interneurons in mice, non-human primates and humans

Affiliations

Viral manipulation of functionally distinct interneurons in mice, non-human primates and humans

Douglas Vormstein-Schneider et al. Nat Neurosci. 2020 Dec.

Erratum in

  • Publisher Correction: Viral manipulation of functionally distinct interneurons in mice, non-human primates and humans.
    Vormstein-Schneider D, Lin JD, Pelkey KA, Chittajallu R, Guo B, Arias-Garcia MA, Allaway K, Sakopoulos S, Schneider G, Stevenson O, Vergara J, Sharma J, Zhang Q, Franken TP, Smith J, Ibrahim LA, Mastro KJ, Sabri E, Huang S, Favuzzi E, Burbridge T, Xu Q, Guo L, Vogel I, Sanchez V, Saldi GA, Gorissen BL, Yuan X, Zaghloul KA, Devinsky O, Sabatini BL, Batista-Brito R, Reynolds J, Feng G, Fu Z, McBain CJ, Fishell G, Dimidschstein J. Vormstein-Schneider D, et al. Nat Neurosci. 2022 Sep;25(9):1247. doi: 10.1038/s41593-022-01155-w. Nat Neurosci. 2022. PMID: 35945454 No abstract available.

Abstract

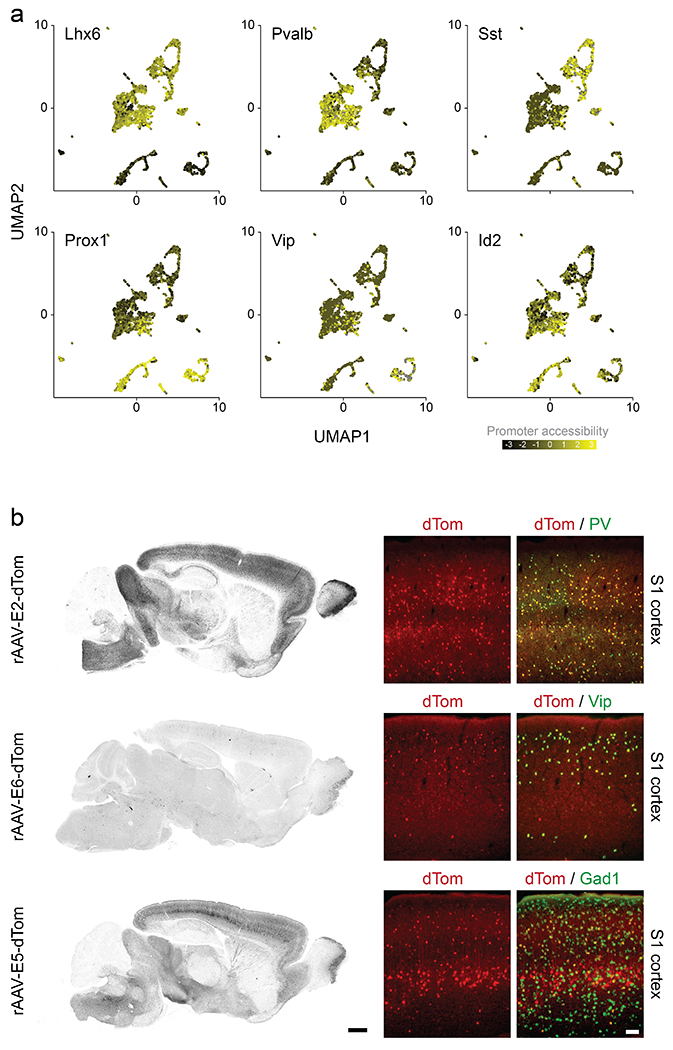
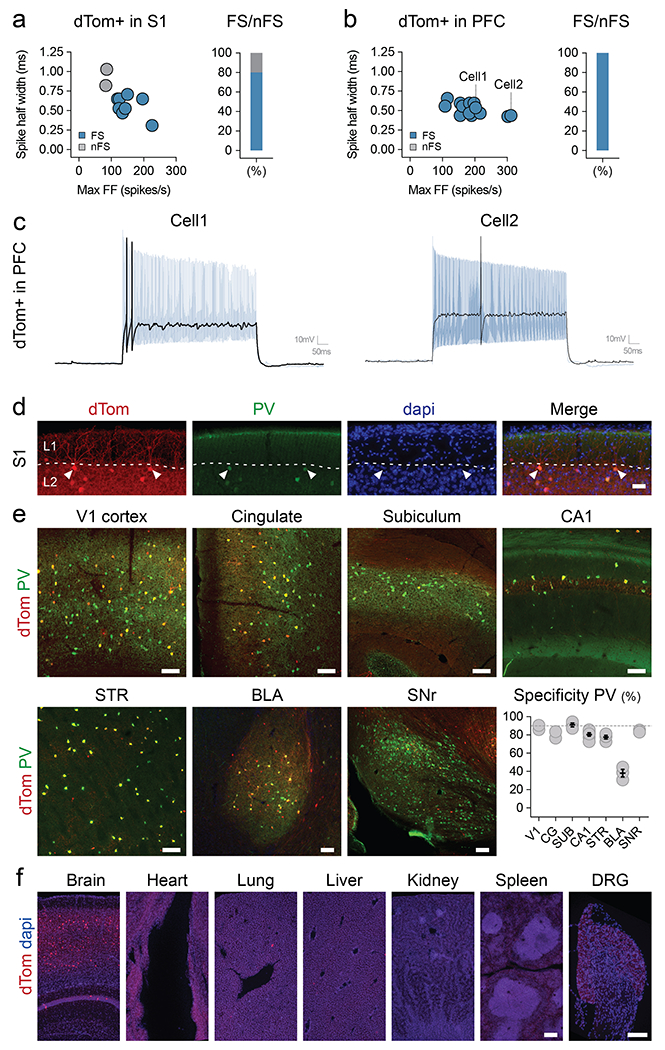
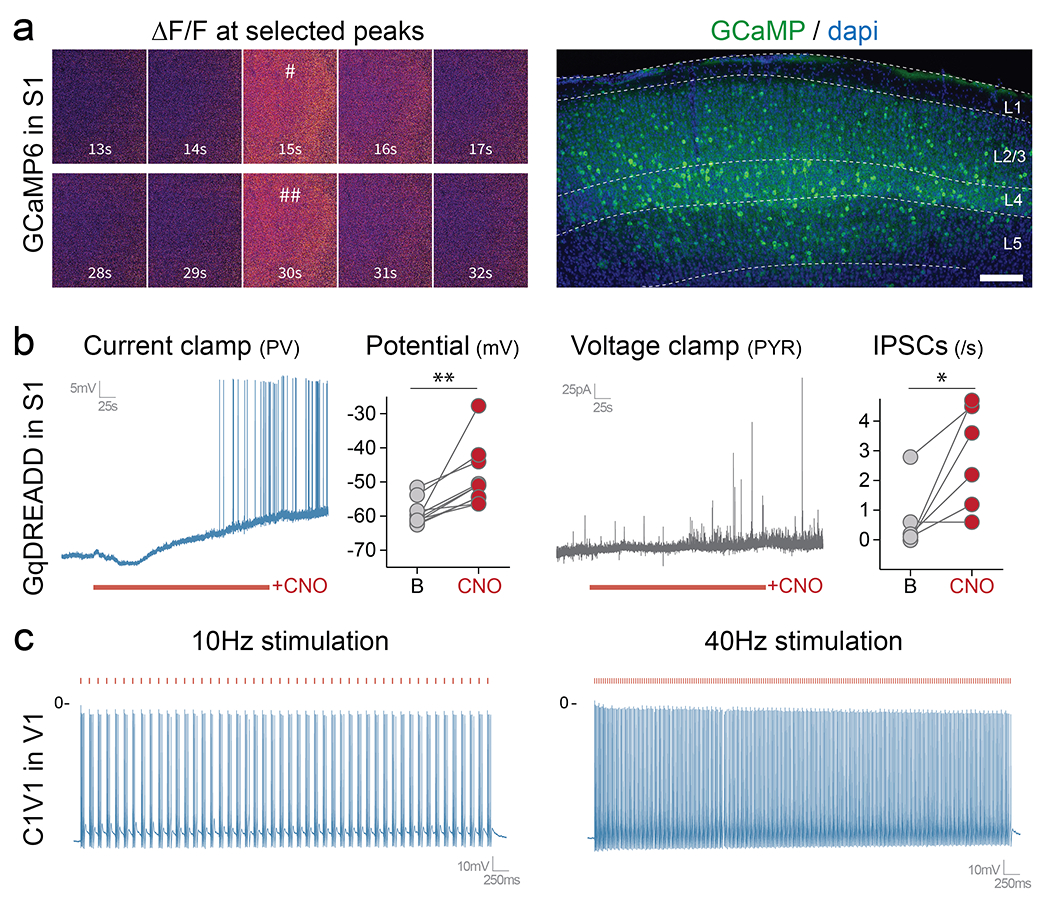
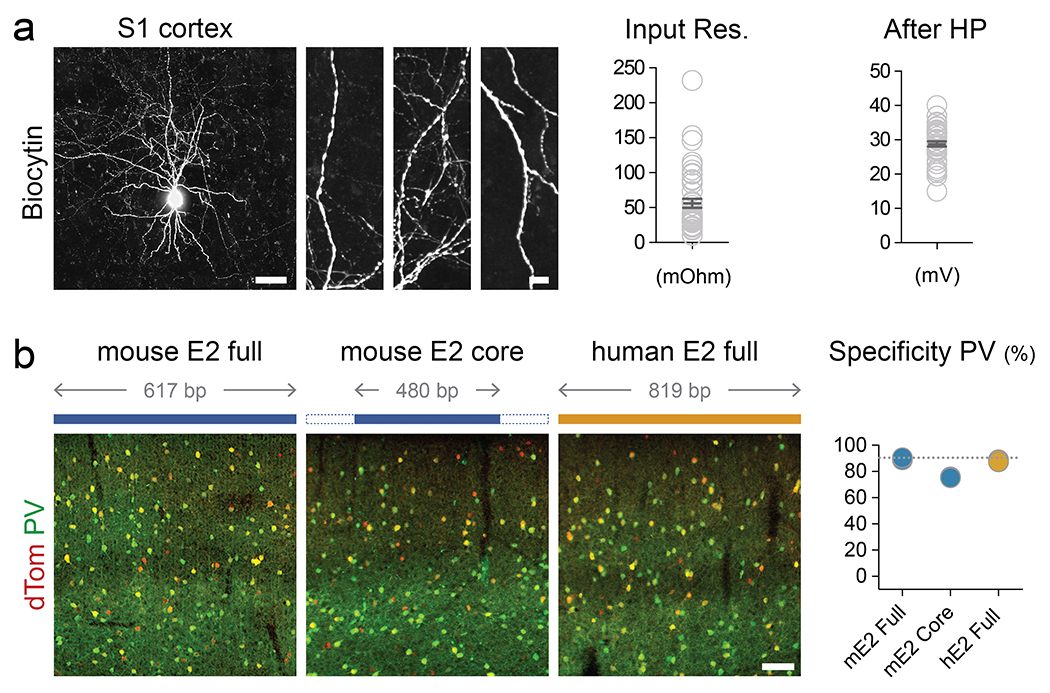
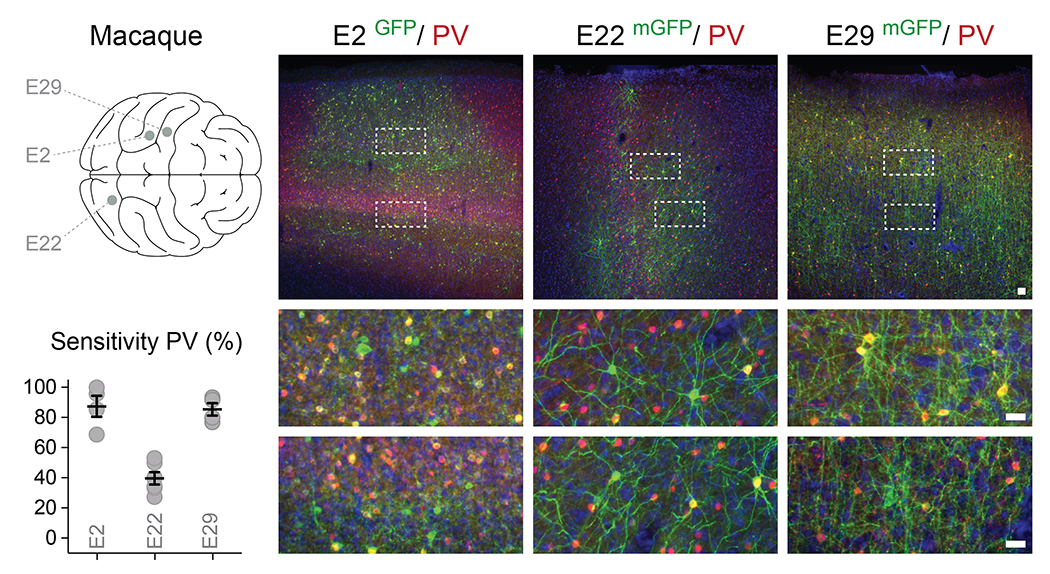
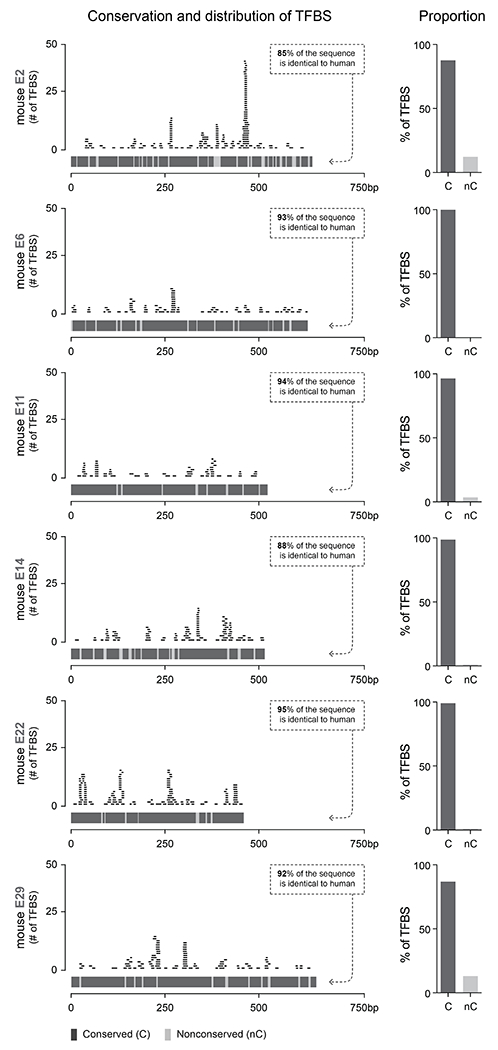
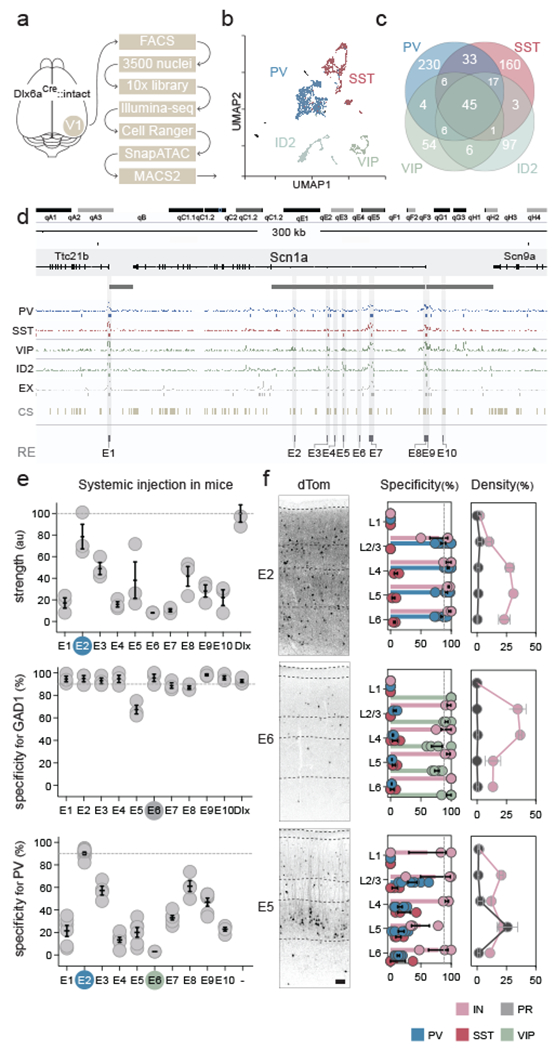
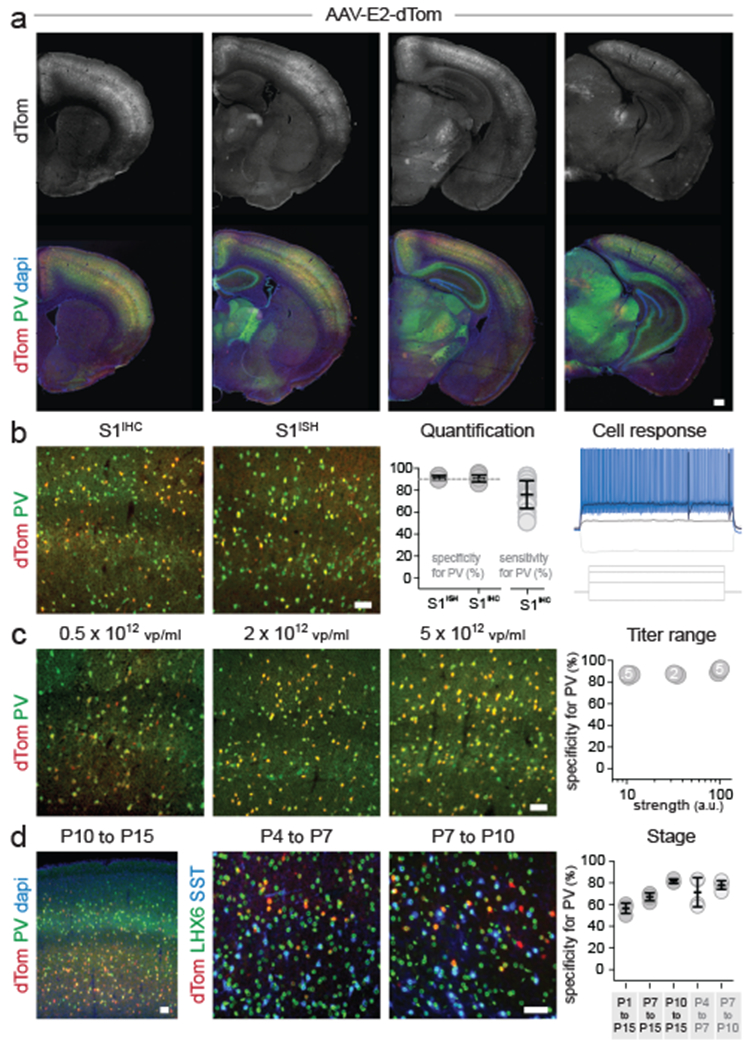
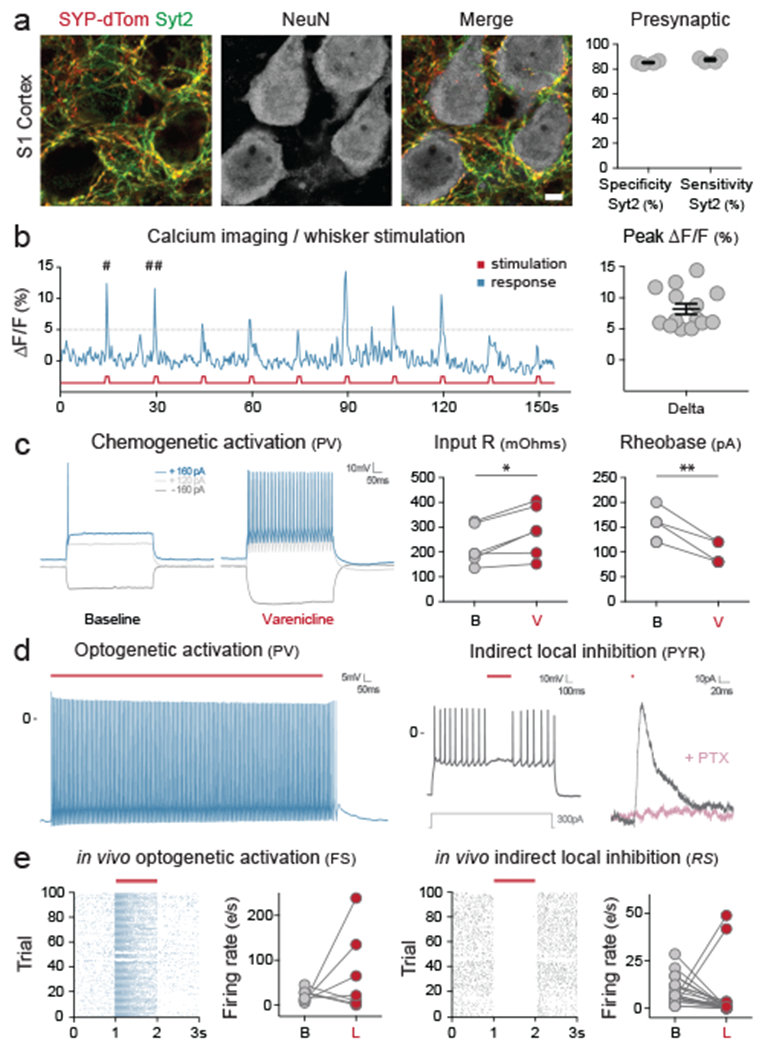
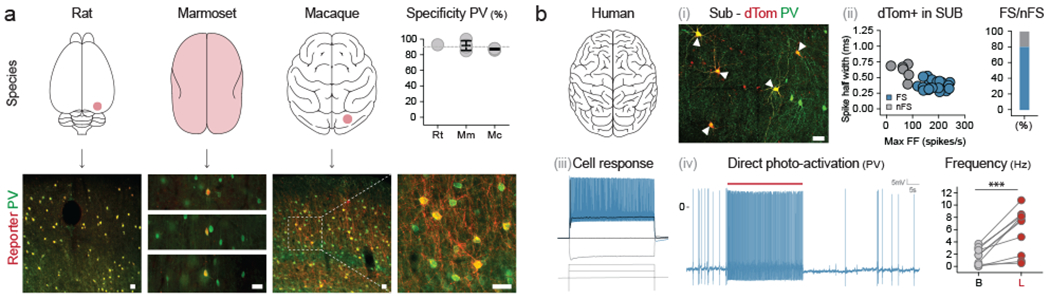
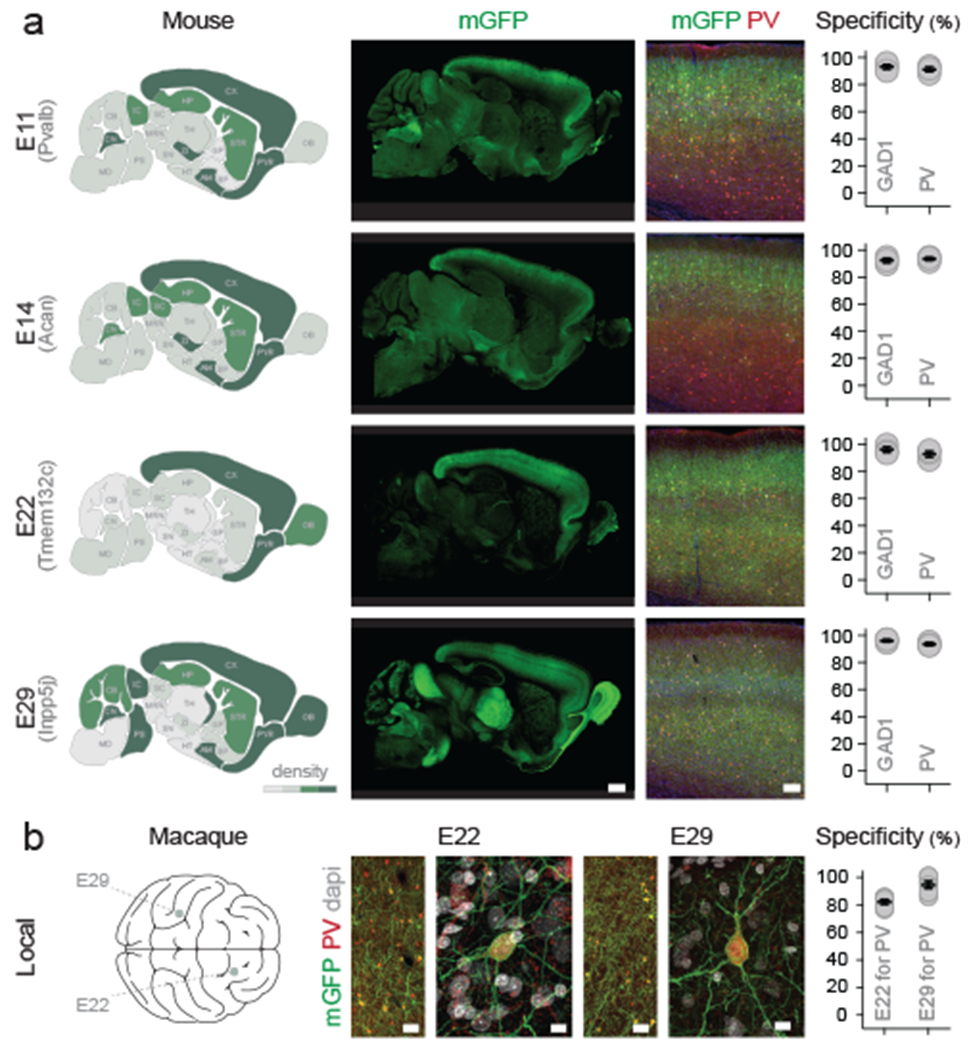
Recent success in identifying gene-regulatory elements in the context of recombinant adeno-associated virus vectors has enabled cell-type-restricted gene expression. However, within the cerebral cortex these tools are largely limited to broad classes of neurons. To overcome this limitation, we developed a strategy that led to the identification of multiple new enhancers to target functionally distinct neuronal subtypes. By investigating the regulatory landscape of the disease gene Scn1a, we discovered enhancers selective for parvalbumin (PV) and vasoactive intestinal peptide-expressing interneurons. Demonstrating the functional utility of these elements, we show that the PV-specific enhancer allowed for the selective targeting and manipulation of these neurons across vertebrate species, including humans. Finally, we demonstrate that our selection method is generalizable and characterizes additional PV-specific enhancers with exquisite specificity within distinct brain regions. Altogether, these viral tools can be used for cell-type-specific circuit manipulation and hold considerable promise for use in therapeutic interventions.


Conflict of interest statement

COMPETING INTEREST STATEMENT

The authors declare competing financial interests: The Broad Institute of MIT and Harvard has filed patent applications related to this work with Gord Fishell and Jordane Dimidschstein listed as inventors.

Figures

Extended Data Fig. 1
Extended Data Fig. 1. Enhancer selection and top candidates
(a) UMAP plot of 3500 neuronal nuclei collected from 4 Dlx6a-cre::Sun1-eGFP mice showing promoter accessibility of the indicated canonical interneuron markers. (b) Fluorescent images of sagittal sections from adult mice that were injected systemically with the indicated rAAV-E[x]-dTom and analyzed 3 weeks post-injection with IHC for the viral reporter. Scale bar for left panels represents 500um; Scale bar for right panels represents 100um. See method section for details on the reproducibility of the representative images presented in panel b.
Extended Data Fig. 2
Extended Data Fig. 2. E2 regulatory element to drive expression of reporters
Adult mice were injected systemically with rAAV-E2-dTomato. (a,b) Slice recording of the intrinsic properties of virally labeled neurons in S1 cortex and PFC. The left panels show plots of recorded cells with the indicated intrinsic properties. The blue dots represent cells with stereotypical fast-spiking properties. The right panels indicate the proportion of fast spiking cells recorded. (c) Representative slice recording traces of cells indicated in (b). (d) Representative image of virally labeled chandelier cells. (e) Coronal and sagittal sections were analyzed with IHC for the viral reporter and PV, and the specificity to PV was reported across brain regions. (f) The native viral expression was analyzed from the indicated organs. Scale bars represent 50um (d), 100um (e) and 250um (f). On the graphs, dots represent individual measurements and the lines represent average +/− s.e.m. Values for specificity are listed in the supplementary table 2. See method section for details on the reproducibility of the representative images presented in panel d and f.
Extended Data Fig. 3
Extended Data Fig. 3. E2 regulatory element to drive expression of effectors
Mice were injected locally with the following constructs (a - P14 injection with rAAV-E2-GCaMP6f; b – rAAV-E2-C1V1-eYFP; c – rAAV-E2-GqDREADD). (a) Mice were analyzed 1-week post-injection. The left panel shows widefield images of two representative peaks shown by the pound signs in figure 3. The right panel shows a fluorescent image taken after GCaMP recordings. (b) Slice electrophysiology current clamp recordings were performed 1-week post-injection. Cells expressing the viral reporter were targeted with either 10Hz or 40Hz laser stimulation (550nm) while the voltage was recorded over 3 seconds. (c) Slice electrophysiology current clamp recordings were performed 1-week post-injection. The voltage was recorded before and after bath application of CNO. Scale bars represent 500um. The red bars represent laser stimulation. On the graphs, dots represent individual measurements. c right panel: p-value = 0.0039; t = 3.859; df = 9; c right panel: p-value = 0.0258; t = 3.135; df = 5); *, ** and *** correspond to a p-value < 0.01, <0,001 and < 0,0001 respectively. See method section for details on the reproducibility of the representative images presented in panel a.
Extended Data Fig. 4
Extended Data Fig. 4. E2 regulatory element works across species
(a) Human brain tissue obtained from surgical resection that was exposed to rAAV-E2-dTomato and maintained in culture for 7-14 days. Left - Representative image of the dendrites of virally labeled cells filled with Biocytin during the recording session. Right - Slice recording of the intrinsic properties of virally labeled neurons. The quantifications show the indicated parameters. Scale bars represent 100um for the left images and 2um for the right images. (b) Adult mice were injected with the indicated modified rAAV-E2-dTomato construct and analyzed 3 weeks post-injection with IHC for the viral reporter and PV. The corresponding specificity is shown in the right panel. Scale bars represent 100um. On the graphs, dots represent individual measurements and the lines represent average +/− s.e.m. Values for specificity are listed in the supplementary table 2.
Extended Data Fig. 5
Extended Data Fig. 5. Enhancer screen applied to additional genes.
Adult macaques were injected locally in the prefrontal or S1 cortex with the indicated rAAV-E[x]-eGFP and analyzed 8 weeks post-injection with immunohistochemistry for the reporter and indicated markers. The right panels display the injection sites (above), and the boxed quantified regions (below). The corresponding sensitivity is shown in the bottom left. Scale bars represent 25um (lower panels) and 50um (upper panels). On the graphs, dots represent individual measurements and the lines represent average +/− s.e.m. Values for sensitivity are listed in the supplementary table 2.
Extended Data Fig. 6
Extended Data Fig. 6. Transcription factor binding site enrichment.
Each panel shows the indicated enhancer sequence displayed on a fixed region of 750bp, where each block of the lower part of the left graph shows conserved (dark gray) and non-conserved (light gray) regions of the enhancer. On the upper part of the left graph, each trace shows an individual transcription factor binding site mapped using CiiiDER (see methods). The blue traces represent TFBS found only in mice and the orange traces represent the TFBS found both in mice and humans. The two bar charts show the proportion of the TFBS found either on conserved or non-conserved regions of the enhancer, for all TFBS and for the subset of conserved TFBS, respectively.
Figure 1.
Figure 1.. Identification of Scn1a enhancers.
(a) Schematic representation of the scATAC-seq pipeline. Interneurons were collected from the visual cortex of adult Dlx6a-cre::Sun1-eGFP mice. (b) Plot of the 3500 nuclei in UMAP space. The clusters obtained from the SnapATAC pipeline were lumped into the four cardinal classes of interneuron. (c) Venn diagram showing the number of unique and shared peaks (in thousands) across the four interneuron populations. (d) Schematic representation of the enhancer selection method at the Scn1a locus (see methods section for complete description). (e, f). Adult mice were injected systemically with the indicated rAAV-E[x]-dTomato and analyzed 3 weeks post-injection. IHC for the reporter and indicated markers in the S1 cortex was used to assess the strength of expression of the reporter (e - upper panel) and the specificity of expression of the viral reporter for the indicated markers (all other panels). Representative fluorescent images of the indicated viral reporter in the somatosensory cortex (f left panels). Dashed lines represent the limits of anatomical structures. Scale bars represent 50um. On the graphs, the dots represent individual measurements and the lines represent average +/− s.e.m. Values for specificity, sensitivity and strength are listed in the supplementary table 2.
Figure 2.
Figure 2.. Viral targeting of PV cINs in mice.
Adult mice were injected systemically (a,b) or locally (c) with rAAV-E2-dTomato and analyzed 3 weeks post-injection (systemic) or 1 week post-injection (local) by IHC or ISH for both the reporter and PV. Slice recording of the intrinsic properties of virally labeled neurons (b - right panel) See method section for details on the reproducibility of the representative images presented in panel a. (d) Mice were injected locally with rAAV-E2-dTomato and analyzed at the indicated developmental stages for the reporter and the indicated markers. Scale bars represent 250um (a) and 50um (b-d). On the graphs, the dots represent individual measurements and the lines represent average +/− s.e.m. Values for specificity, sensitivity and strength are listed in the supplementary table 2.
Figure 3.
Figure 3.. Viral monitoring and manipulation of PV cINs in mice.
Mice were injected locally in the S1 cortex (a – P10 local injection with rAAV-E2-SYP-dTomato; b – P14 local injection with rAAV-E2-GCaMP6f; d, e – Adult local injection with rAAV-E2-C1V1-eYFP) or systemically (c – Adult systemic injection with rAAV-E2-PSAM4-5HT3-LC-GFP). (a) Representative images of the co-localization between the SYP-dTomato reporter and the synaptic marker Syt2 one-week post-injection and corresponding quantification. See method section for details on the reproducibility of the representative images presented in panel a. (b) Ca2+ imaging upon whisker stimulation was performed 2-3 weeks post-injection. The pound signs points at two peaks for which the widefield images are shown in extended data figure 3a. On the right panel, the success rate was calculated as the proportions of ΔF/F peaks above threshold in response to whisker stimulation. (c) Current clamp recording was performed on brain sections 4 weeks after injection. The traces show a representative cellular response at the indicated currents at both baseline and after bath application of varenicline. Left panel: p-value = 0.0616; t = 3.564; df = 5; *, ** and *** correspond to a p-value < 0.01, <0,001 and < 0,0001 respectively. Right panel: p-value = 0.0015; t = 6.325; df = 5; *, ** and *** correspond to a p-value < 0.01, <0,001 and < 0,0001 respectively. (d) Current clamp recording was performed on brain sections 2 weeks after injection. Cells expressing the viral reporter were exposed to 2 seconds of constant laser stimulation (550nm) while the voltage was recorded over 3 seconds. Neighboring pyramidal cells that did not express the viral reporter were also recorded from during laser stimulation. (e) In-vivo single-unit analysis of neuronal activity. Raster plots of virally infected neurons upon laser stimulation and corresponding population quantification data. The left panels show fast-spiking cells and the right panels show regular spiking excitatory cells. Notably, due to the mosaic nature of local viral injection, individual cell responses were bimodal. This presumably reflects whether or not particular cells were infected. Scale bars represent 5um. The red bars represent laser stimulation. On the graphs, dots represent individual measurements and the lines represent average +/− s.e.m. Values for specificity and sensitivity are listed in the supplementary table 2.
Figure 4.
Figure 4.. Viral targeting and manipulation of PV cINs in primates including humans.
(a) Animals from indicated species were locally (rat and macaque) or systemically (marmoset) injected with rAAV-E2-C1V1-eYFP (macaque) or rAAV-E2-dTomato (rat and marmoset) and analyzed 2-8 weeks post-injection. See method section for details on the reproducibility of the representative images presented in panel a. (b) Human brain tissue obtained from surgical resection was exposed to either rAAV-E2-dTomato (i-iii) or rAAV-E2-C1V1-eYFP. See method section for details on the reproducibility of the representative images presented in panel b (i). (iv) and maintained in culture for 7-14 days. The p-value = 0.008; t = 4.899; df = 9; *, ** and *** correspond to a p-value < 0.01, <0,001 and < 0,0001 respectively. The upper right panel (ii) shows the proportion of fast-spiking neurons among the virally labeled cells assessed by electrophysiological recordings of intrinsic properties. (iii) Representative trace from a neuron recorded in (ii). (iv) Electrophysiology current clamp recording of virally labeled cells upon laser stimulation. Scale bars represent 50um. The red bars represent laser stimulation and the arrowheads point at neurons co-expressing PV and the viral reporter. On the graphs, dots represent individual measurements and the lines represent average +/− s.e.m. Values for specificity are listed in the supplementary table 2.
Figure 5.
Figure 5.. Identification of viral enhancers with regional specificity.
(a) Adult mice were injected systemically with the indicated rAAV-E[x]-mGFP and analyzed 3 weeks post-injection. IHC for the reporter and indicated markers in the S1 cortex was used to assess the density of neuronal cell-bodies expressing the viral reporter (left panels) and the specificity of expression of the viral reporter for the indicated markers (right panels). Note that for the E29 virus, there are no cell bodies in the thalamus at the exception of the TRN. (b) One adult macaque was injected in PFC with rAAV-E22-eGFP and another in S1 with AAV-E29-eGFP. Both animals were analyzed 8 weeks post-injection with immunohistochemistry for the reporter and indicated markers. Scale bars represent 100um (a), 50um (b left) and 10um (b right). On the graphs, dots represent individual measurements and the lines represent average +/− s.e.m. Values for specificity are listed in the supplementary table 2.

Comment in

References

    1. Skene NG et al. Genetic identification of brain cell types underlying schizophrenia. Nat. Genet 50, 825–833 (2018). - PMC - PubMed
    1. Voineagu I et al. Transcriptomic analysis of autistic brain reveals convergent molecular pathology. Nature 474, 380–384 (2011). - PMC - PubMed
    1. Parikshak NN et al. Integrative functional genomic analyses implicate specific molecular pathways and circuits in autism. Cell 155, 1008–1021 (2013). - PMC - PubMed
    1. Camp JG, Platt R & Treutlein B Mapping human cell phenotypes to genotypes with single-cell genomics. Science 365, 1401–1405 (2019). - PubMed
    1. Bedbrook CN, Deverman BE & Gradinaru V Viral Strategies for Targeting the Central and Peripheral Nervous Systems. Annu. Rev. Neurosci 41, 323–348 (2018). - PubMed

Publication types

Substances