. 2020 Oct;23(10):1215-1228.
doi: 10.1038/s41593-020-0689-4. Epub 2020 Aug 17.

A glycolytic shift in Schwann cells supports injured axons

Affiliations

A glycolytic shift in Schwann cells supports injured axons

Elisabetta Babetto et al. Nat Neurosci. 2020 Oct.

Erratum in

Abstract

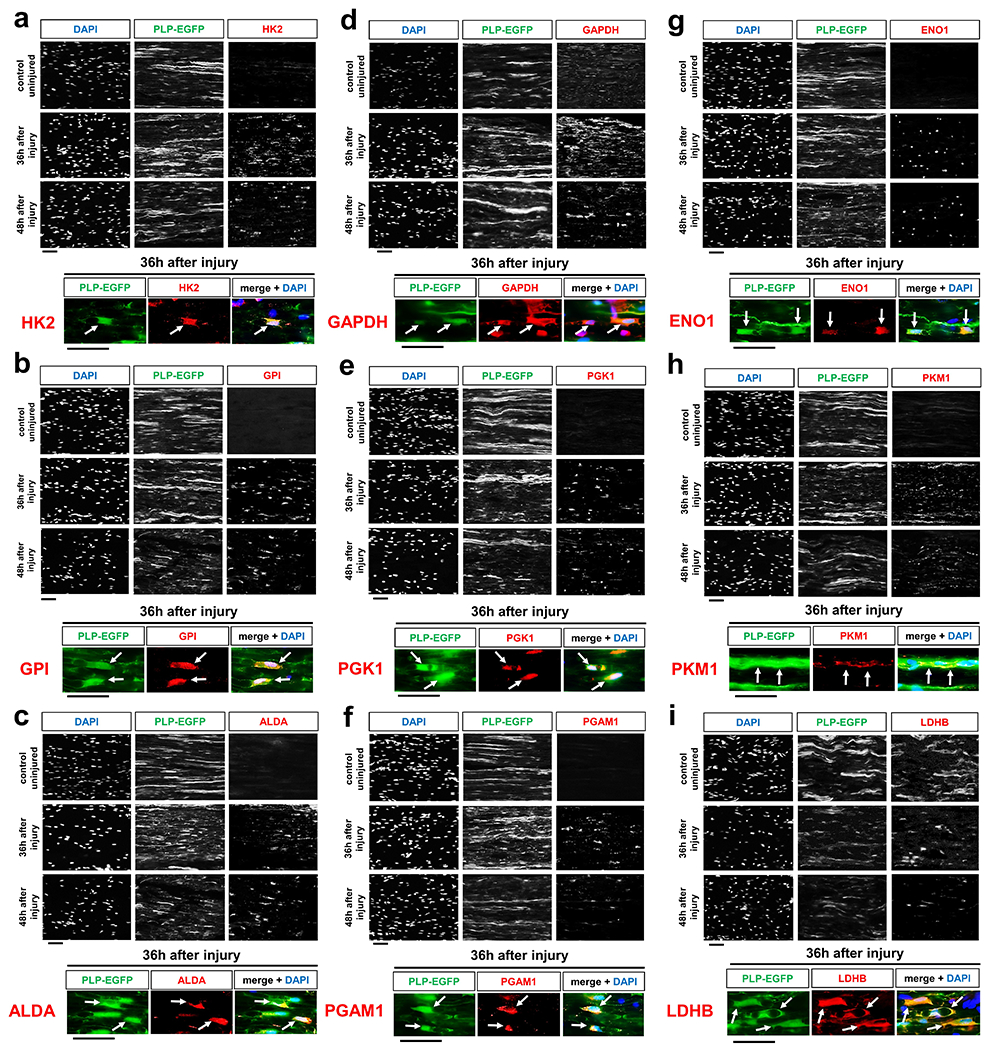
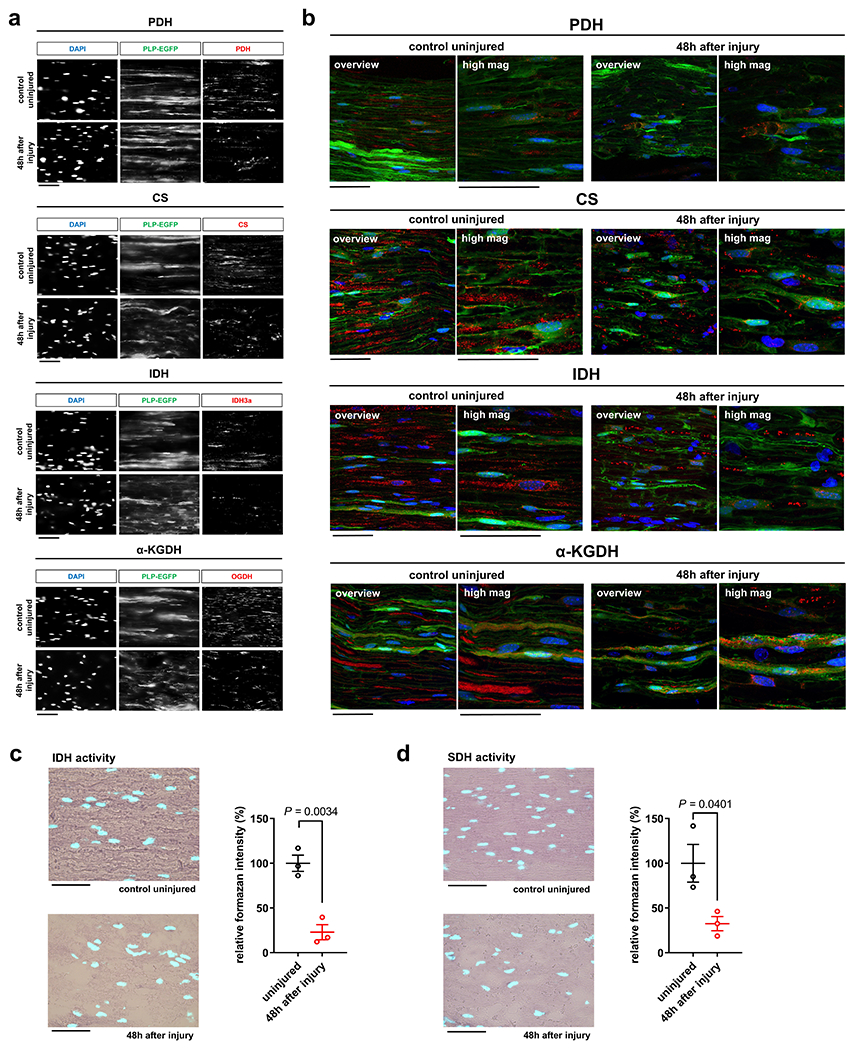
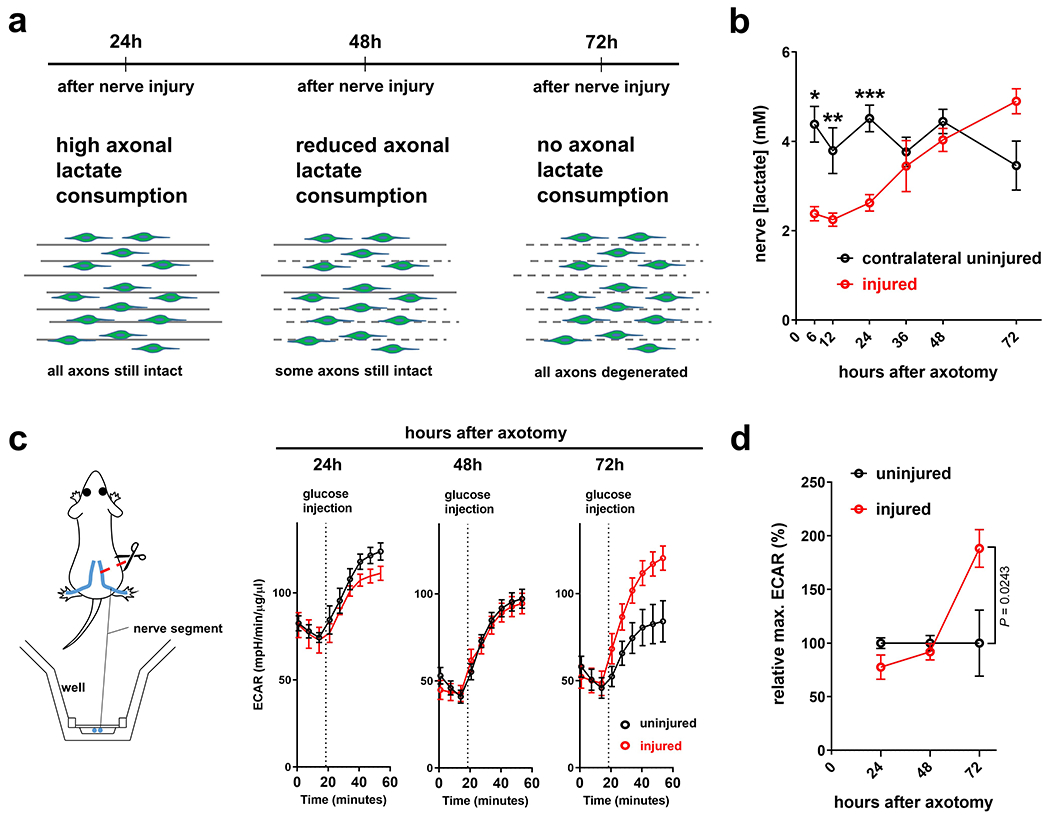
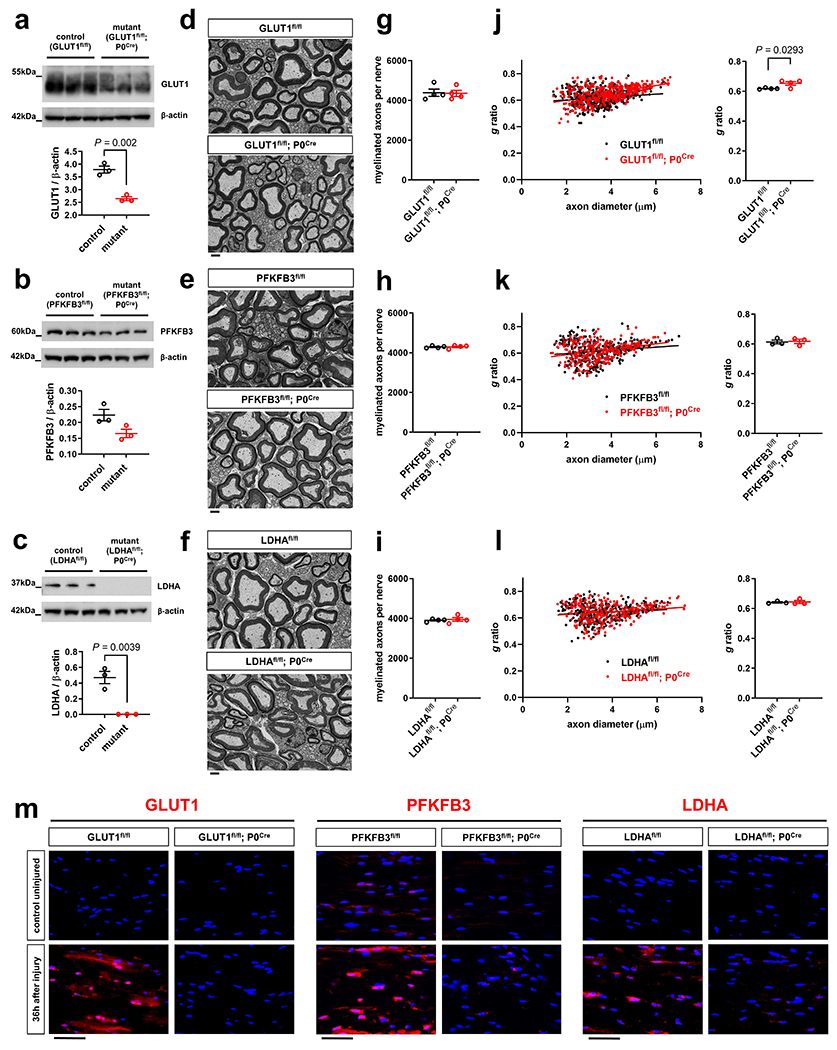
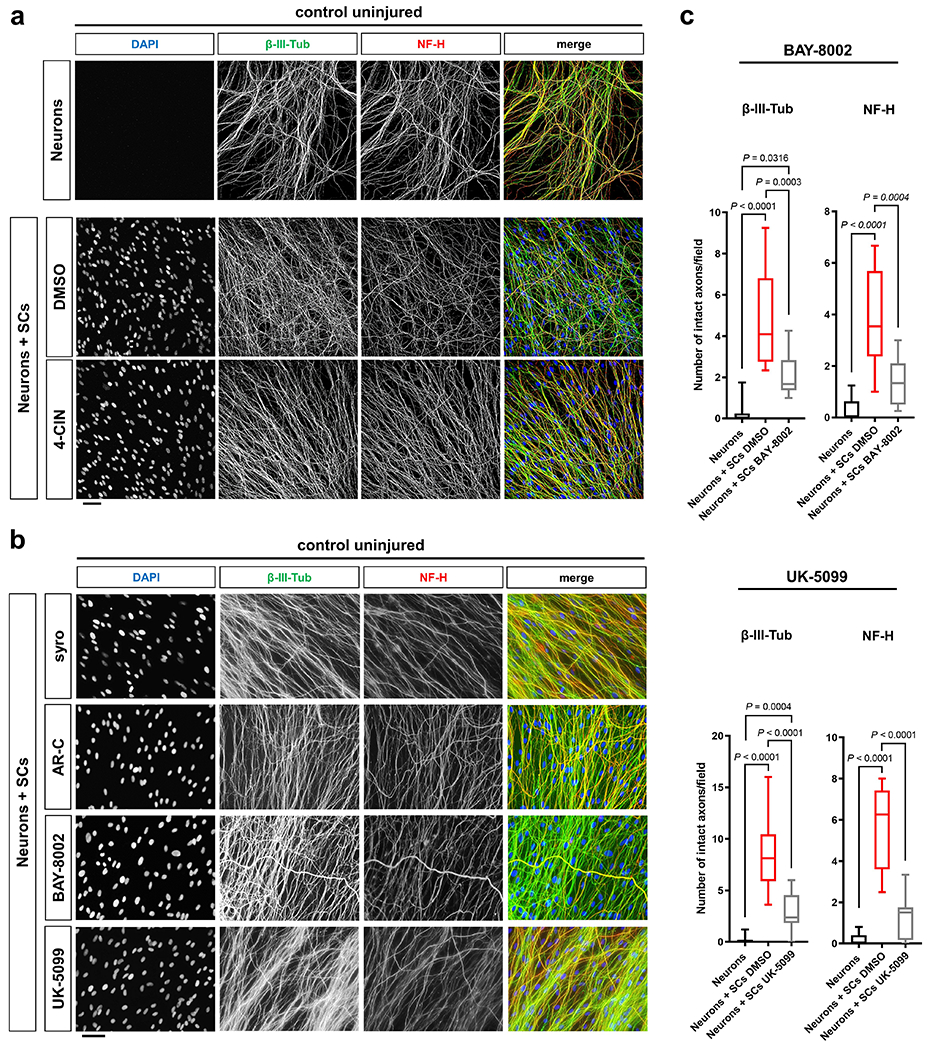
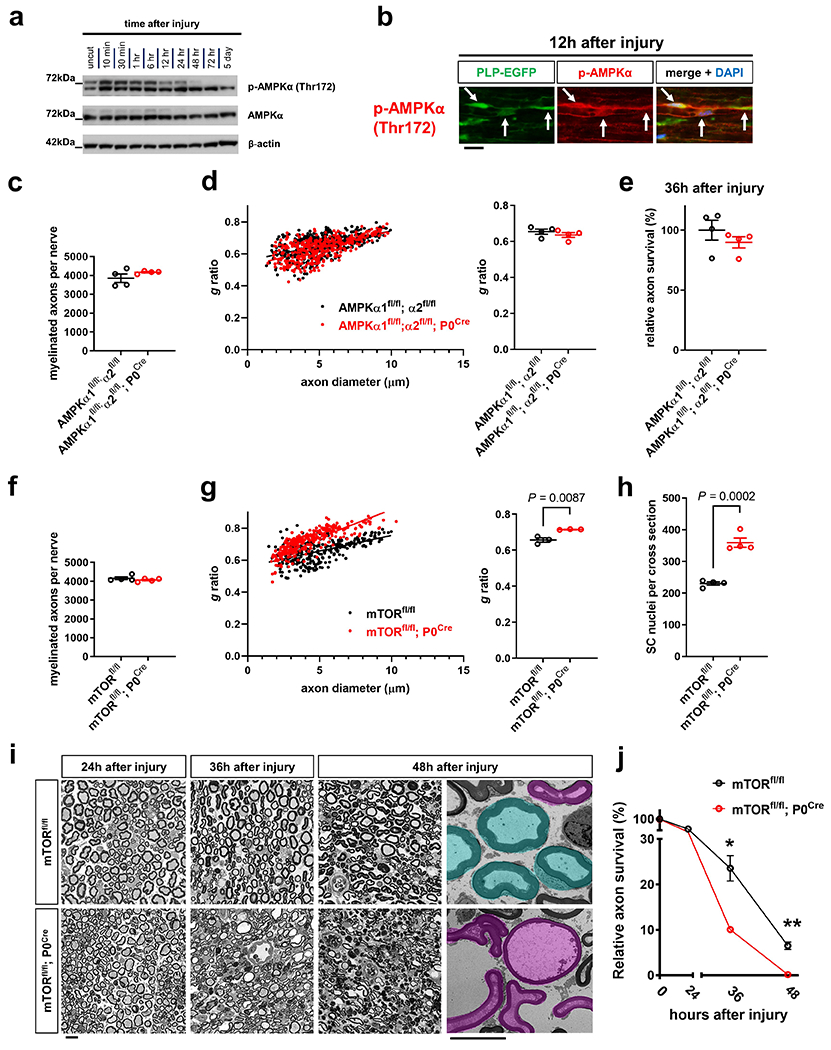
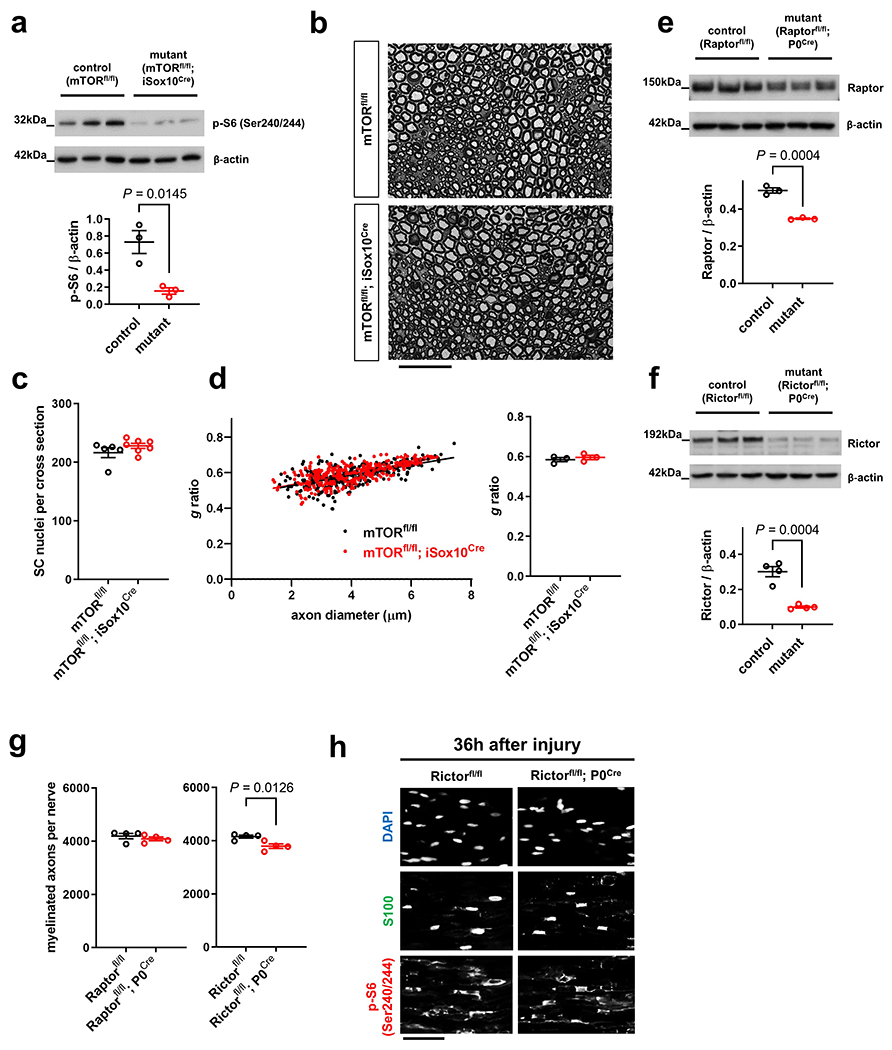
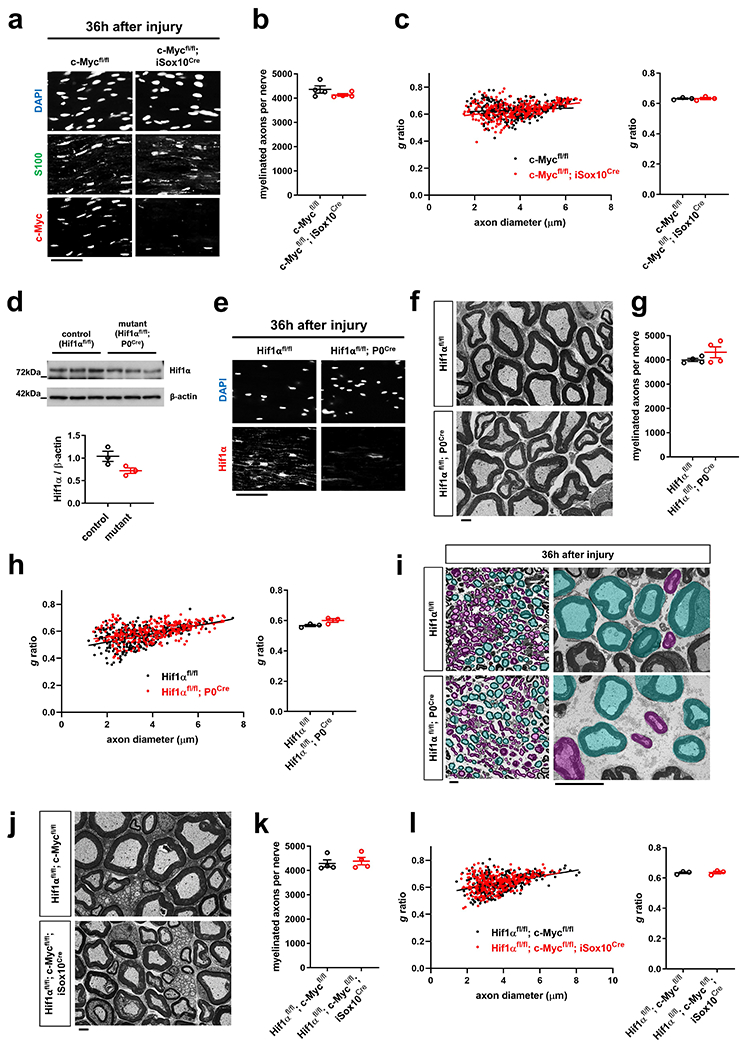
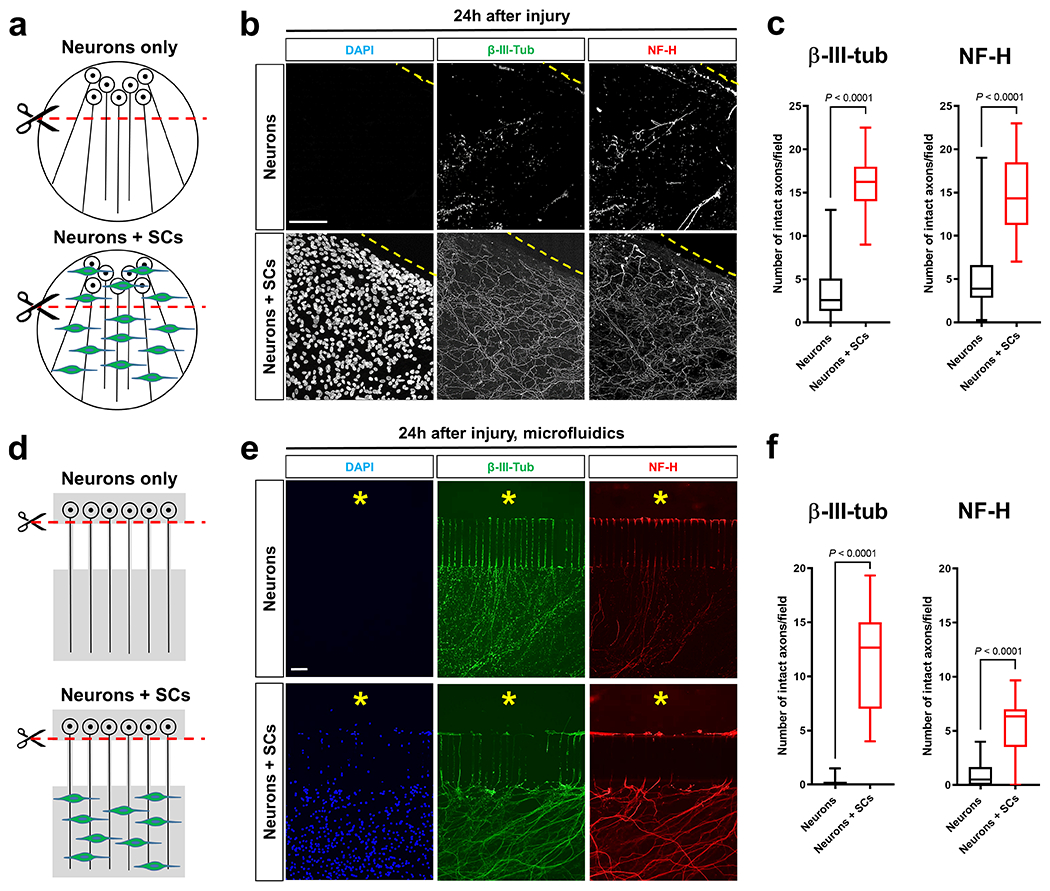
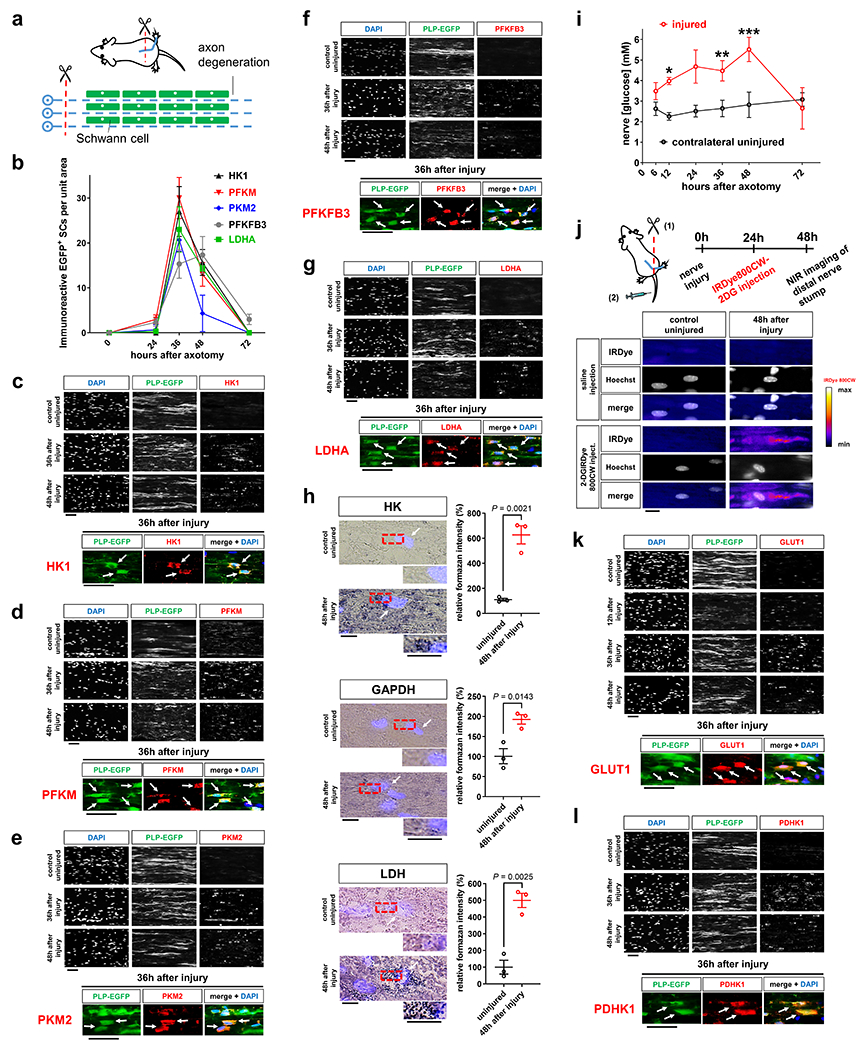
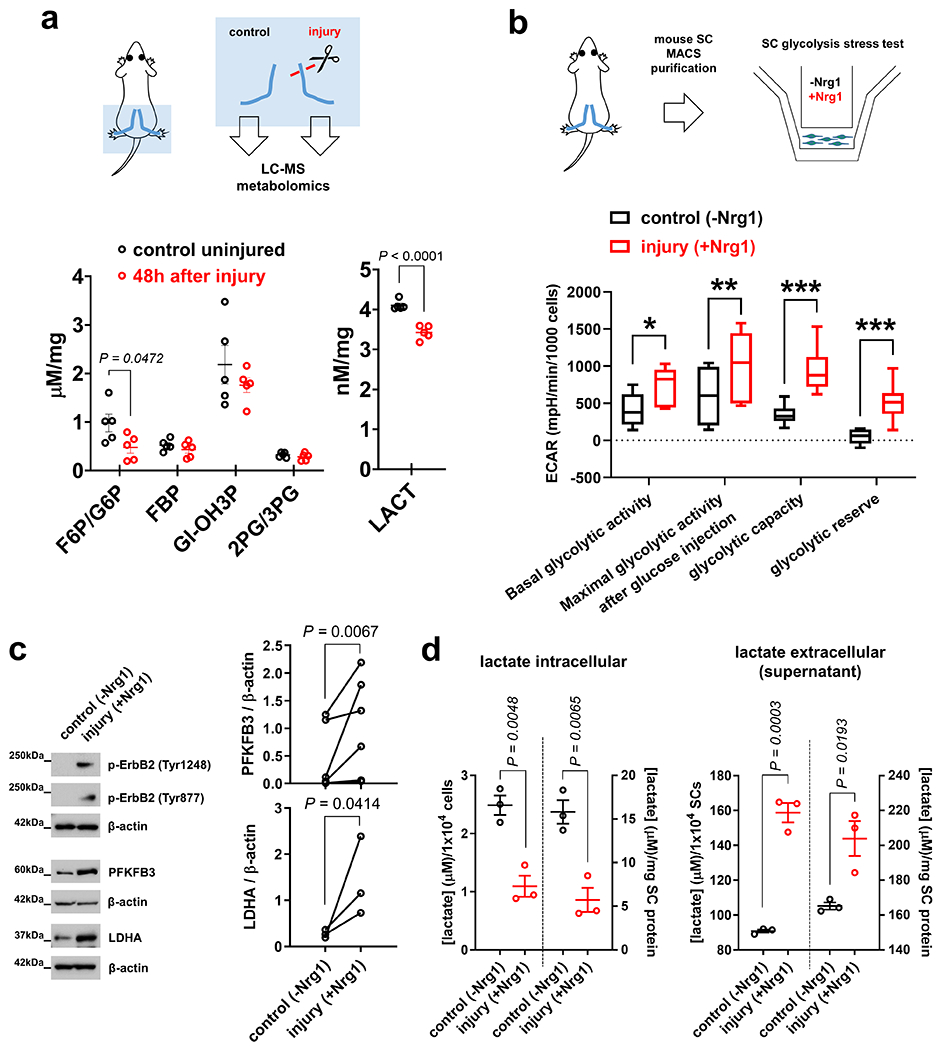
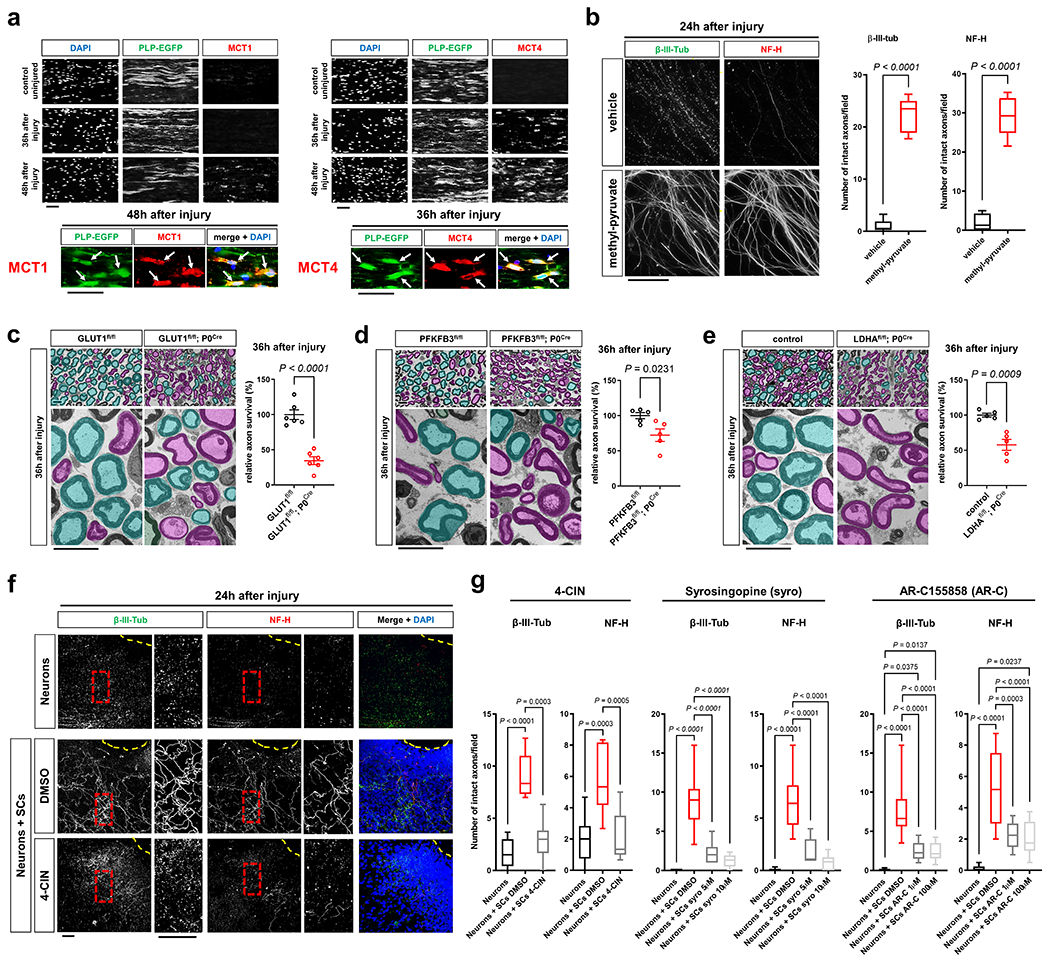
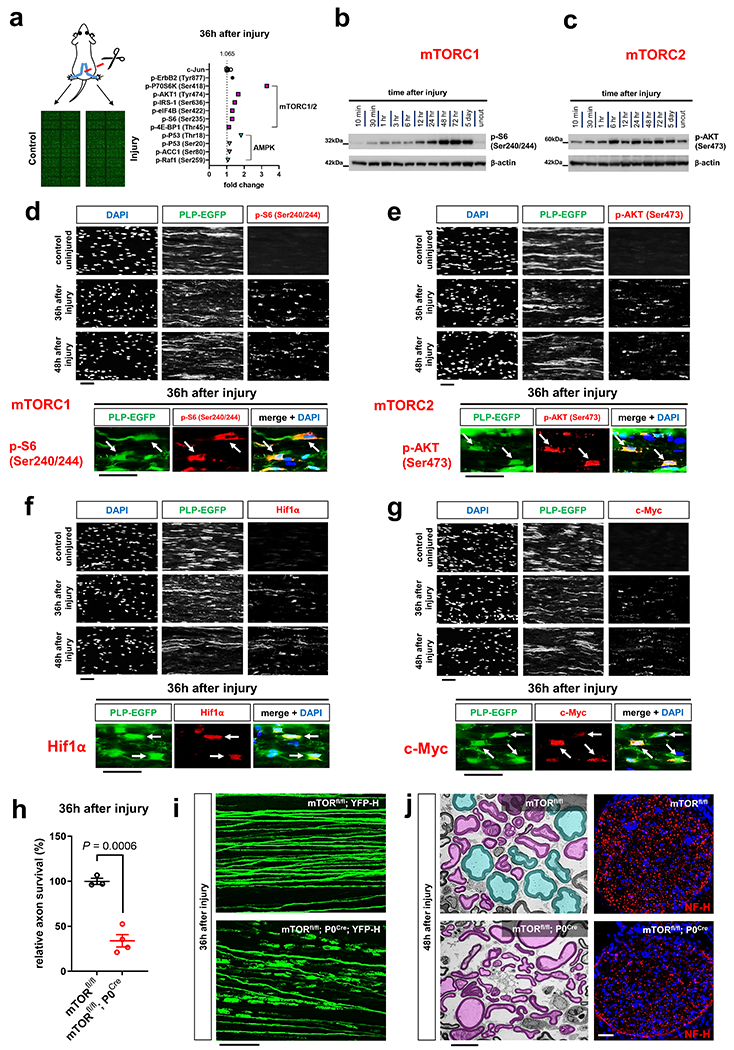
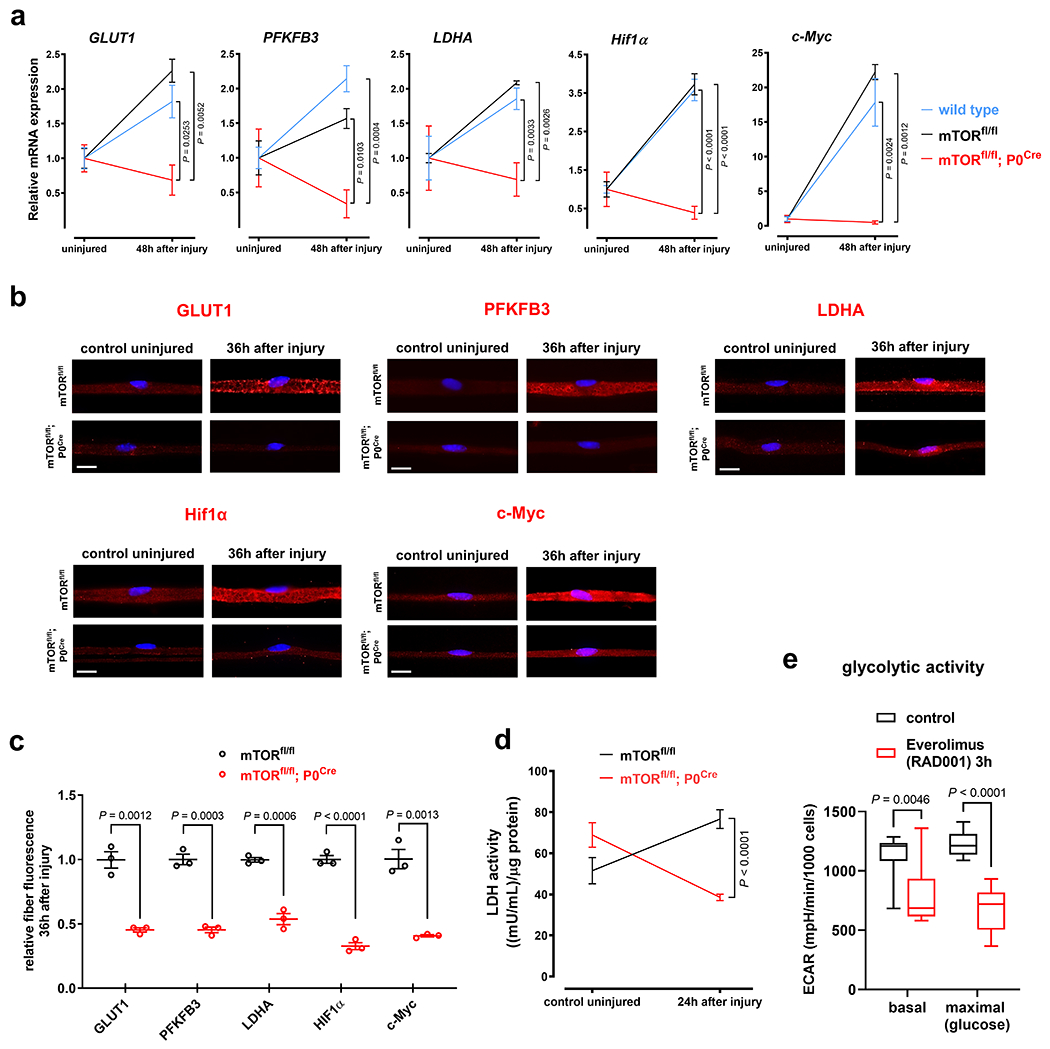
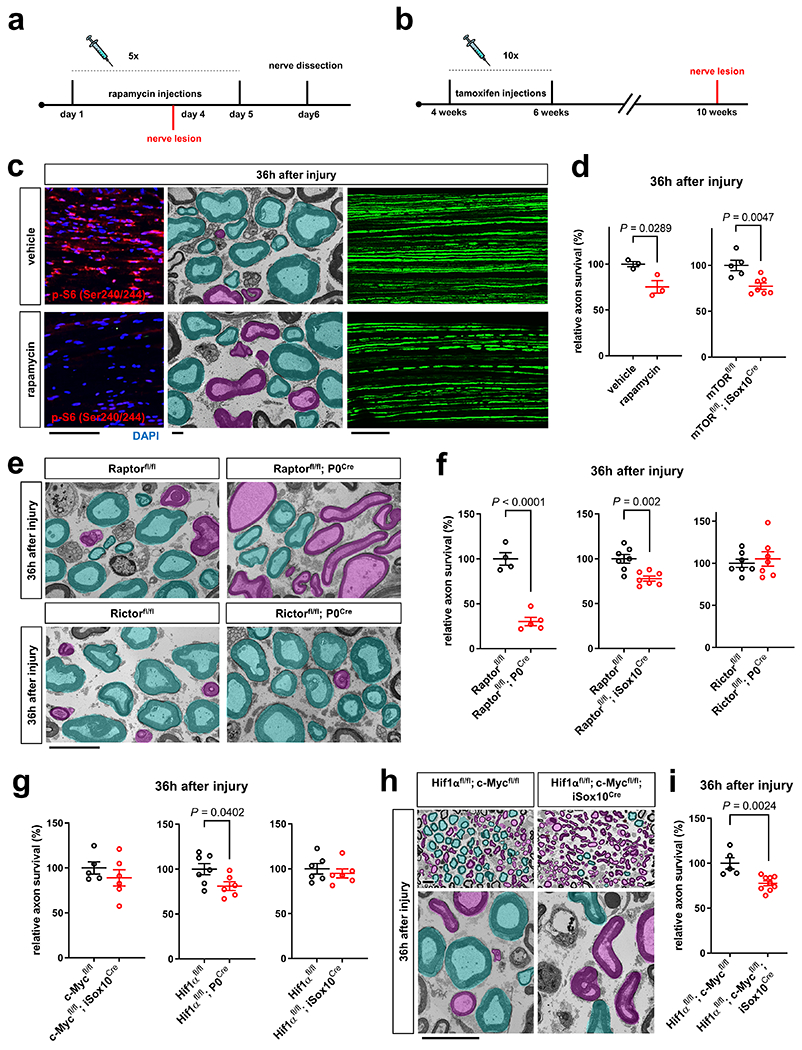
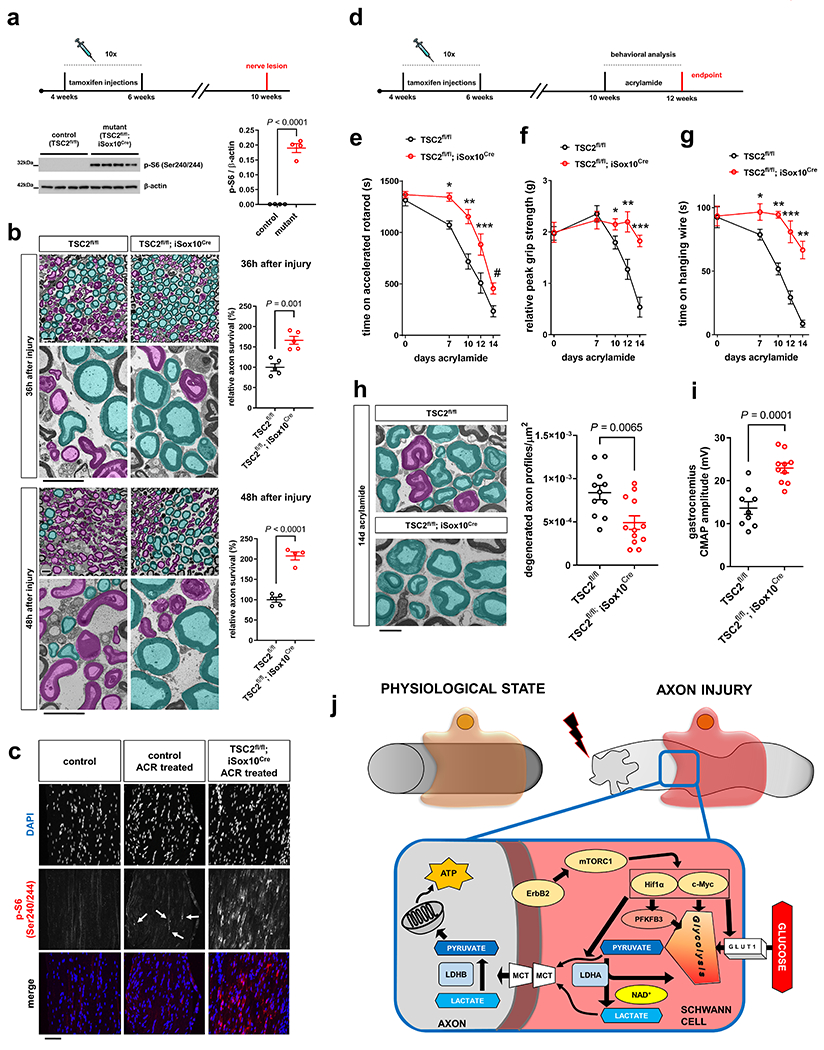
Axon degeneration is a hallmark of many neurodegenerative disorders. The current assumption is that the decision of injured axons to degenerate is cell-autonomously regulated. Here we show that Schwann cells (SCs), the glia of the peripheral nervous system, protect injured axons by virtue of a dramatic glycolytic upregulation that arises in SCs as an inherent adaptation to axon injury. This glycolytic response, paired with enhanced axon-glia metabolic coupling, supports the survival of axons. The glycolytic shift in SCs is largely driven by the metabolic signaling hub, mammalian target of rapamycin complex 1, and the downstream transcription factors hypoxia-inducible factor 1-alpha and c-Myc, which together promote glycolytic gene expression. The manipulation of glial glycolytic activity through this pathway enabled us to accelerate or delay the degeneration of perturbed axons in acute and subacute rodent axon degeneration models. Thus, we demonstrate a non-cell-autonomous metabolic mechanism that controls the fate of injured axons.


Conflict of interest statement

Competing Interests Statement

The authors declare no competing interests as defined by Nature Research, or other interests that might be perceived to influence the results and/or discussion reported in this paper.

Figures

Extended Data Fig. 1
Extended Data Fig. 1. Glycolytic and fermentative enzyme expression in SCs after nerve injury.
a-i, Representative immunofluorescence for the indicated metabolic components on longitudinal frozen sections from uninjured control nerve segments and axotomized distal sciatic nerve stumps at the shown post-injury times. HK2: Hexokinase 2 (a). GPI: Glucose-6-phosphate isomerase (b). ALDA: Aldolase A (c). GAPDH: Glyceraldehyde-3-phosphate dehydrogenase (d). PGK1: Phosphoglycerate kinase 1 (e). PGAM1: Phosphoglycerate mutase 1 (f). ENO1: Enolase 1 (g). PKM1: Pyruvate kinase M1 (h). LDHB: Lactate dehydrogenase B (i). Arrows depict colocalization in SCs. Scale bars: 50μm. The experiments for each component were reproduced three times independently with similar results.
Extended Data Fig. 2
Extended Data Fig. 2. Enzymes driving mitochondrial glucose catabolism in SCs are not upregulated upon nerve lesion.
a, b, Representative immunofluorescence using wide-field fluorescence microscopy (a) and confocal microscopy (b, merged z-projections) for the indicated mitochondrial enzymes on longitudinal frozen sections from uninjured control nerve segments and axotomized distal sciatic nerve stumps at the shown post-injury times. PDH: Pyruvate dehydrogenase complex. CS: Citrate synthase. IDH/IDH3a: Isocitrate dehydrogenase catalytic subunit α. α-KGDH/OGDH: Alpha-ketoglutarate dehydrogenase also known as 2-oxoglutarate dehydrogenase E1 component, mitochondrial. Note prominent CS, IDH, and α-KGDH axonal staining in uninjured control nerves, in addition to the SC-derived signals. The axonal staining weakens in injured preparations due to AxD. Red: respective mitochondrial enzyme. Green: PLP-EGFP. Blue: DAPI. Scale bars: 50μm (a), 100μm (b). The experiments for each mitochondrial enzyme were reproduced three times independently with similar results. c, d, Left: Representative images of longitudinal sections from uninjured control nerve segments and axotomized distal sciatic nerve stumps stained for the activity of isocitrate dehydrogenase (IDH, c) and succinate dehydrogenase (SDH, d) (formazan formation) with superimposition of DAPI signals (cyan). Scale bars: 50μm. Right: Densitometric quantification of formazan intensity representing IDH or SDH enzyme activity, respectively, on nerve sections. Note markedly reduced IDH and SDH enzyme activities following nerve injury, in contrast to increased glycolytic enzyme activities (Error bars represent s.e.m. n=3 mice for each graph). Statistical evaluation in c and d was performed using Student’s t-test, unpaired, two-tailed.
Extended Data Fig. 3
Extended Data Fig. 3. Nerve lactate metabolism following nerve injury.
a, Model for axonal consumption of lactate released by SCs in the nerve stump distal to site of axotomy. b, Lactate concentrations in lysates of uninjured control nerve segments and distal sciatic nerve stumps following axotomy (Error bars represent s.e.m. n=3 mice per condition for 6, 12, 24, 36, and 72 hours after axotomy, n=4 mice per condition for 48 hours after axotomy, *P=0.0097, **P=0.0446, ***P=0.0057). c, Left: Scheme for measuring extracellular monocarboxylate release of uninjured and injured peripheral nerve segments by extracellular flux analysis in Seahorse islet capture microplates. Right: ECAR traces of control uninjured and axotomized nerve segments at the indicated post-injury times (Error bars represent s.e.m. n=3 mice for uninjured nerve segments and n=4 mice for injured for 24 hours after axotomy, n=7 mice for uninjured nerve segments and n=8 mice for injured for 48 hours after axotomy, n=9 mice for uninjured and injured nerve segments for 72 hours after axotomy). d, Relative glucose injection–induced maximum ECARs in uninjured control and axotomized nerve segments reflecting extracellular concentrations of glucose-derived monocarboxylates. Note extracellular accumulation of glucose-derived monocarboxylates as AxD proceeds. (Error bars represent s.e.m. n=3 mice for uninjured nerve segments and n=4 mice for injured for 24 hours after axotomy, n=7 mice for uninjured nerve segments and n=8 mice for injured for 48 hours after axotomy, n=9 mice for uninjured and injured nerve segments for 72 hours after axotomy). Statistical evaluation in b and d was performed using multiple Student’s t-test, unpaired, two-tailed.
Extended Data Fig. 4
Extended Data Fig. 4. Conditional mutant mice lacking key glucose metabolism regulators in SCs show overtly normal nerve structure.
a-c, Western blot analysis (cropped blot images) of sciatic nerve lysates from indicated 8-weeks-old control and mutant mice with the indicated genotypes probed with the shown antibodies (Error bars represent s.e.m. n=3 mice per genotype for each graph. Each dot represents measurement from sciatic nerve lysate from one mouse). d-f, Representative electron micrographs of transverse sciatic nerve sections from 8-weeks-old control and mutant mice with the indicated genotypes. Scale bars: 2μm. g-i, Quantification of myelinated axons in sciatic nerves from indicated 8-weeks-old control and mutant mice (Error bars represent s.e.m. n=4 mice per genotype for each graph). j-l, Quantification of g ratios (left: scatter plots show g ratios of individual myelinated axons as function of axon diameter, right: corresponding cumulative g ratios per animal) in sciatic nerves from indicated 8-weeks-old control and mutant mice (Error bars represent s.e.m. n=4 mice per genotype for j and n=3 mice per genotype for k, l). m, Representative immunofluorescence for the indicated glycolytic regulators on longitudinal frozen sections from control uninjured nerves and axotomized distal sciatic nerve stumps of mice with the indicated genotypes 36h after nerve transection injury (blue: DAPI). Scale bars: 50μm. The experiments for each glycolytic regulator were reproduced three times independently with similar results. Statistical evaluation in a-c and g-l was performed using Student’s t-test, unpaired, two-tailed.
Extended Data Fig. 5
Extended Data Fig. 5. Additional analysis of MCT inhibitors in co-cultures.
a, b, Representative immunofluorescence (confocal (a) and wide-field fluorescence (b)) microscopy of control uninjured axons under the indicated conditions. Note normal appearance of axon structure after 24h of treatment with the indicated MCT inhibitors. Scale bars: 50μm. The experiments for each condition were reproduced three times independently with similar results. c, Box and whiskers plots (maximum, 25th percentile, median, 75th percentile, minimum) of axon survival 24h following axotomy under the indicated conditions (BAY-8002: β-III-tub and NF-H, Neurons: n=37 DRG neurite preparations, Neurons+SCs DMSO: n=44 DRG neurite preparations, Neurons+SCs BAY-8002: n=38 DRG neurite preparations, all DRG neurite preparations from four experimental sets performed on different days. UK-5099: β-III-tub, Neurons: n=53 DRG neurite preparations, Neurons+SCs DMSO: n=57 DRG neurite preparations, Neurons+SCs UK-5099: n=38 DRG neurite preparations, all DRG neurite preparations from five experimental sets performed on different days (four experimental sets performed on different days for Neurons+SCs UK-5099). NF-H, Neurons: n=53 DRG neurite preparations, Neurons+SCs DMSO: n=49 DRG neurite preparations, Neurons+SCs UK-5099: n=36 DRG neurite preparations, all DRG neurite preparations from five experimental sets performed on different days (four experimental sets performed on different days for Neurons+SCs UK-5099)). Statistical evaluation was performed using One-way-ANOVA and Sidak’s multiple comparisons tests.
Extended Data Fig. 6
Extended Data Fig. 6. Upregulation of AMPK activity in injury-activated SCs, and analysis of nerves from conditional mutant mice lacking AMPK or mTOR activity in SCs.
a, Western blot analysis (cropped blot images) of lysates from uninjured control nerve segments and axotomized distal sciatic nerve stumps from C57Bl/6J mice showing AMPK activity at different times following nerve transection. Note marked AMPK activation as reflected by increased p-AMPKα phosphorylation at Thr172 already 10 min after nerve injury. Individual lanes represent pooled data from at least three mice. b, Representative immunofluorescence for p-AMPKα (Thr172) on longitudinal frozen section from axotomized distal sciatic nerve stump 12h after nerve injury. Arrows depict colocalization in SCs. Scale bar: 20μm. The experiment was reproduced three times independently with similar results. c, f, Quantification of myelinated axons in sciatic nerves from indicated 8-weeks-old control and mutant mice (Error bars represent s.e.m. n=4 mice per genotype for each graph). d, g, Quantification of g ratios (left: scatter plots show g ratios of individual myelinated axons as function of axon diameter, right: corresponding cumulative g ratios per animal) in sciatic nerves from indicated 8-weeks-old control and mutant mice (Error bars represent s.e.m. n=4 mice per genotype for d and n=3 mice per genotype for g). e, Quantitative analysis of relative axon survival in distal sciatic nerve stumps 36h after axotomy in mice with the indicated genotypes (Error bars represent s.e.m. n=4 mice per genotype). h, Quantification of SC nuclei in sciatic nerve cross sections in 8-weeks-old mice with the indicated genotypes (Error bars represent s.e.m. n=4 mice per genotype). i-j, Representative semithin and electron micrographs (last panel with pseudocoloring) of transverse sciatic nerve sections of distal nerve stumps from mice with the indicated genotypes at different time points after sciatic nerve transection (i) with corresponding quantifications of relative axon survival (j). Electron micrographs show pseudocoloring of intact (turquoise) and degenerated (magenta) myelinated fibers. Note accelerated AxD in the mTORfl/fl; P0Cre mutants (Error bars represent s.e.m. n=3 mice for mTORfl/fl for 0 and 36 hours after axotomy, n=4 mice for mTORfl/fl for 24 and 48 hours after axotomy, n=3 mice for mTORfl/fl; P0Cre for 0 hours after axotomy, n=4 mice for mTORfl/fl; P0Cre for 24 and 36 hours after axotomy, n=6 mice for mTORfl/fl; P0Cre for 48 hours after axotomy, *P=0.003, ** P<0.0001). Scale bars: 10μm. Statistical evaluation in c-h was performed using Student’s t-test, unpaired, two-tailed, and in j using multiple Student’s t-test, unpaired, two-tailed.
Extended Data Fig. 7
Extended Data Fig. 7. Analysis of nerves from mutant mice lacking key mTOR components in SCs.
a, Western blot mTORC1 activity (reflected by S6 phosphorylation at Ser240/244) analysis of sciatic nerve lysates (cropped blot images) from control and mTORfl/fl; iSox10Cre mice (30 days after last tamoxifen administration) probed with the indicated antibodies (Error bars represent s.e.m. n=3 mice per genotype. Each dot represents measurement from sciatic nerve lysate from one mouse). b, Representative semithin micrographs of transverse sciatic nerve sections from 12-weeks-old control and mTORfl/fl; iSox10Cre mice 30 days following last tamoxifen administration. Note indistinguishable nerve structure between control and mutant mice. Scale bar: 50μm. c, Quantification of SC nuclei in sciatic nerve cross sections from mice with the indicated genotypes 30 days following tamoxifen administration (Error bars represent s.e.m. n=5 mice for mTORfl/fl and n=7 mice for mTORfl/fl; iSox10Cre). d, Quantification of g ratios (left: scatter plots show g ratios of individual myelinated axons as function of axon diameter, right: corresponding cumulative g ratios per animal) in sciatic nerves from mice with the indicated genotypes 30 days following tamoxifen administration (Error bars represent s.e.m. n=3 mice per genotype). e, f, Western blot analysis (cropped blot images) of sciatic nerve lysates from indicated control and mutant mice (age 5 days in e and 8 weeks in f) probed with the shown antibodies (Error bars represent s.e.m. n=3 mice per genotype in e and n=4 mice per genotype in f. Each dot represents measurement from sciatic nerve lysate from one mouse). g, Quantification of myelinated axons in sciatic nerves from indicated 8-weeks-old control and mutant mice (Error bars represent s.e.m. n=4 mice per genotype for each graph). h, Representative immunofluorescence using the indicated markers on longitudinal frozen sections of distal sciatic nerve stumps from control and Rictorfl/fl; P0Cre mutant mice 36h after nerve transection injury. Note normal induction of mTORC1 activity in SCs of Rictor-deficient mice as reflected by indistinguishable p-S6 (Ser240/244) immunoreactivity. Scale bar: 50μm. The experiment was reproduced three times independently with similar results. Statistical evaluation in a, c-g was performed using Student’s t-test, unpaired, two-tailed.
Extended Data Fig. 8
Extended Data Fig. 8. Nerves from mutant mice with depletion of c-Myc and/or Hif1α in SCs show no abnormalities of myelinated axons.
a, Representative immunofluorescence using the indicated antibodies on longitudinal sections of axotomized sciatic nerve stumps from control and c-Mycfl/fl; iSox10Cre mutant mice (30 days after last tamoxifen administration) 36h after nerve transection injury. Note largely abolished induction of c-Myc expression in SCs (S100+) of c-Mycfl/fl; iSox10Cre mice. Scale bar: 50μm. The experiment was reproduced three times independently with similar results. b, Quantification of myelinated axons in sciatic nerves from 12-weeks-old mice with the indicated genotypes 30 days following tamoxifen administration (Error bars represent s.e.m. n=4 mice per genotype). c, Quantification of g ratios (left: scatter plots show g ratios of individual myelinated axons as function of axon diameter, right: corresponding cumulative g ratios per animal) in sciatic nerves from 12-weeks-old mice with the indicated genotypes 30 days following tamoxifen administration (Error bars represent s.e.m. n=3 mice per genotype). d, Western blot analysis (cropped blot images) of sciatic nerve lysates from 8-weeks-old mice with the indicated genotypes probed with the shown antibodies (Error bars represent s.e.m. n=3 mice per genotype for each graph. Each dot represents measurement from sciatic nerve lysate from one mouse). e, Representative immunofluorescence using the indicated markers on longitudinal frozen sections of axotomized sciatic nerve stumps from control and Hif1αfl/fl; P0Cre mutant mice 36h after nerve transection injury. Note largely abolished induction of Hif1α expression in Hif1αfl/fl; P0Cre mice. Scale bar: 50μm. The experiment was reproduced three times independently with similar results. f, Representative electron micrographs of transverse sciatic nerve sections from 8-weeks-old control and Hif1αfl/fl; P0Cre mice. Note indistinguishable nerve ultrastructure between control and mutant mice. Scale bar: 2μm. g, Quantification of myelinated axons in sciatic nerves from 8-weeks-old mice with the indicated genotypes (Error bars represent s.e.m. n=4 mice per genotype for each graph). h, Quantification of g ratios (left: scatter plots show g ratios of individual myelinated axons as function of axon diameter, right: corresponding cumulative g ratios per animal) in sciatic nerves from 8-weeks-old mice with the indicated genotypes (Error bars represent s.e.m. n=3 mice per genotype). i, Representative semithin (left) and electron micrographs (right) of transverse sciatic nerve sections from distal nerve stumps of mice with the indicated genotypes 36h after sciatic nerve transection with pseudocoloring of intact (turquoise) and degenerated (magenta) myelinated fibers. Scale bars: 10μm. The experiment was reproduced three times independently with similar results. j, Representative electron micrographs of transverse sciatic nerve sections from 12-weeks-old control and Hif1αfl/fl; c-Myc fl/fl; iSox10Cre mice 30 days following the last tamoxifen administration. Note indistinguishable nerve ultrastructure between control and mutant mice. Scale bar: 2μm. k, Quantification of myelinated axons in sciatic nerves from 12-weeks-old mice with the indicated genotypes 30 days following tamoxifen administration (Error bars represent s.e.m. n=4 mice per genotype). l, Quantification of g ratios (left: scatter plots show g ratios of individual myelinated axons as function of axon diameter, right: corresponding cumulative g ratios per animal) in sciatic nerves from 12-weeks-old mice with the indicated genotypes 30 days following tamoxifen administration (Error bars represent s.e.m. n=3 mice per genotype). Statistical evaluation in b-d, g, h, k, l was performed using Student’s t-test, unpaired, two-tailed.
Extended Data Fig. 9
Extended Data Fig. 9. Nerves from mutant mice with depletion of TSC2 in SCs show no abnormalities of myelinated axons.
a, Representative semithin (left) and electron micrographs (right) of transverse sciatic nerve sections from 12-weeks-old control and TSC2fl/fl; iSox10Cre mice 30 days following tamoxifen administration. Scale bars: 10μm. b, Quantification of myelinated axons in sciatic nerves from mice with the indicated genotypes 30 days following tamoxifen administration (Error bars represent s.e.m. n=4 mice per genotype). c, Quantification of g ratios (left: scatter plots show g ratios of individual myelinated axons as function of axon diameter, right: corresponding cumulative g ratios per animal) in sciatic nerves from mice with the indicated genotypes 30 days following tamoxifen administration (Error bars represent s.e.m. n=3 mice per genotype). Statistical evaluation in b and c was performed using Student’s t-test, unpaired, two-tailed.
Extended Data Fig. 10
Extended Data Fig. 10. Additional behavioral, electrophysiological, and structural analysis of ACR-treated mice.
a, Behavioral analysis of C57Bl/6J mice over the course of ACR intoxication (or control treatment) for 14 days. Note accentuated deterioration of motor performance (rotarod, hanging wire, grip strength) relative to sensory performance (tail flick, hot and cold plate) (Error bars represent s.e.m. n=8 mice per group and time point, except n=7 mice for control treatment 0 days tail flick, *P=0.0024, **P<0.0001 for rotarod, *P<0.0001 for hanging wire, *P=0.0049, **P=0.0130, ***P<0.0001 for grip strength). b, Weight analysis of C57Bl/6J mice over the course of ACR intoxication (or control treatment) for 14 days (Error bars represent s.e.m. n=5 female and n=3 male control mice, n=4 female and male ACR-treated mice, *P=0.0299, **P=0.0346). c, Analysis of CMAP amplitudes recorded in gastrocnemius muscles evoked after sciatic nerve stimulation of C57Bl/6J mice following 14d of ACR treatment, or control treatment (Error bars represent s.e.m. n=8 mice per group). d, Representative electron micrographs of transverse tibial nerve sections from C57Bl/6J mice following 14d of ACR admininistration (or control treatment), with pseudocoloring of intact (turquoise) and degenerated (magenta) myelinated fiber profiles. Degenerated profiles appeared as collapsed myelinated axons with little axoplasm or axons with segregation of the axoplasm by segments of the myelin sheath (d1), deranged fibers with axoplasm constriction due to myelin infoldings and convolution (d2), and myelinated fibers with accumulation of membrane like material, multivesicular structures, and dense bodies in the axoplasm (d3). Scale bars: 2μm. e, Densities of degenerated axon profiles in tibial nerves from C57Bl/6J mice following control treatment or 14d of ACR admininistration (Error bars represent s.e.m. n=8 mice per group). f, Representative electron micrographs of transverse tibial nerve sections from C57Bl/6J mice following control treatment or 14d of ACR admininistration show normal ultrastructure of unmyelinated axons in Remak bundles (‘N’ depicts nuclei of SCs forming Remak bundles). Scale bar: 2μm. The experiment was reproduced three times independently with similar results. g, Weight analysis of ACR-treated control TSC2fl/fl and mutant TSC2fl/fl; iSox10Cre mice (Error bars represent s.e.m. n=4 female and n=7 male mice (except n=6 male mice for 14 days treatment time point) with genotype TSC2fl/fl, n=8 female and n=6 male mice with genotype TSC2fl/fl; iSox10Cre). Statistical evaluation in a, b, and g was performed using multiple Student’s t-test, unpaired, two-tailed, and in c and e using Student’s t-test, unpaired, two-tailed.
Fig. 1.
Fig. 1.. SCs stabilize injured axons.
a, d, Schematics of the in vitro axon injury models. b, e, Representative micrographs show immunolabeled axons 24h after disconnection from the neuronal cell bodies under the indicated conditions. Dotted lines in conventional cultures indicate axotomy sites. Asterisks in microfluid cultures indicate aspirated neuronal cell body area. DAPI signal depicts SC nuclei. Scale bars: 100μm The experiment was reproduced four times independently with similar results in conventional cultures and three times with similar results in microfluidic cultures. c, Box and whiskers plots (maximum, 25th percentile, median, 75th percentile, minimum) of axon survival in conventional cultures 24h following injury (β-III-tub, Neurons: n=73 DRG neurite preparations; β-III-tub, Neurons+SCs: n=57 DRG neurite preparations; NF-H, Neurons: n=77 DRG neurite preparations; NF-H Neurons+SCs: n=57 DRG neurite preparations; all DRG neurite preparations from four experimental sets performed on different days). f, Box and whiskers plots (maximum, 25th percentile, median, 75th percentile, minimum) of axon survival in microfluidic device cultures 24h following injury (βIII-tub, Neurons: n=23 DRG neurite preparations; β-III-tub, Neurons+SCs: n=23 DRG neurite preparations; NF-H, Neurons: n=22 DRG neurite preparations; NF-H, Neurons+SCs: n=23 DRG neurite preparations; all DRG neurite preparations from three experimental sets performed on different days). Statistical evaluation in c and f was performed using Student’s t-test, unpaired, two-tailed.
Fig. 2.
Fig. 2.. Glycolytic upregulation in SCs upon axon injury.
a, Schematic representation of Wallerian degeneration after unilateral sciatic nerve transection in mice. b, Quantification of EGFP+ SCs immunoreactive for the indicated markers after axotomy in distal nerve stumps at indicated post-injury times (Error bars represent s.e.m. n=3 mice per time point for each marker). c-g, k, l, Representative immunofluorescence for the indicated components on longitudinal frozen sections from uninjured control nerve segments and distal sciatic nerve stumps at the shown post-injury times. Arrows depict co-localization. HK1: hexokinase. PFKM: phosphofructokinase M. PKM2: Pyruvate kinase M2. Scale bars: 50μm. The experiments were reproduced three times independently with similar results. h, Left: Representative images of longitudinal sciatic nerve sections stained for the activity of HK, GAPDH, and LDH (formazan formation) under the indicated conditions with superimposition of DAPI signals (arrows) indicating position of cell nuclei. Scale bars: 10μm. Right: Densitometric quantification of formazan intensity representing respective enzyme activities on nerve sections (Error bars represent s.e.m. n=3 mice for each graph). i, Glucose concentrations in lysates of sciatic nerve segments (Error bars represent s.e.m. n=3 mice per condition for 6, 12, 24, 36, and 72 hours after axotomy, n=4 mice per condition for 48 hours after axotomy, *P=0.0025, **P=0.0448, ***P=0.0199). j, Top: Schematic showing experimental time course to image glucose tracer uptake in axotomized nerves. Bottom: Representative intensity micrographs for IRDye800CW-2DG uptake under the indicated conditions. Note markedly elevated cellular glucose tracer uptake following nerve injury. Scale bar: 10μm. The experiment was reproduced three times independently with similar results. Statistical evaluation in h was performed using Student’s t-test, unpaired, two-tailed, and in i using multiple Student’s t-test, unpaired, two-tailed.
Fig. 3.
Fig. 3.. Enhanced glycolytic flux and lactate extrusion in injury-activated SCs.
a, Top: Scheme of metabolomic analysis using extracts from nerve segments. Bottom: Concentrations of key energy metabolism intermediates in control and axotomized nerve segments from C57Bl/6J mice (F6P/G6P: fructose-6-phosphate/glucose-6-phosphate. FBP: fructose-1,6-bisphosphate. GI-OH3P: Glyceraldehyde-3-phosphate. 2PG/3PG: 2-phosphoglycerate/3-phosphoglycerate. LACT: lactate) (Error bars represent s.e.m. n=5 mice per condition and metabolite). b, Top: Scheme of extracellular flux analysis of SCs purified from C57Bl/6J mouse nerves. Bottom: Box and whiskers plot (maximum, 25th percentile, median, 75th percentile, minimum) shows glycolytic activity parameters as assessed by extracellular acidification rate (ECAR) measurements in control mouse SCs and cells with Nrg1-induced ErbB2 activation (n=9 well preparations per condition, *P=0.0080, **P=0.0464, ***P<0.0001). c, Western blot analysis (cropped blot images) of control- and Nrg1-treated C57Bl/6J mouse SCs probed with the indicated antibodies. (n=6 independent pair preparations (2 separate dishes) for PFKFB3, and n=3 independent pair preparations (2 separate dishes) for LDHA quantification). d, Intracellular and extracellular (supernatant) lactate concentrations from control and Nrg1-treated mouse SC preparations normalized to cell number and cellular protein. Note decreased intracellular and increased extracellular lactate levels in SCs treated with Nrg1 for 24h, indicating greatly increased lactate extrusion (Error bars represent s.e.m. n=3 well preparations from 3 independent experiments per condition). Statistical evaluation in a, b, d was performed using Student’s t-test, unpaired, two-tailed, and in c using Ratio Paired t-test, one-tailed.
Fig. 4.
Fig. 4.. Glycolytic SCs are metabolically coupled to injured axons and antagonize AxD.
a, Representative immunofluorescence for the indicated MCTs on longitudinal frozen sections from control uninjured nerves and axotomized distal sciatic nerve stumps at the shown post-injury time points. Arrows depict colocalization. Scale bars: 50μm. The experiment was reproduced three times independently with similar results. b, Left: Representative micrographs show immunolabeled axons 24h after disconnection from the neuronal cell bodies under the indicated conditions. Scale bar: 100μm. Right: Box and whiskers plots (maximum, 25th percentile, median, 75th percentile, minimum) of axon survival 24h following injury (n=36 DRG neurite preparations for both β-III-tub and NF-H per condition from 4 experimental sets performed on different days). c-e, Representative semithin (top) and electron micrographs (bottom) of transverse sciatic nerve sections of distal nerve stumps from mice with the indicated genotypes 36h after sciatic nerve transection with pseudocoloring of intact (turquoise) and degenerated (magenta) myelinated fibers, and corresponding quantifications of relative axon survival (Error bars represent s.e.m. n=6 mice per genotype for c. n=5 mice per genotype for d and e). Scale bars: 10μm. f, Representative immunofluorescence of axons 24h after disconnection from the neuronal cell bodies under the indicated conditions. Yellow dotted lines indicate axotomy sites. Insets show red dashed areas (red). Note many continuous transected axons in the preparation associated with SCs (middle panel), and abrogation of such axon protection in presence of 4-CIN (bottom panel). Scale bars: 50μm. The experiment was reproduced three times independently with similar results. g, Box and whiskers plots (maximum, 25th percentile, median, 75th percentile, minimum) of axon survival 24h following axotomy under the indicated conditions (4-CIN: β-III-tub and NF-H, Neurons: n=24 DRG neurite preparations, Neurons+SCs DMSO: n=25 DRG neurite preparations for β-III-tub and n=24 for NF-H, Neurons+SCs 4-CIN: n=21 DRG neurite preparations; all DRG neurite preparations from three experimental sets performed on different days. Syrosingopine: β-III-tub, Neurons: n=34 DRG neurite preparations, Neurons+SCs DMSO: n=37 DRG neurite preparations, Neurons+SCs syro 5μM: n=11 DRG neurite preparations, Neurons+SCs syro 10μM: n=30 DRG neurite preparations; all DRG neurite preparations from three experimental sets performed on different days except Neurons+SCs syro 5μM (one experimental set), NF-H, Neurons: n=34 DRG neurite preparations, Neurons+SCs DMSO: n=29 DRG neurite preparations, Neurons+SCs syro 5μM: n=11 DRG neurite preparations, Neurons+SCs syro 10μM: n=30 DRG neurite preparations; all DRG neurite preparations from three experimental sets performed on different days except Neurons+SCs syro 5μM (one experimental set). AR-C155858: β-III-tub, Neurons: n=41 DRG neurite preparations, Neurons+SCs DMSO: n=49 DRG neurite preparations, Neurons+SCs AR-C 1μM: n=24 DRG neurite preparations, Neurons+SCs AR-C 100μM: n=44 DRG neurite preparations; all DRG neurite preparations from three experimental sets performed on different days except Neurons+SCs AR-C 1μM (two experimental sets), NF-H: Neurons: n=41 DRG neurite preparations, Neurons+SCs DMSO: n=41 DRG neurite preparations, Neurons+SCs AR-C 1μM: n=24 DRG neurite preparations, Neurons+SCs AR-C 100μM: n=44 DRG neurite preparations; all DRG neurite preparations from three experimental sets performed on different days except Neurons+SCs AR-C 1μM (two experimental sets). Statistical evaluation in b-e was performed using Student’s t-test, unpaired, two-tailed, and in g using One-way-ANOVA and Sidak’s multiple comparisons tests.
Fig. 5.
Fig. 5.. mTOR inactivation in SCs results in accelerated AxD.
a, Left: Scheme of Phospho Explorer antibody array analysis with array images from the experiment using pooled groups of control and axotomized nerve segments. Right: Upregulation of phosphorylation targets representing mTORC1/2 (magenta squares) and AMPK (turquoise triangles) induction in axotomized nerve segments in comparison to upregulation of c-Jun and p-ErbB2 (Tyr877) (n=6 uninjured nerve segments and n=6 injured nerve segments from n=6 mice, each symbol represents the fold change value in comparison to the pooled uninjured control nerve group), b, c, Western blot analysis (cropped blot images) of lysates from uninjured nerve segments and axotomized distal sciatic nerve stumps from C57Bl/6J mice reflecting mTORC1 (b) and mTORC2 activity (c) at different times following nerve transection. Individual lanes represent pooled data from at least three mice. d-g, Representative immunofluorescence for the indicated markers on longitudinal frozen sections from control uninjured nerves and axotomized distal sciatic nerve stumps at the shown post-injury time points. Arrows depict colocalization. Scale bars: 50μm. The experiments were reproduced three times independently with similar results. h, Quantitative analysis of relative axon survival in distal sciatic nerve stumps 36h after axotomy in mice with the indicated genotypes (Error bars represent s.e.m. n=3 mice with the genotype mTORfl/fl and n=4 mice with the genotype mTORfl/fl; P0Cre). Statistical evaluation was performed using Student’s t-test, unpaired, two-tailed, i, Representative confocal projections of whole-mounted distal sciatic nerve stumps from mice with the indicated genotypes show increased fragmentation of transected YFP+ axons in the mTOR-deficient preparation. Scale bar: 100μm. The experiment was reproduced three times independently with similar results. j, Left: Representative electron micrographs of transverse sections from distal nerve stumps of mice with the indicated genotypes 48h after sciatic nerve transection with pseudocoloring of intact (turquoise) and degenerated (magenta) myelinated fibers show increased axon death in mTOR-deficient sample. Scale bar: 10μm. The experiment was reproduced three times independently with similar results. Right: Representative immunofluorescence of transverse frozen sections from 48h axotomized sciatic nerve stumps of mice with the indicated genotypes show decreased NF-H immunoreactivity in the mTOR-deficient preparation (blue: DAPI). Scale bar: 50μm. The experiment was reproduced three times independently with similar results.
Fig. 6.
Fig. 6.. mTOR in SCs promotes the SC glycolytic shift upon injury.
a, Relative injury-induced mRNA expression changes of indicated targets assessed by ddPCR in sciatic nerve lysates from mice with the shown genotypes (Error bars represent s.e.m. GLUT1: n=3 mice per genotype, PFKFB3: n=5 mice for wild type and n=3 mice for the genotypes mTORfl/fl and mTORfl/fl;P0Cre, LDHA: n=5 mice for wild type and mTORfl/fl;P0Cre, n=3 mice for mTORfl/fl, Hif1α: n=5 mice for wild type, n=3 mice for mTORfl/fl, n=4 mice for mTORfl/fl;P0Cre, c-Myc: n=5 mice for wild type, n=3 mice for mTORfl/fl, n=4 mice for mTORfl/fl;P0Cre). b, Representative immunofluorescence micrographs for the indicated markers on teased fiber preparations (b) from uninjured control and axotomized distal tibial nerve stumps (blue: DAPI). Scale bars: 10μm. c, Corresponding quantitative analysis of relative teased fiber fluorescence intensities for the shown markers (Error bars represent s.e.m. n=3 mice per marker and genotype) d, Injury-induced alterations of LDH enzymatic activity in nerve lysates from mice with the indicated genotypes and shown conditions (Error bars represent s.e.m. n=4 mice for mTORfl/fl, n=5 mice for mTORfl/fl;P0Cre) e, Box and whiskers plots (maximum, 25th percentile, median, 75th percentile, minimum) show basal glycolytic activity and maximal glycolytic activity after glucose injection as assessed by ECAR measurements in control- and everolimus-treated mouse SCs (n=9 well preparations per group). Statistical evaluation in a was performed using One-way-ANOVA and Sidak’s multiple comparisons tests, and in c-e using multiple Student’s t-test, unpaired, two-tailed.
Fig. 7.
Fig. 7.. The mTORC1-Hif1 α/c-Myc axis in SCs protects injured axons.
a, b, Experimental paradigm for rapamycin injections in Thy1.2-YFP-H (a) and tamoxifen injections in mTORfl/fl; iSox10Cre mice (b). c, Left: Representative p-S6 (Ser240/244) immunofluorescence reflecting mTORC1 activity on longitudinal distal sciatic nerve stump frozen sections from vehicle and rapamycin treated mice 36h after axotomy. Scale bar: 100μm. Middle: Representative electron micrographs of transverse sciatic nerve sections distal to injury with pseudocoloring of intact (turquoise) and degenerated (magenta) myelinated fibers show more advanced AxD after rapamycin treatment. Scale bar: 2μm. Right: Representative confocal micrographs of whole-mounted distal sciatic nerve stumps from vehicle or rapamycin-treated Thy1.2-YFP-H mice show more advanced axon fragmentation after rapamycin treatment. Scale bar: 100μm. d, f, g, i, Quantitative analysis of relative axon survival in distal sciatic nerve stumps 36h after axotomy in vehicle and rapamycin-treated mice, and mice with the indicated genotypes (Error bars represent s.e.m. d (left), n=3 mice per condition, d (right), n=5 mice for mTORfl/fl and n=7 mice for mTORfl/fl; iSox10Cre, f (left), n=4 mice for Raptorfl/fl and n=5 mice for Raptorfl/fl; P0Cre, f (middle and right), n=7 mice for each genotype, g (left), n=5 mice for c-Mycfl/fl and n=6 mice for c-Mycfl/fl; iSox10Cre, g (middle), n=7 mice for Hif1αfl/fl and n=6 mice for Hif1αfl/fl; P0Cre, g (right), n=6 mice for each genotype, i, n=5 mice for Hif1αfl/fl; c-Mycfl/fl and n=9 mice for Hif1αfl/fl; c-Mycfl/fl; iSox10Cre). e, h, Representative semithin (h only, top) and electron micrographs of transverse sciatic nerve sections from distal nerve stumps of mice with the indicated genotypes 36h after sciatic nerve transection with pseudocoloring of intact (turquoise) and degenerated (magenta) myelinated fibers. Scale bars: 10μm. Statistical evaluation in d, f, g, and i was performed using Student’s t-test, unpaired, two-tailed.
Fig. 8.
Fig. 8.. Axon protection through mTORC1 hyperactivity in SCs.
a, Top: Experimental paradigm for tamoxifen injections and nerve lesion in TSC2fl/fl; iSox10Cre mice. Bottom: mTORC1 activity western blot analysis (cropped blot images) of sciatic nerve lysates from control and TSC2fl/fl; iSox10Cre mice (30 days after last tamoxifen administration) (Error bars represent s.e.m. n=4 mice per genotype. Each dot represents measurement from sciatic nerve lysate from one mouse). b, Representative semithin (top) and electron micrographs (bottom) of transverse sciatic nerve sections from distal nerve stumps of control and TSC2fl/fl; iSox10Cre mice (30 days after last tamoxifen administration) at the indicated post-injury times with pseudocoloring of intact (turquoise) and degenerated (magenta) myelinated fibers, and corresponding quantitative analysis of relative axon survival. Note preservation of many myelinated axons in TSC2fl/fl; iSox10Cre mice with intact axoplasm and non-collapsed myelin sheaths. In contrast, most axons are degenerated in control mice 48h after injury (Error bars represent s.e.m. 36h after injury, n=5 mice per genotype. 48h after injury, n=5 mice for TSC2fl/fl and n=4 mice for TSC2fl/fl; iSox10Cre). Scale bars: 10μm. c, Representative mTORC1 immunofluorescence of longitudinal tibial nerve frozen sections from untreated, and ACR-treated control and TSC2fl/fl; iSox10Cre mice (14d ACR treatment started 30d after last tamoxifen administration). Note occasional mTORC1 increases (arrows) in ACR-treated control nerves in injury-activated SCs, and marked mTORC1 hyperactivity in cells from ACR-treated TSC2fl/fl; iSox10Cre mice. Scale bar: 100μm. The experiment was reproduced three times independently with similar results. d, Experimental paradigm for tamoxifen injections, acrylamide administration, and behavioral analysis in TSC2fl/fl; iSox10Cre mice. The endpoint indicates time of electrophysiological and morphological analysis. e-g, Accelerated rotarod (e), relative grip strength (f), and hanging wire (g) analysis of ACR-treated control and TSC2fl/fl; iSox10Cre mice (Error bars represent s.e.m. e, n=11 TSC2fl/fl mice for 0, 7, 10, and 14 days acrylamide, n=8 TSC2fl/fl mice for 12 days acrylamide, n=14 TSC2fl/fl ; iSox10Cre mice for 0, 7, and 10 days acrylamide, n=10 TSC2fl/fl ; iSox10Cre mice for 12 days acrylamide, n=13 TSC2fl/fl ; iSox10Cre mice for 14 days acrylamide, f, g, n=9 TSC2fl/fl mice and n=10 TSC2fl/fl ; iSox10Cre mice for each time point, *P=0.0001, **P=0.0003, ***P=0.0212, #P=0.0090 in e,*P=0.0475, **P=0.0042, ***P<0.0001 in f, *P=0.0394, **P<0.0001, ***P=0.0001 in g). h, Left: Representative electron micrographs of transverse tibial nerve sections from control and TSC2fl/fl; iSox10Cre mice (6 weeks after last tamoxifen administration) following 14d of ACR admininistration, with pseudocoloring of intact (turquoise) and degenerated (magenta) myelinated fiber profiles. Scale bar: 5μm. Right: corresponding quantitative analysis shows densities of degenerated axon profiles (Error bars represent s.e.m. n=11 TSC2fl/fl mice and n=12 TSC2fl/fl ; iSox10Cre mice). i, Analysis of CMAP amplitudes recorded in gastrocnemius muscles evoked after sciatic nerve stimulation of control and TSC2fl/fl; iSox10Cre mice following 14d of ACR treatment (Error bars represent s.e.m. n=9 TSC2fl/fl mice and n=10 TSC2fl/fl ; iSox10Cre mice). j, Model for the regulation of monocarboxylate production and release, driven by the mTORC1-Hif1α/c-Myc axis in injury-activated SCs, to support the integrity of injured axons. mTORC1 induction occurs upon ErbB2 activation in SCs. This promotes the expression of Hif1α and c-Myc which together drive the expression of glycolytic components including GLUT1, PFKFB3 and LDHA to increase the production of pyruvate and lactate from imported glucose. These monocarboxylates are shuttled into axons via MCTs (MCT1 and 4 in SCs and MCT2 in axons). While pyruvate can be directly utilized in axonal mitochondria for ATP production, lactate requires conversion into pyruvate by LDHB. Statistical evaluation in a, b, h, and i was performed using Student’s t-test, unpaired, two-tailed, and in e-g using multiple Student’s t-test, unpaired, two-tailed.

Comment in

  • Schwann cell energy to die for.
    Trimarco A, Taveggia C. Trimarco A, et al. Nat Neurosci. 2020 Oct;23(10):1179-1181. doi: 10.1038/s41593-020-00707-2. Nat Neurosci. 2020. PMID: 32901153 No abstract available.

References

    1. Coleman MP & Hoke A Programmed axon degeneration: from mouse to mechanism to medicine. Nat Rev Neurosci 21, 183–196 (2020). - PMC - PubMed
    1. Figley MD & DiAntonio A The SARM1 axon degeneration pathway: control of the NAD(+) metabolome regulates axon survival in health and disease. Curr Opin Neurobiol 63, 59–66 (2020). - PMC - PubMed
    1. Krauss R, Bosanac T, Devraj R, Engber T & Hughes RO Axons Matter: The Promise of Treating Neurodegenerative Disorders by Targeting SARM1-Mediated Axonal Degeneration. Trends Pharmacol Sci 41, 281–293 (2020). - PubMed
    1. Yang J, et al. Pathological axonal death through a MAPK cascade that triggers a local energy deficit. Cell 160, 161–176 (2015). - PMC - PubMed
    1. Walker LJ, et al. MAPK signaling promotes axonal degeneration by speeding the turnover of the axonal maintenance factor NMNAT2. eLife 6 (2017). - PMC - PubMed

Methods-only References

    1. Mallon BS, Shick HE, Kidd GJ & Macklin WB Proteolipid promoter activity distinguishes two populations of NG2-positive cells throughout neonatal cortical development. J Neurosci 22, 876–885 (2002). - PMC - PubMed
    1. Young CD, et al. Modulation of glucose transporter 1 (GLUT1) expression levels alters mouse mammary tumor cell growth in vitro and in vivo. PLoS One 6, e23205 (2011). - PMC - PubMed
    1. Viollet B, et al. The AMP-activated protein kinase alpha2 catalytic subunit controls whole-body insulin sensitivity. J Clin Invest 111, 91–98 (2003). - PMC - PubMed
    1. de Alboran IM, et al. Analysis of C-MYC function in normal cells via conditional gene-targeted mutation. Immunity 14, 45–55 (2001). - PubMed
    1. Hernandez O, Way S, McKenna J 3rd & Gambello MJ Generation of a conditional disruption of the Tsc2 gene. Genesis 45, 101–106 (2007). - PubMed

Publication types

Substances

LinkOut - more resources