. 2020 Dec;16(12):1376-1384.
doi: 10.1038/s41589-020-0622-x. Epub 2020 Aug 17.

Targeted glycan degradation potentiates the anticancer immune response in vivo

Affiliations

Targeted glycan degradation potentiates the anticancer immune response in vivo

Melissa A Gray et al. Nat Chem Biol. 2020 Dec.

Abstract

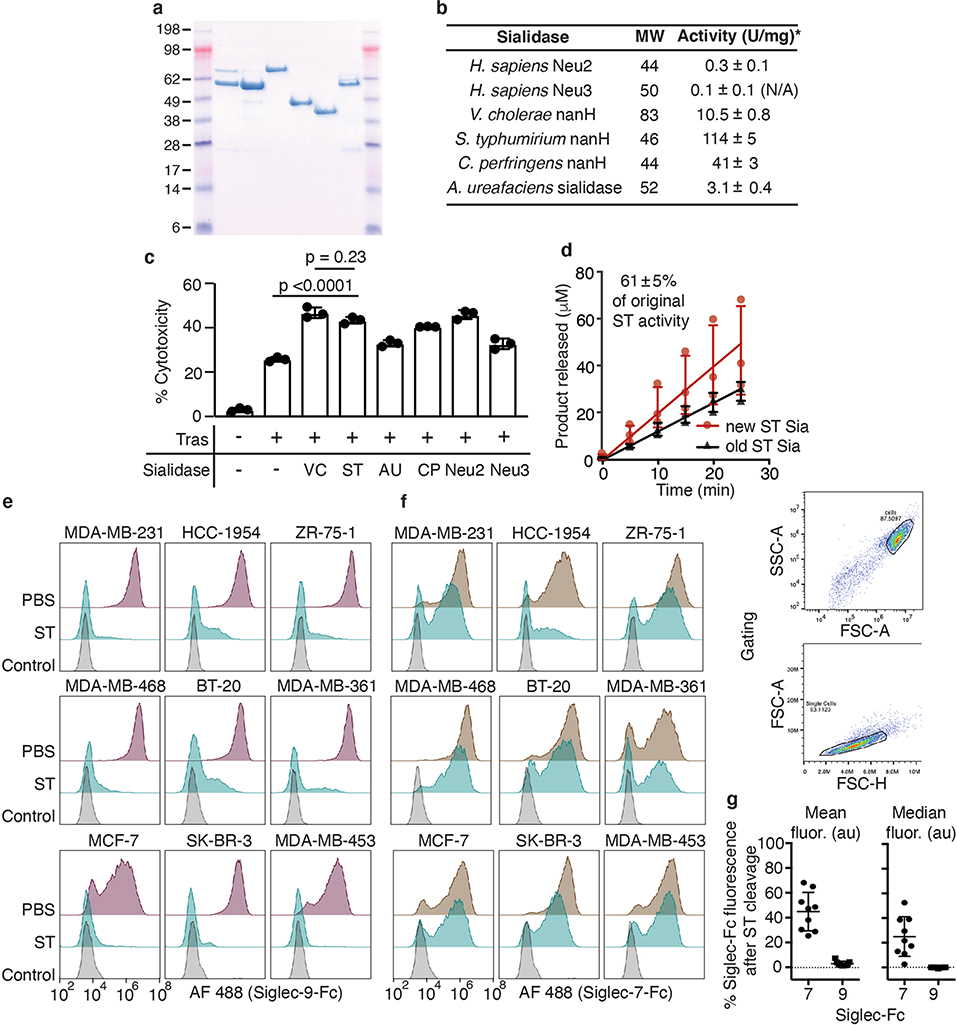
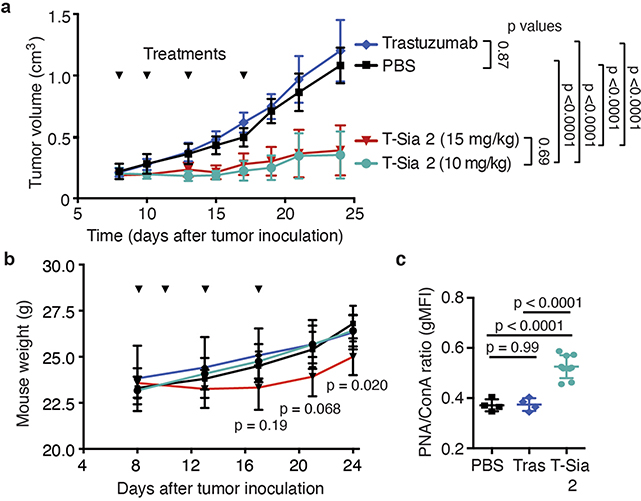
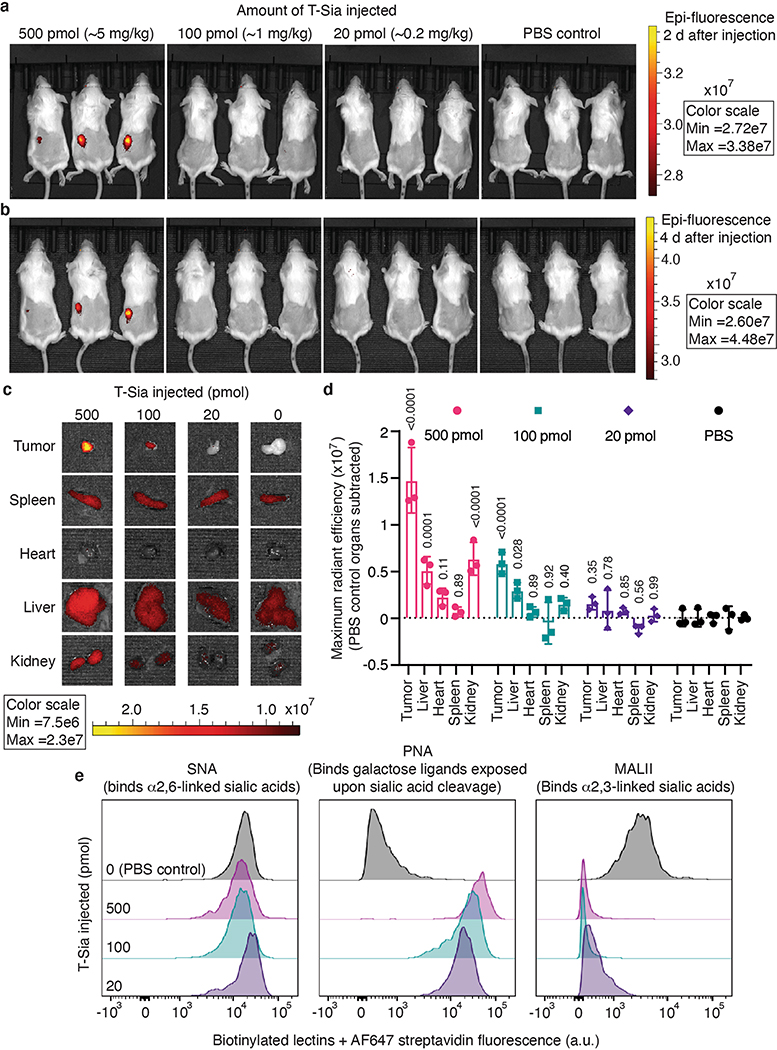
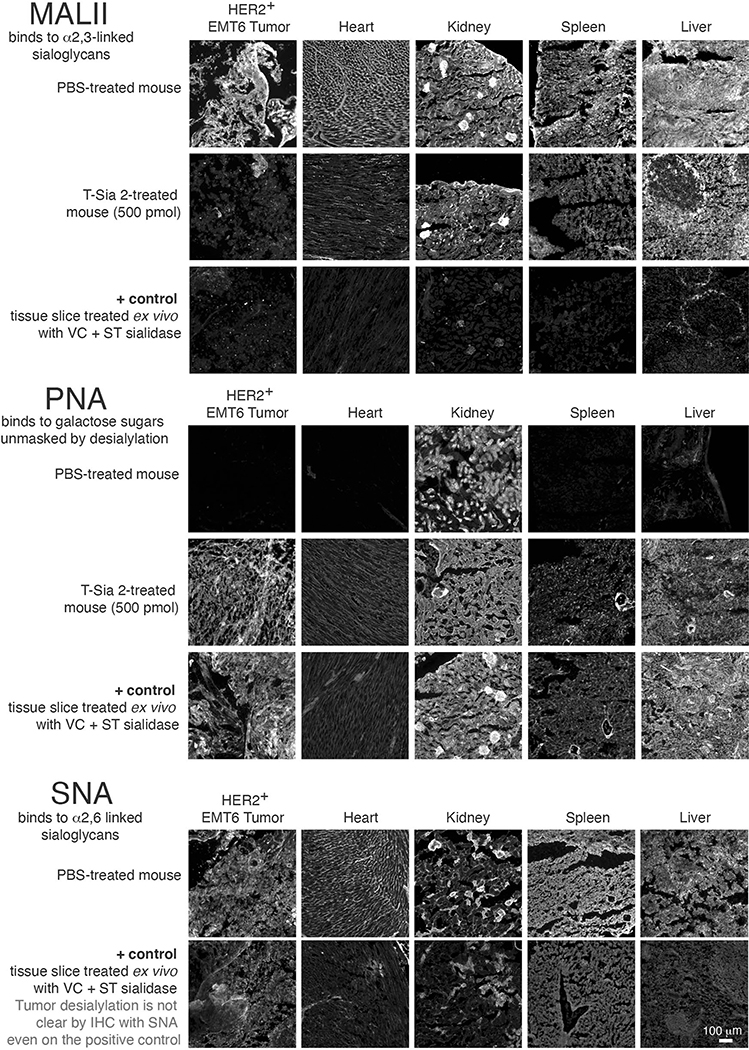
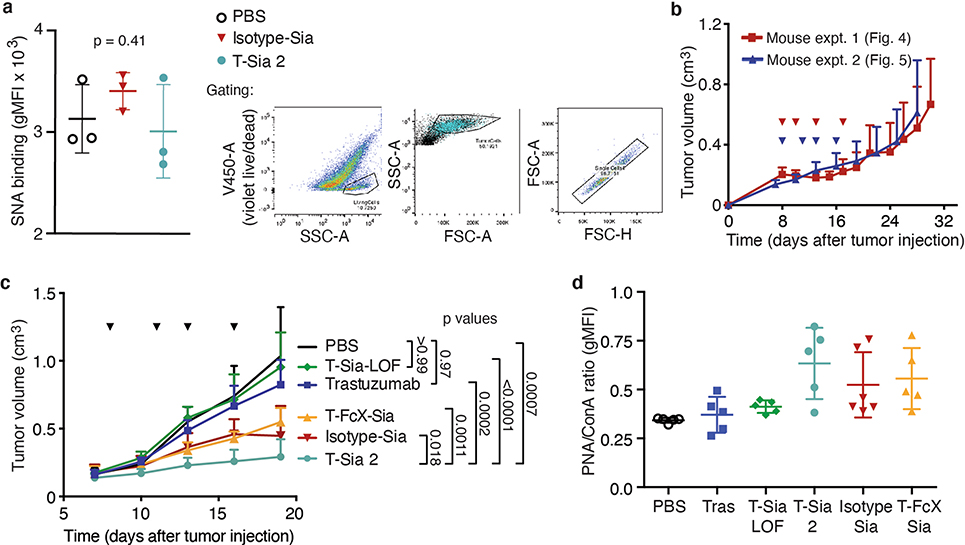
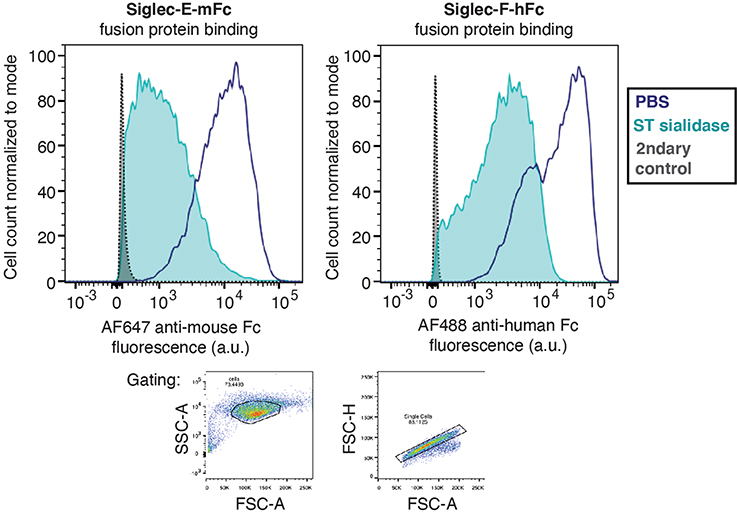
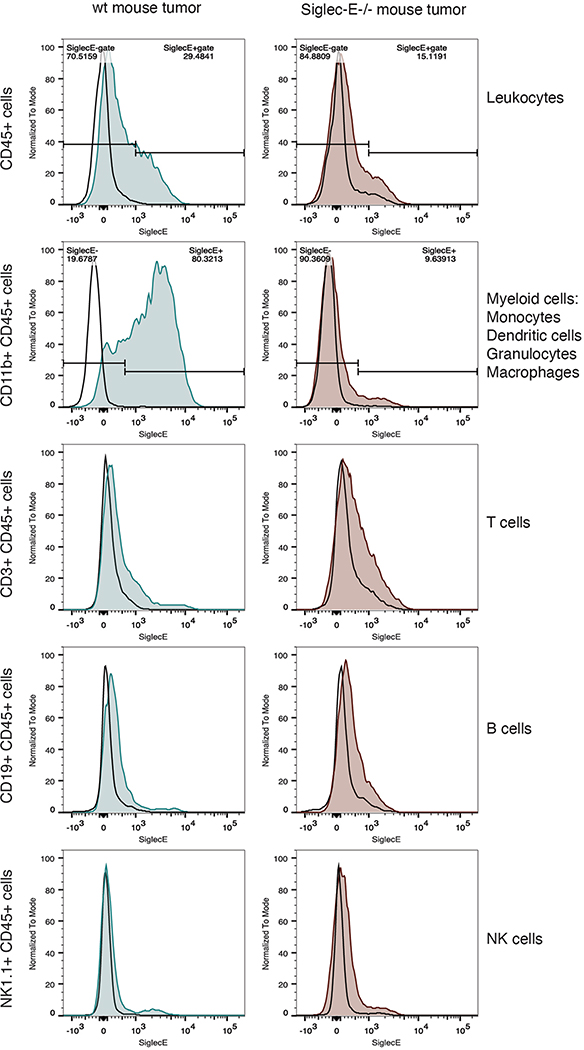
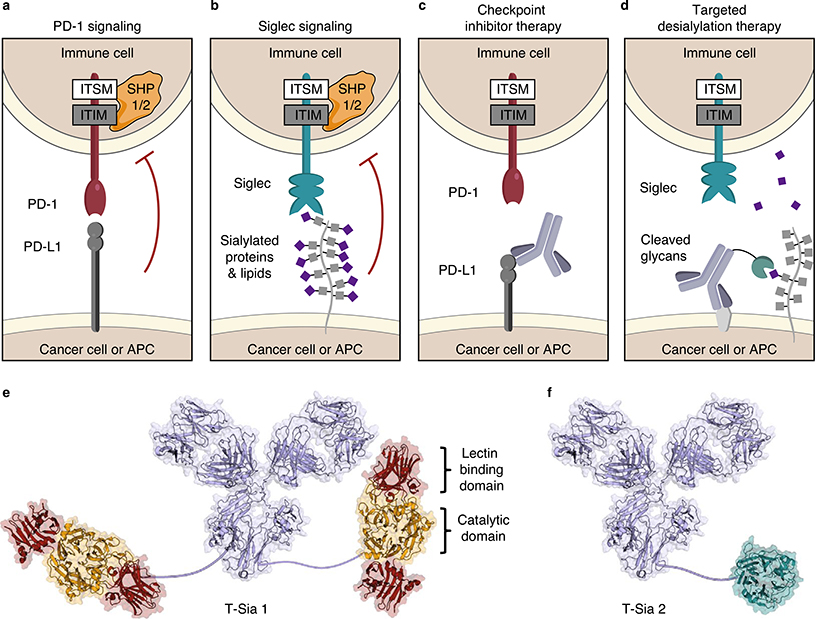
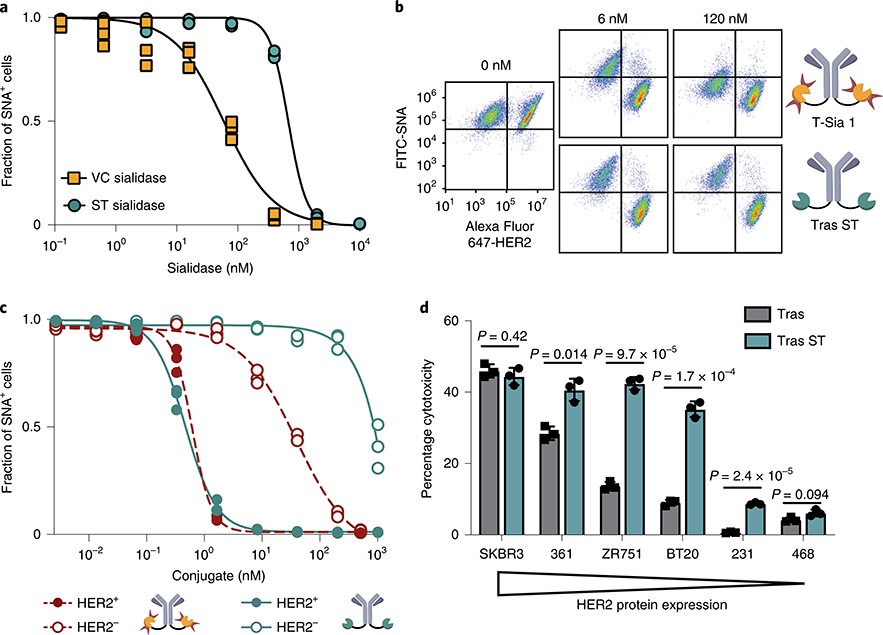
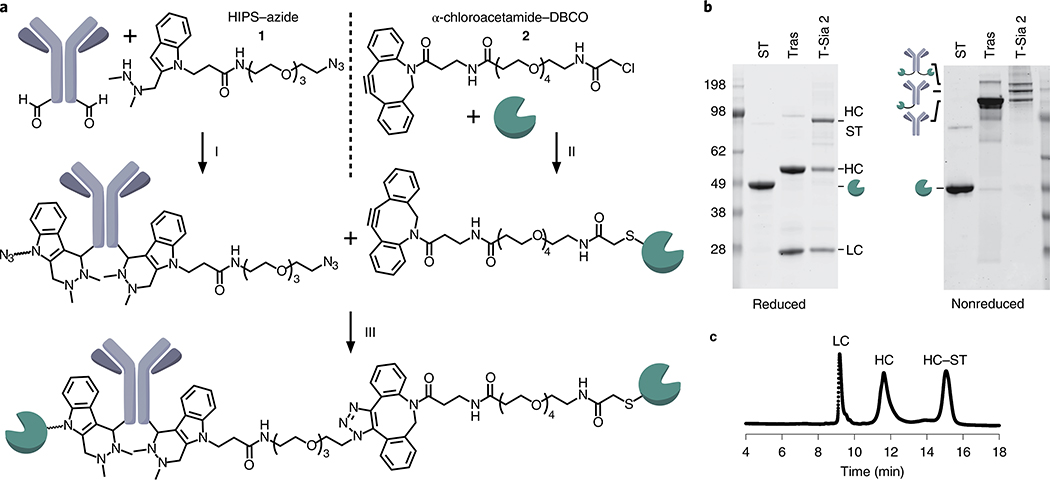
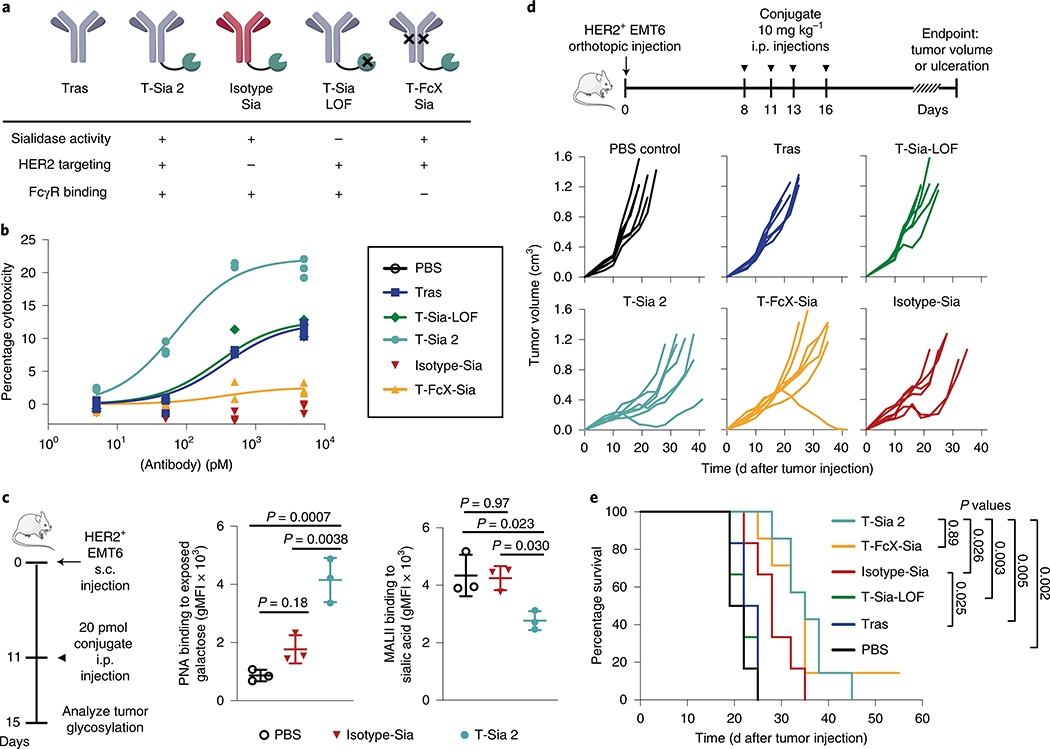
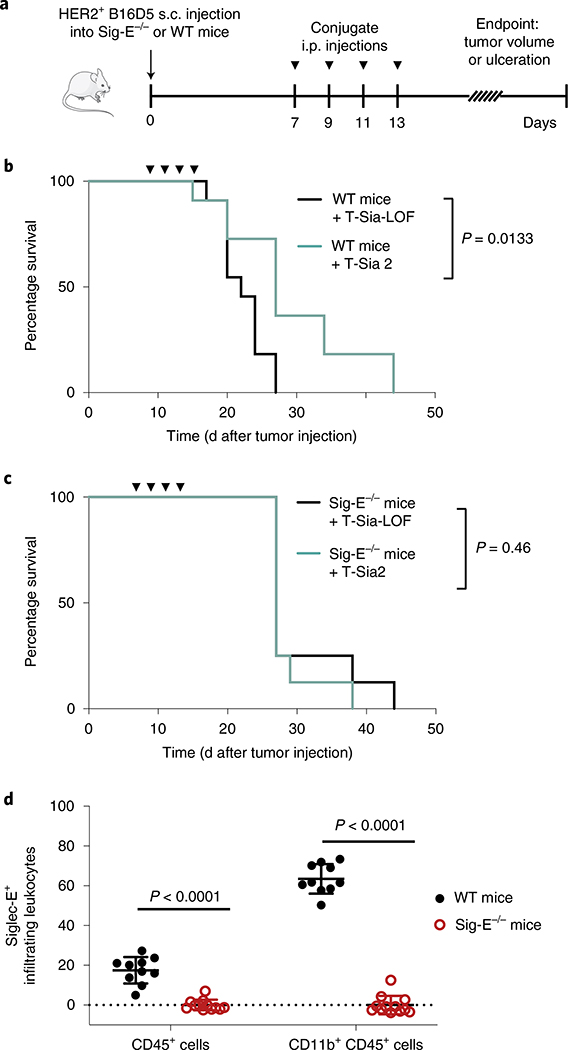
Currently approved immune checkpoint inhibitor therapies targeting the PD-1 and CTLA-4 receptor pathways are powerful treatment options for certain cancers; however, most patients across cancer types still fail to respond. Consequently, there is interest in discovering and blocking alternative pathways that mediate immune suppression. One such mechanism is an upregulation of sialoglycans in malignancy, which has been recently shown to inhibit immune cell activation through multiple mechanisms and therefore represents a targetable glycoimmune checkpoint. Since these glycans are not canonically druggable, we designed an αHER2 antibody-sialidase conjugate that potently and selectively strips diverse sialoglycans from breast cancer cells. In syngeneic breast cancer models, desialylation enhanced immune cell infiltration and activation and prolonged the survival of mice, an effect that was dependent on expression of the Siglec-E checkpoint receptor found on tumor-infiltrating myeloid cells. Thus, antibody-sialidase conjugates represent a promising modality for glycoimmune checkpoint therapy.


Figures

Extended Data Fig. 1 |
Extended Data Fig. 1 |. The PD-1 receptor and eight members of the human Siglec family have a homologous ITIM-ITSM cytosolic sequence motif and are expressed on a variety of immune cells.
Both PD-1 and Siglecs contain an N-terminal binding domain to their ligands (PD-L1/2 and sialoglycans, respectively), a helical single pass through the cell membrane, and an 82–126 amino acid cytosolic C-terminus containing an ITIM motif, a 12–18 amino acid spacer, and an ITSM or ITSM-like motif. Siglecs are expressed on a variety of immune cells; cell types that are Siglec+ or have Siglec+ subsets reported in humans and mice are indicated above for each Siglec receptor. T = T cell, B = B cell, MDSCs = myeloid-derived suppressor cells, My = Myeloid-precursor, Mon = Monocyte, Mi = Microglia, Neu = Neutrophil, Mac = Macrophage, Troph = Trophoblast, NK = Natural killer cell, Eos = Eosinophil, Bas = Basophil, DC=Dendritic cell, Mast = Mast cell, Pt = platelet. Siglec protein sequences are from Uniprot with added cell expression information from multiple sources,,,,–.
Extended Data Fig. 2 |
Extended Data Fig. 2 |. ST sialidase is a small, stable sialidase that enhances NK cell-mediated ADCC towards breast cancer cells and cleaves Siglec-7 and -9 ligands at high concentrations.
a, PAGE-SDS reducing gel of six recombinantly expressed and purified sialidases: Neu2, Neu3, Vibrio cholerae sialidase, Salmonella typhimurium NanH, Clostridium perfringens NanH, Arthrobacter ureafaciens NanH b, Molecular weights and specific activities (in μmol substrate converted per min per mg enzyme) of sialidases determined by in vitro activity assays with the fluorogenic substrate 4-MUNANA (n = 3 experimental replicates; mean ± SD). c, IL2-activated NK cell-mediated ADCC assay against target BT-20 breast cancer cells treated with 10 nM trastuzumab (Tras) and 2 μM sialidases at E/T = 4, percent cytotoxicity was detected by LDH release after 4 h. Figure shows mean ± SD from n = 3 experimental replicates against the same biological NK cell donor. Statistical analysis by one way ANOVA with Tukey’s multiple comparisons adjusted p-values. d, In vitro activity assay of freshly expressed sialidase compared with sialidase stored in PBS at 4 °C for 2 years reveals that significant ST sialidase activity is preserved (n = 3 experimental replicates fit to a linear regression ± SD). e-g, Siglec ligand depletion by ST sialidase cleavage is effective across many breast cancer cell lines. ST sialidase (2 μM) was incubated with nine different breast cancer cell lines for 1 h and the removal of Siglec ligands compared to PBS-treated cells was assessed by staining with Siglec-9-Fc (e) or Siglec-7-Fc (f) and anti-human-488 secondary antibody (control: secondary only). Gating is shown on the right, first selecting the cell population (FSC-A/SSC), then gating on single cells (FSC-A/FSC-H). Representative images from n = 2 experimental replicates of the n = 9 biological cell line replicates each with >2,000 cells are shown. The mean and median (± SD) percent decrease in Siglec ligand-binding fluorescent signal upon ST treatment of the n = 9 cell lines are quantified in g.
Extended Data Fig. 3 |
Extended Data Fig. 3 |. T-Sia 2 enhances NK cell-mediated and gamma-delta T cell-mediated ADCC in vitro.
a, Representative flow cytometry plots assessing purity of isolated primary NK cells. For n = 3 independent biological replicates of NK cell isolation, cells were >95% CD3 and had both CD16high and CD16low populations. b, NK cell-surface expression of some sialic acid-binding receptors from a representative NK donor. Isolated NK cells in all n = 3 biological replicates were positive for Siglec-7, had mixed expression of Siglec-9, and had low-to-moderate unimodal expression of NKG2D. c, NK cell-mediated ADCC of BT-20 target cells treated with PBS, 20 nM free ST sialidase, 10 nM trastuzumab, or 10 nM T-Sia 2 (mean ± SD). Plots from BT-20 cells alone (left) and from incubation with NK cells are each from n = 3 experimental replicates, E/T = 4, no IL-2 activation, detecting LDH release after 4 h; statistical analysis by two-tailed t tests. d, Plotting the NK cell-mediated cytotoxicity of trastuzumab and T-Sia 2-treated cells from (c) shows that desialylation enhances ADCC significantly across the n = 3 biological NK cell donor replicates. Mean ± SD, analyzed by a paired two-tailed t test. e, Representative gating showing the purity of isolated primary γδ T cells. Consistent with n = 3 biological replicates, γδ T Cells are somewhat impure (only ~85% are γδ+ and CD3+) and there are apparent sub-populations. f, A representative histogram (from n = 3 biological replicates) of a typical donor demonstrates that these cells are negative for Siglec-7 and -9 expression, although they also have a moderate unimodal expression of NKG2D. g, Mean ± SD from γδ T cell-mediated ADCC assays targeting HER2+ EMT6 cells treated with PBS, 20 nM free ST sialidase, 10 nM trastuzumab, or 10 nM T-Sia 2. Results are shown from n = 3 independent experimental replicates on EMT6 cells alone (left) and from incubation with IL-2 activated γδ T cells isolated from n = 3 distinct biological donors, E/T = 1, detecting LDH release after 8 h; statistical analysis by two-tailed t tests. h, Comparing trastuzumab vs T-Sia 2 treatment across n = 3 biological NK donors from (g), shows significant enhancement of cytotoxicity by desialylation. Mean ± SD, statistical analysis by a paired two-tailed t test. i, An IL-2 activated γδ T cell-mediated ADCC assay targeting SK-BR-3 cells incubated with PBS, trastuzumab (10 nM) or T-Sia 2 (10 nM), (n = 3), E/T = 3, detecting LDH release after 6 h; (Mean ± SD), statistical analysis by two-tailed t test.
Extended Data Fig. 4 |
Extended Data Fig. 4 |. T-Sia 2 treatment desialylates EMT6 tumors and delays tumor growth compared to trastuzumab- or PBS-treatment.
a, Mean ± SD tumor volume over time for HER2+ EMT6 tumor-bearing mice described in Fig. 4b, treated with PBS (n = 5), trastuzumab (10 mg/kg injection, n = 6), T-Sia 2 (10 mg/kg injection, n = 6), and T-Sia 2 (15 mg/kg injection, n = 6). RM two-way ANOVA with adjusted p-values from Tukey’s multiple comparisons between groups shown. b, Mouse weight from all of the mice in (a) measured 5x over the course of 24 days of treatment and tumor growth. Ordinary two-way ANOVA with Dunnet’s multiple comparisons to PBS mice, multiplicity-adjusted p-values for T-Sia (15 mg/kg) compared to PBS are shown at three time points, (mean ± SD). c, Lectin flow cytometry staining with fluorescent PNA to detect exposed galactose of extracted tumor cells from mice in Fig. 4b upon their sacrifice 13–23 days after final administration of PBS, trastuzumab, or T-Sia 2, (geometric mean (gMFI) ± SD), normalized to ConA fluorescence (a control that binds to mannose on cells), n = 4 (trastuzumab, PBS) n = 9 (T-Sia 2). Ordinary one-way ANOVA with adjusted p-values shown from Tukey’s multiple comparisons.
Extended Data Fig. 5 |
Extended Data Fig. 5 |. T-Sia 2 accumulates in the HER2+ EMT6 tumors in mice and can desialylate tumor cells at a single injection concentration as low as 0.2 mg/kg.
Mice bearing HER2+ EMT6 subcutaneous tumors on their left flanks were imaged using non-invasive in vivo fluorescence imaging at a, 48 h, and b, 4 days after IR800-labeled T-Sia 2 was injected IP into n = 3 mice per dose: 500 pmol, 100 pmol, 20 pmol, and PBS control. All mice are shown above. c, Representative photographs overlaid with fluorescent images of the tumor, spleen, heart, liver, and kidneys removed 4 days after conjugate injection, showing where fluorescently-labeled T-Sia 2 was localized. These images are representative of n = 3 biological mouse replicates. d, Maximum radiant efficiency was quantified for the n = 3 replicate mice per group and normalized to the average of the PBS mouse organ control. Mean ± SD are displayed with p values from a two-way ANOVA with Dunnet’s multiple comparisons to the respective control organ of mice injected with PBS. e, N = 3 tumors taken from each mouse group were pooled, resuspended, and single tumor cells were analyzed for lectin staining by flow cytometry. Although the SNA ligands in vivo were insensitive to T-Sia 2 desialylation at these doses, dramatic desialylation was apparent by detecting with the more sensitive reagents PNA (detecting exposed galactosyl (β-1,3) N-acetylgalactosamine) and MALII (detecting α2,3 linked sialic acids). The x-axis is displayed on a biexponential scale, y-axis is cell count normalized to mode. For MALII, SNA, and PNA staining n > 2,600 cells for all histograms except the 500 pmol T-Sia 2-dosed-mice histograms only represent n = 827 and n = 1,809, and n = 234 cells, respectively, as the treated tumors were very small. These tumor desialylation results are from one independent mouse experiment with n = 3 biological replicates (mouse tumors); and are consistent with other experiments in this work showing mouse tumor desialylation with SNA, PNA, and MAL II (Fig. 5c, and Extended Data Figs. 4c, 6, and 7a). Color bars are in units of radiant efficiency.
Extended Data Fig. 6 |
Extended Data Fig. 6 |. Representative lectin immunohistochemistry of tumor and organ slices show desialylation that can be detected in all examined organs.
Sialoglycan degradation is detectable by fluorescence microscopy of stained tumor and organ slices from the mice in Extended Data Fig. 5 treated with 500 pmol T-Sia 2. Staining with Maackia Amurensis Lectin II (MALII, top images), which preferentially binds sialic acid in an (α-2,3) linkage, reveals a dramatic decrease in fluorescent signal from binding (α-2,3) sialic acid in the tumor, comparable to positive control tissue slices treated with a sialidase cocktail ex. vivo. In the heart, kidney, and spleen, a moderate decrease in fluorescence can also be perceived. Staining with Peanut Agglutinin (PNA, middle images), which binds preferentially to exposed galactose upon desialylation, is increased in the tumor tissue upon desialylation, this effect is also quite apparent in the heart, spleen, and liver, kidney. Staining with Sambucus nigra (Elderberry Bark) lectin (SNA), which preferentially binds sialic acid in an (α-2,6) linkage, was not performed on the T-Sia 2 samples as there was consistently little to no difference between tumor staining in the PBS control mice and in tumor slices treated ex vivo with a high concentration of ST and VC sialidase, indicating that SNA signal in the tumor tissue in the mouse is either background or represents signal from glycans that are not readily cleavable by ST or VC sialidase, this finding is in agreement with tumor lectin staining by flow cytometry (Extended Data Figs. 5 and 7). All images are representative of at least n = 3 organ images per mouse taken from n = 3 different mice injected with 500 pmol T-Sia 2.
Extended Data Fig. 7 |
Extended Data Fig. 7 |. Testing the control sialidase-conjugates against the HER2+ EMT6 tumor model.
For flow cytometry analysis of sialoglycan degradation, a single 20 pmol injection of T-Sia 2, Isotype-Sia, or PBS control was injected IP into mice with subcutaneous HER2+ EMT6 cells. After four days, tumors were harvested. a, Staining with Sambucus nigra (Elderberry Bark) lectin (SNA), which preferentially binds sialic acid in an (α-2,6) linkage, did not show significant desialylation changes between these samples, n = 3 mice, geometric mean ± SD. Right: gating strategy: dead cells and tumor debris were gated out (V450-A-/SSC-A), followed by gating on size (FSC-A/SSC-A - *blue cells depict where HER2+ stained cells fall in the gate). Finally, single cells are gated with FSC-A/FSC-H. b, Growth curves of the HER2+ EMT6 tumors of mice treated with T-Sia 2 (10 mg/kg) were consistent between the first tumor growth mouse experiment (shown in red, depicted in Fig. 4c, n = 6 mice) and the second independent experiment (blue, depicted in Fig. 5d, n = 7 mice); data are reported as mean ± SD. c. Average (mean + SD) tumor growth of all the mice in Fig. 5d plotted together until the first mouse death (day 19). Mice were injected IP with PBS (n = 6), 10 mg/kg trastuzumab (tras) (n = 6), T-Sia-LOF (n = 6), Isotype-Sia (n = 6), T-FcX-Sia (n = 7), or T-Sia 2 (n = 7). A two-way ANOVA was performed with adjusted p-values from Tukey’s multiple comparisons. d, Lectin stain with PNA of exposed galactose from extracted tumor cells taken from the mice in Fig. 5d, e after mouse sacrifice. Geometric mean ± SD of PNA/ConA, (n = 5: PBS, Tras, T-Sia-LOF, T-FcX-Sia; n = 6: Isotype-Sia).
Extended Data Fig. 8 |
Extended Data Fig. 8 |. ST sialidase can cleave Siglec ligands from HER2+ B16D5 cells.
HER2+ B16D5 cells cultured in vitro bound to commercially available mouse Siglec-Fc proteins (Siglecs -E and -F-Fc). The Siglec ligands detected on the B16D5 cells were sensitive to 2 μM ST sialidase treatment for 1 h. y-axis shows cell count normalized to mode, x-axis is on a bi-exponential scale, >13,500 cells per histogram. PBS control-treated cells are shown in outlined dark blue with, ST sialidase-treated cells are colored teal, secondary only control stains are shown in gray. Gating is shown below, cells were selected by SSC-A/FSC-A gating, followed by selection of single cells by linear gating on FSC-A vs FSC-H. Data are representative of n = 3 independently performed experiments on HER2+ B16D5 cells.
Extended Data Fig. 9 |
Extended Data Fig. 9 |. HER2+ B16D5 tumor growth curves of wt and Sig-E−/− C57BL/6 mice treated with T-Sia 2 or the loss of function T-Sia-LOF.
a, Tumor growth curves of (left): wt mouse experiment 1 with n = 6 mice per group, and (right): wt mouse experiment 2 with n = 5 mice per group. b, Average tumor growth of wt and Sig-E−/− mice treated with either T-Sia 2 or T-Sia-LOF inactive control. Data shown are mean + SD until the date of the first mouse death (day 15), analyzed by RM two way ANOVA with from Tukey’s multiple comparisons test. Sample sizes are n = 11 for wt mice (T-Sia 2 and T-Sia-LOF) and n = 8 for Sig-E−/− mice (T-Sia 2 and T-Sia-LOF) c, Individual tumor growth curves with Siglec-E deficient mice (left): mouse experiment 1 (n = 6 mice per group), and (right): experiment 2 (n = 2 mice per group). d, Survival curves based on euthanasia criteria with HER2+ B16D5 tumors from Fig. 6a,b demonstrate that knocking out Siglec-E in this mouse tumor model benefits mouse survival. For T-Sia LOF-treated mice, the Sig-E−/− mice have prolonged survival compared to wt mice. For T-Sia 2-treated mice, sialoglycan degradation of the wt mice extends the survival to an outcome similar to the Sig-E−/− mice. P-values are shown from a log-rank (Mantel-Cox) test, n = 11 wt mice treated with T-Sia 2 or T-Sia-LOF, n = 8 for Sig-E−/− treated with T-Sia 2 or T-Sia-LOF.
Extended Data Fig. 10 |
Extended Data Fig. 10 |. B16D5 tumors in C57Bl/6 mice have significant infiltration of Siglec-E+ immune cells, which can largely be attributed to Siglec-E expressing CD11b+ leukocytes.
Representative histograms of tumor infiltrating leukocytes gated as shown in Supplementary Fig. 22, with Siglec-E expression on the biexponential x-axis and cell count normalized to mode (n = 10 for wt mice, n = 12 for Siglec-E deficient mice). A fluorescence minus one control (FMO, negative control that lacks the Siglec-E antibody) for each sample is shown as a black outline. Total leukocytes (defined as CD45+ cells) show a detectable increased Siglec-E expression in wild-type mice (blue) compared to Siglec-E−/− mouse controls (red). Investigating further, T cells, B cells, and NK cells (represented by CD3+, CD19+, and NK1.1+ leukocyte populations did not show significant Siglec-E expression compared to Sig-E−/− control cells, however, myeloid (CD11b+) cells, which include macrophages, granulocytes, certain dendritic cells, and monocytes, had significant anti Siglec-E signal and represent the vast majority of Siglec-E+ leukocytes in these tumors.
Fig. 1 |
Fig. 1 |. Targeted desialylation of Siglec ligands with the antibody–enzyme conjugate T-Sia 2 as a modality for immune therapy.
a,b, PD-1 (a) and Siglecs (b) are receptors that typically suppress immune cell function on ligand binding. Engagement of PD-1 and Siglec receptors leads to recruitment of SHP phosphatases to the cytosolic ITIM/ITSM domains and inhibits immune cells. APC, antigen-presenting cell. c, PD-L1 checkpoint inhibitor therapy uses antibodies to bind PD-L1 and block extracellular interactions to PD-1, inhibiting SHP recruitment and enhancing the immune response to cancer. d, Targeted desialylation with an antibody–sialidase conjugate catalytically removes a chemically diverse group of Siglec ligands and prevents SHP recruitment to the Siglec ITIM/ITSM domains. e, Representation of previously reported T-Sia 1, in which trastuzumab was conjugated to two molecules of VC sialidase. f, Illustration of T-Sia 2, where trastuzumab is linked to an average of one ST sialidase. Trastuzumab is represented by mouse IgG1 PDB 1IGY; VC sialidase, 1W0P and ST sialidase, 3SIL.
Fig. 2 |
Fig. 2 |. ST sialidase cleaves sialic acid and enhances NK cell-mediated ADCC of HER2+ cells with reduced off-target desialylation of HER2 cells.
a, MDA-MB-468 cells were treated with sialidases at various concentrations and stained with an SNA-fluorescein isothiocyanate (SNA-FITC) probe. Flow cytometry gating quantified the fraction of SNA+ (sialylated) cells and the results were fit to a four-parameter variable slope. b, Representative flow cytometry dot plots from n = 3 independent experiments of HER2+ (SK-BR-3) and HER2 (MDA-MB-468) cells treated with T-Sia 1 or trastuzumab–ST sialidase conjugate (tras ST). c, Fraction of sialylated (SNA+) cells quantified by flow cytometry gating after treatment with various concentrations of antibody–sialidase conjugates and fit to a variable four-parameter slope. d, Breast cancer cell lines were treated with 10 nM trastuzumab–ST sialidase conjugate (tras ST) or trastuzumab (tras) and mixed with IL-2 activated human NK cells at E/T = 8 and NK cell-mediated ADCC was quantified by LDH assay after 4 h. Mean ± s.d. is reported along with multiplicity-adjusted P values from two-tailed t-tests with the Holm–Sidak correction at α = 0.05. All figures represent n = 3 independent experimental replicates.
Fig. 3 |
Fig. 3 |. Synthesis of T-Sia 2.
a, T-Sia 2 scheme: (i) Trastuzumab with heavy-chain formylglycine residues was reacted with 20 equiv. HIPS–azide 1 in citrate buffer pH 5.5. (ii) ST sialidase was site-selectively reacted with 20 equiv. α-chloroacetamide–DBCO 2 under mildly reducing conditions. (iii) Sialidase-DBCO and trastuzumab-azide were coupled via copper-free click chemistry to form T-Sia 2. b, SDS–PAGE gel with nonreducing buffer (left) and reducing buffer (right) of sialidase-DBCO, trastuzumab–HIPS–azide and T-Sia 2; data is representative of n = 3 independently run gels. c, Representative HPLC trace from n = 3 independent experimental replicates of T-Sia 2, absorbance detected at 280 nm. LC, antibody light chain; HC, antibody heavy chain; HC–ST, antibody heavy chain conjugated to ST sialidase.
Fig. 4 |
Fig. 4 |. T-Sia 2 degrades sialoglycans and slows tumor growth in a HER2+ EMT6 syngeneic mouse breast cancer model that is resistant to trastuzumab alone.
a, HER2+ EMT6 cells were treated with PBS, 10 nM trastuzumab (Tras) or 10 nM of T-Sia 2. Human NK cells were added at a ratio of 3:1 and ADCC was quantified by flow cytometry after 4 h and subtracting PBS controls. A paired two-tailed t-test is shown for n = 3 independent biological replicates of different NK cell donors. b, HER2+ EMT6 cells were injected into the mammary fat pad of Balb/c mice. Starting on day 8, mice were injected i.p. every 2–4 d with PBS (n = 5), trastuzumab (Tras, 15 mg kg−1, n = 6) or T-Sia 2 (10 or 15 mg kg−1, n = 6). c, Individual growth curves of the HER2+ EMT6 tumors in mice. d, Survival curve for animals described in b; statistics were a log-rank (Mantel–Cox) test comparing T-Sia 2 (10 mg kg−1) with trastuzumab. e, For T-Sia 2 histology, s.c. HER2+ EMT6 were injected, followed by i.p. injection of T-Sia 2 or PBS at day 5 and killed on day 9. f, Fluorescent images of tumor slices of the mice treated in e, with PBS, 500 pmol (~5 mg kg−1) T-Sia 2, or a positive control of tumor slices treated ex vivo with a sialidase cocktail. Slides were stained with biotinylated PNA or MALII lectin followed by streptavidin-647. Images are representative of an experiment with n = 3 mice per group; scale bar, 100 μm, lower-right image, more images from this experiment are in Extended Data Fig. 6.
Fig. 5 |
Fig. 5 |. Active sialidase is essential for T-Sia 2 efficacy in mice and HER2 targeting is advantageous, but antibody-FcγR recruitment and ADCC are negligible contributors to an anticancer immune response with sialoglycan degraders in vivo.
a, Schematic of the antibody–sialidase conjugate controls. b, NK cell-mediated ADCC of ZR-75–1 cancer cells treated with antibody conjugates, E/T = 3, detecting percentage cytotoxicity by LDH release after 8 h of n = 3 experimental replicates, a one-site-specific binding least-squares fit was modeled onto the data with GraphPad Prism. c, For flow cytometry analysis, a single 20-pmol injection of T-Sia 2, Isotype-Sia or PBS control was injected i.p. into mice with s.c. HER2+ EMT6 cells. Tumors were harvested 4-d postinjection. Flow cytometry with PNA, which binds to galactose residues exposed on sialidase treatment is shown on the left and MALII binding of α-2,3-linked sialic acid is shown on the right for n = 3 mice per group, geometric mean ± s.d., analyzed by ordinary one-way ANOVA with multiplicity-adjusted P values from Tukey’s multiple comparisons test. d, HER2+ EMT6 cells were injected into the mammary fat pad of Balb/c mice. Mice were injected i.p. with PBS (n = 6), 10 mg kg−1 of trastuzumab (tras) (n = 6), T-Sia-LOF (n = 6), Isotype-Sia (n = 6), T-FcX-Sia (n = 7) or T-Sia 2 (n = 7), every 2–4 d for four total injections. Individual tumor growth curves for these mice are shown until day 41. e, Kaplan–Meier plot of the survival based on euthanasia criteria of mice in d with P values from log-rank (Mantel–Cox) tests shown.
Fig. 6 |
Fig. 6 |. T-Sia 2 therapy is dependent on functional Siglec-E, a receptor highly expressed on tumor-infiltrating myeloid cells.
ac, HER2+ B16D5 cells were injected s.c. (a) into either WT C57BL/6 mice (b) or Sig-E−/− C57BL/6 mice (c). Mice were injected four times i.p. with 10 mg kg−1 T-Sia 2 (n = 11 WT, n = 8 Sig-E−/−) or the inactive T-Sia-LOF (n = 11 WT, n = 8 Sig-E−/−). Survival curves are displayed indicating when euthanasia criteria were reached, P values are shown from a log-rank (Mantel–Cox) test. Data are from n = 2 independent mouse experiments and individual growth curves are reported in Extended Data Fig. 9. d, Percentage of tumor-infiltrating leukocytes (CD45+) and myeloid cells (CD11b+ of CD45+) that are Siglec-E+ by flow cytometry with background staining subtracted. Mean values ± s.d. are reported along with multiplicity-adjusted P values from two-tailed t-tests with the Holm–Sidak correction at α = 0.05 from n = 10 WT mice and n = 12 Sig-E−/− mice. Myeloid cells (CD11b+) can include macrophages, dendritic cells, monocytes and granulocytes.

Comment in

  • Targeted self-destruction.
    Rodrigues E, Macauley MS. Rodrigues E, et al. Nat Chem Biol. 2020 Dec;16(12):1281-1283. doi: 10.1038/s41589-020-0612-z. Nat Chem Biol. 2020. PMID: 32807963 No abstract available.

References

    1. Schadendorf D et al. Pooled analysis of long-term survival data from phase II and phase III trials of ipilimumab in unresectable or metastatic melanoma. J. Clin. Oncol 33, 1889–1894 (2015). - PMC - PubMed
    1. Ribas A et al. Association of pembrolizumab with tumor response and survival among patients with advanced melanoma. J. Am. Med. Assoc 315, 1600–1609 (2016). - PubMed
    1. Sharma P, Hu-Lieskovan S, Wargo JA & Ribas A Primary, adaptive, and acquired resistance to cancer immunotherapy. Cell 168, 707–723 (2017). - PMC - PubMed
    1. Marin-Acevedo JA et al. Next generation of immune checkpoint therapy in cancer: new developments and challenges. J. Hematol. Oncol 11, 39 (2018). - PMC - PubMed
    1. Li C-W et al. Eradication of triple-negative breast cancer cells by targeting glycosylated PD-L1. Cancer Cell 33, 187–201 (2018). - PMC - PubMed

Publication types

MeSH terms