. 2020 Sep;52(9):891-897.
doi: 10.1038/s41588-020-0678-2. Epub 2020 Aug 17.

Extrachromosomal DNA is associated with oncogene amplification and poor outcome across multiple cancers

Affiliations

Extrachromosomal DNA is associated with oncogene amplification and poor outcome across multiple cancers

Hoon Kim et al. Nat Genet. 2020 Sep.

Abstract

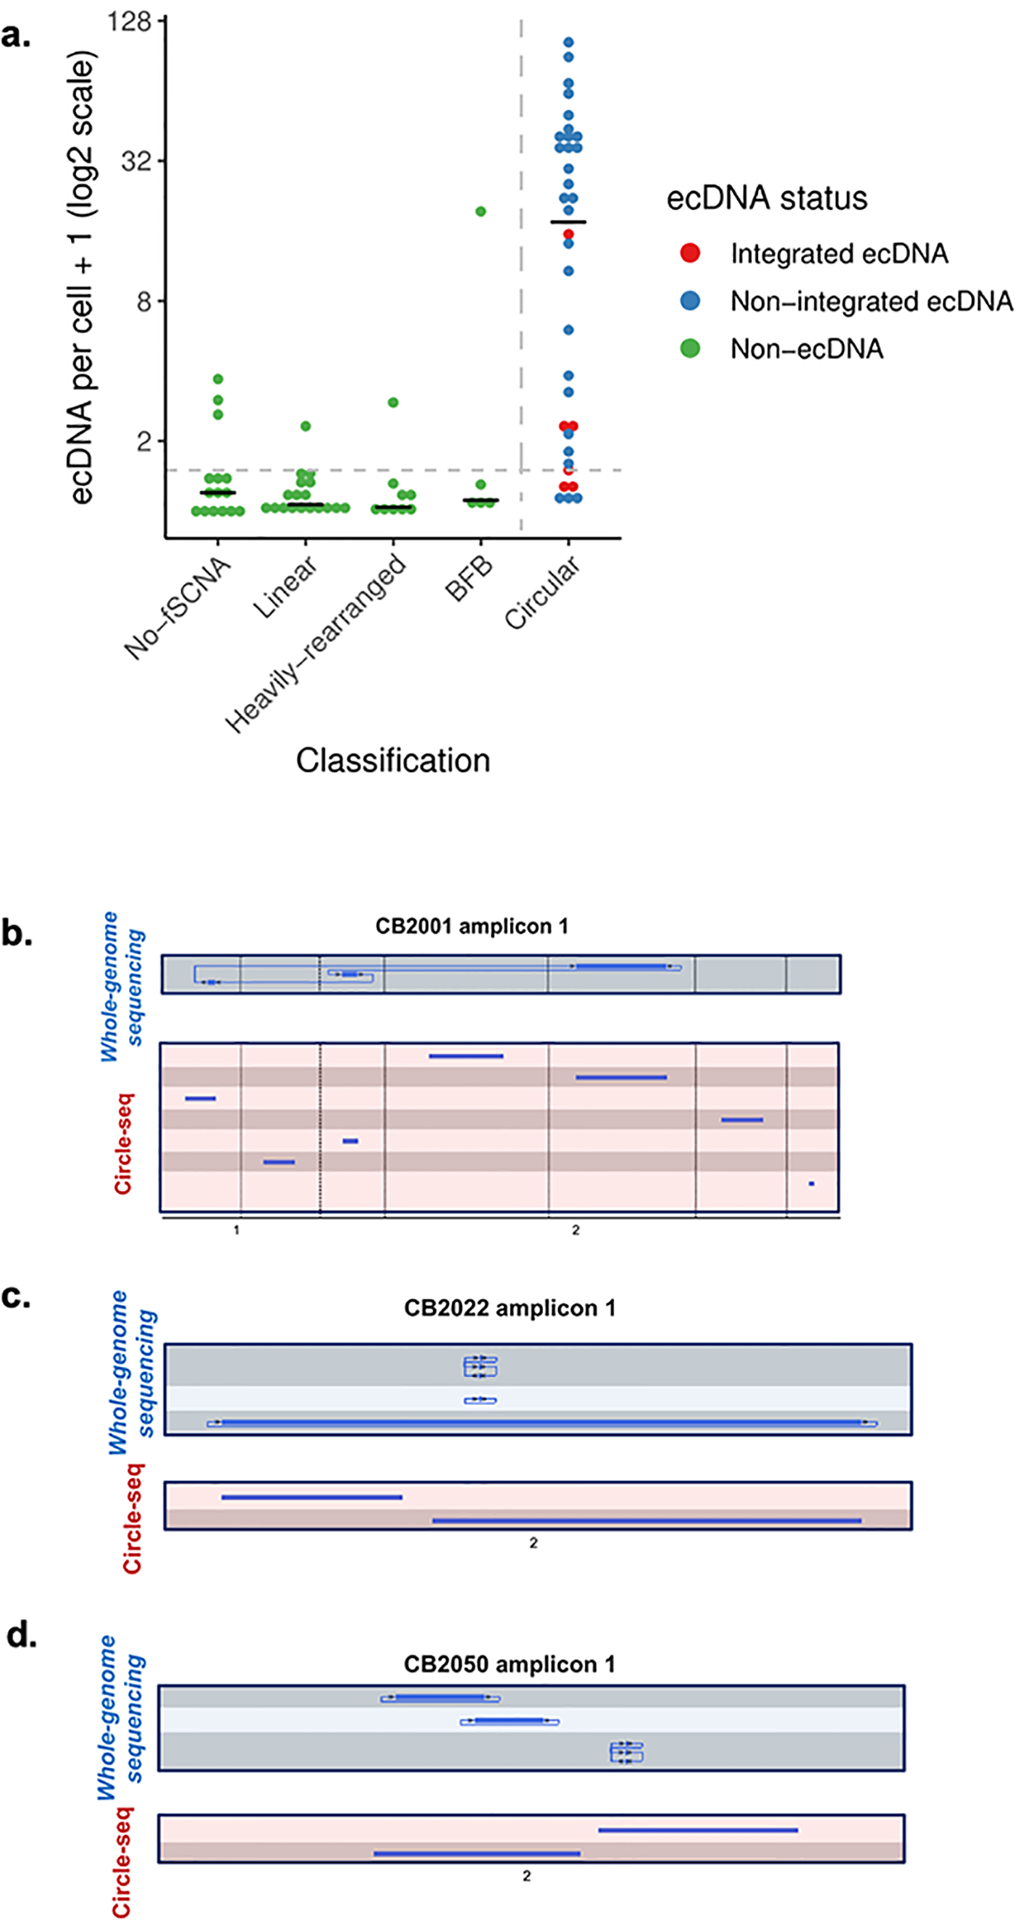
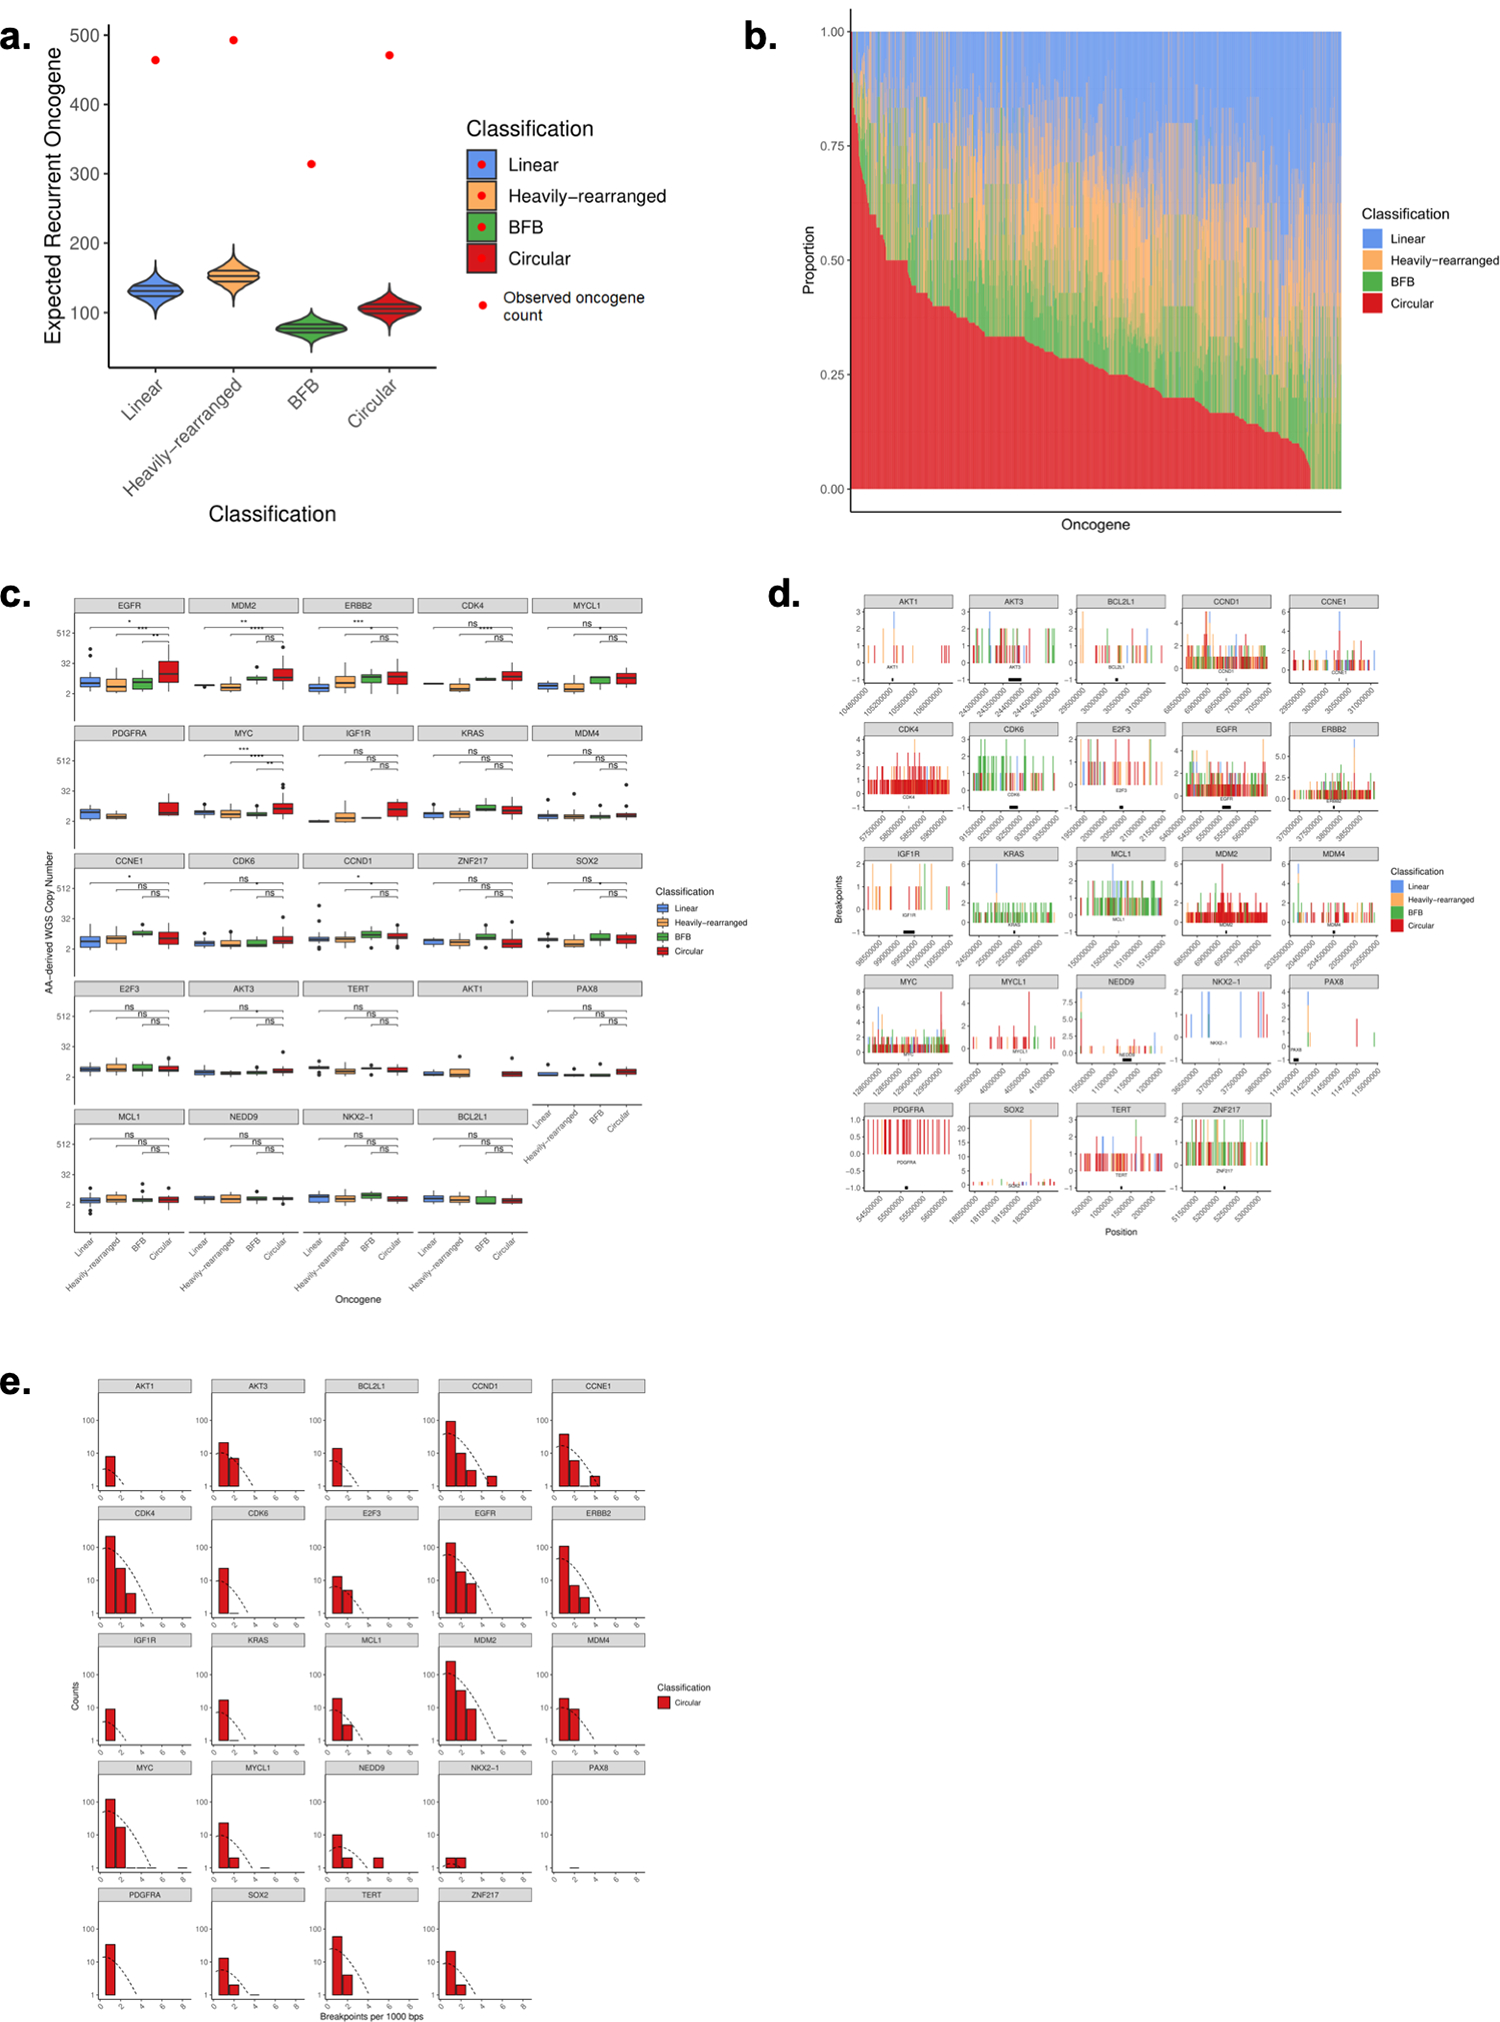
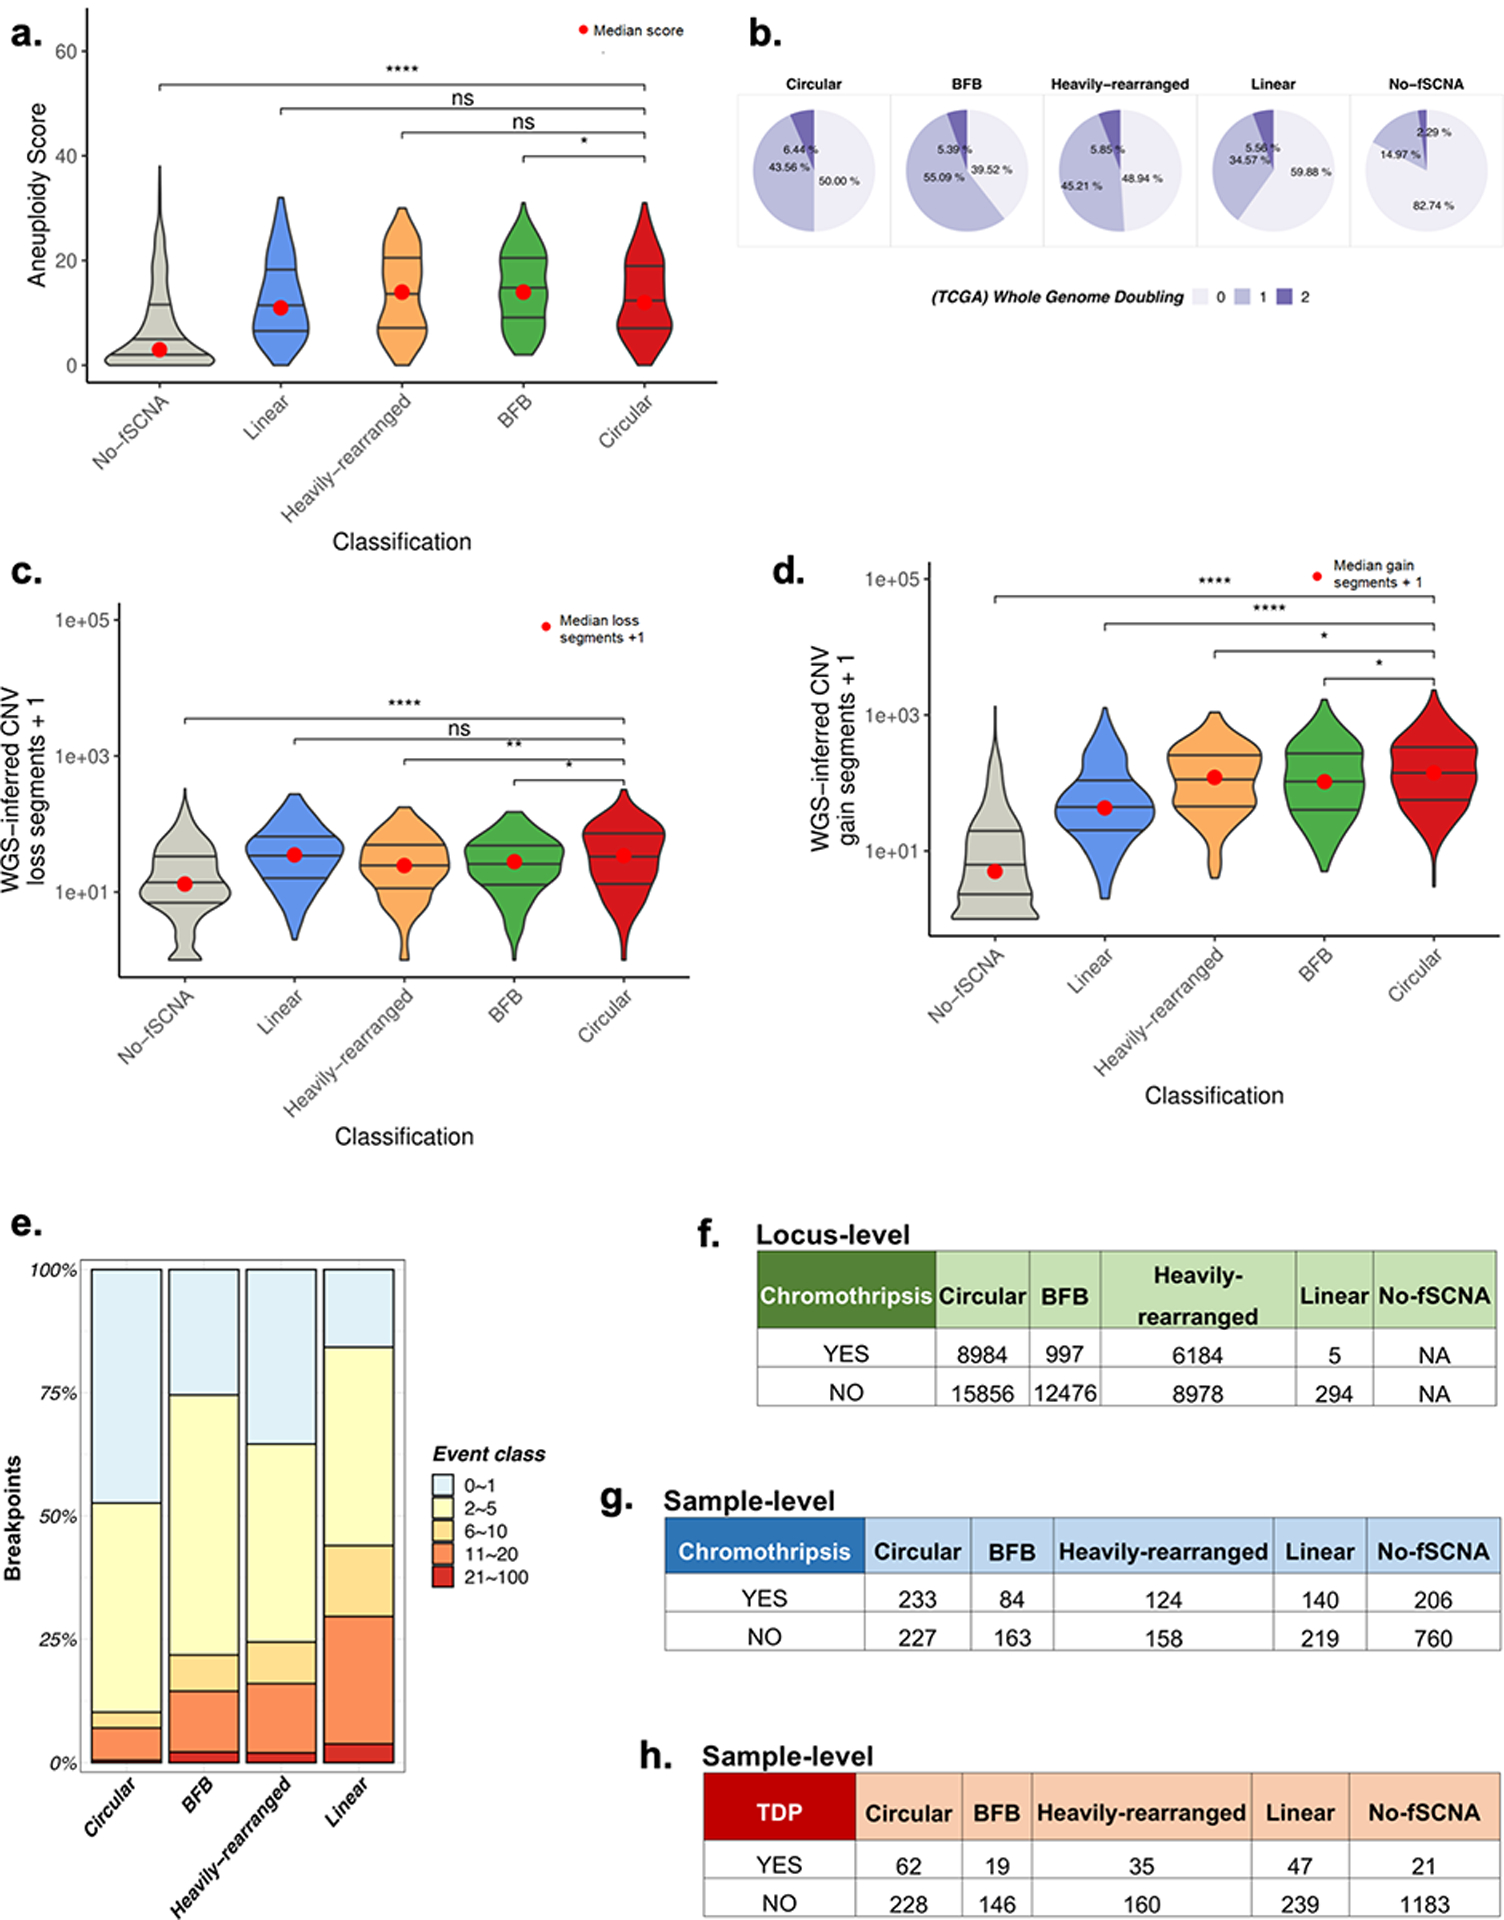
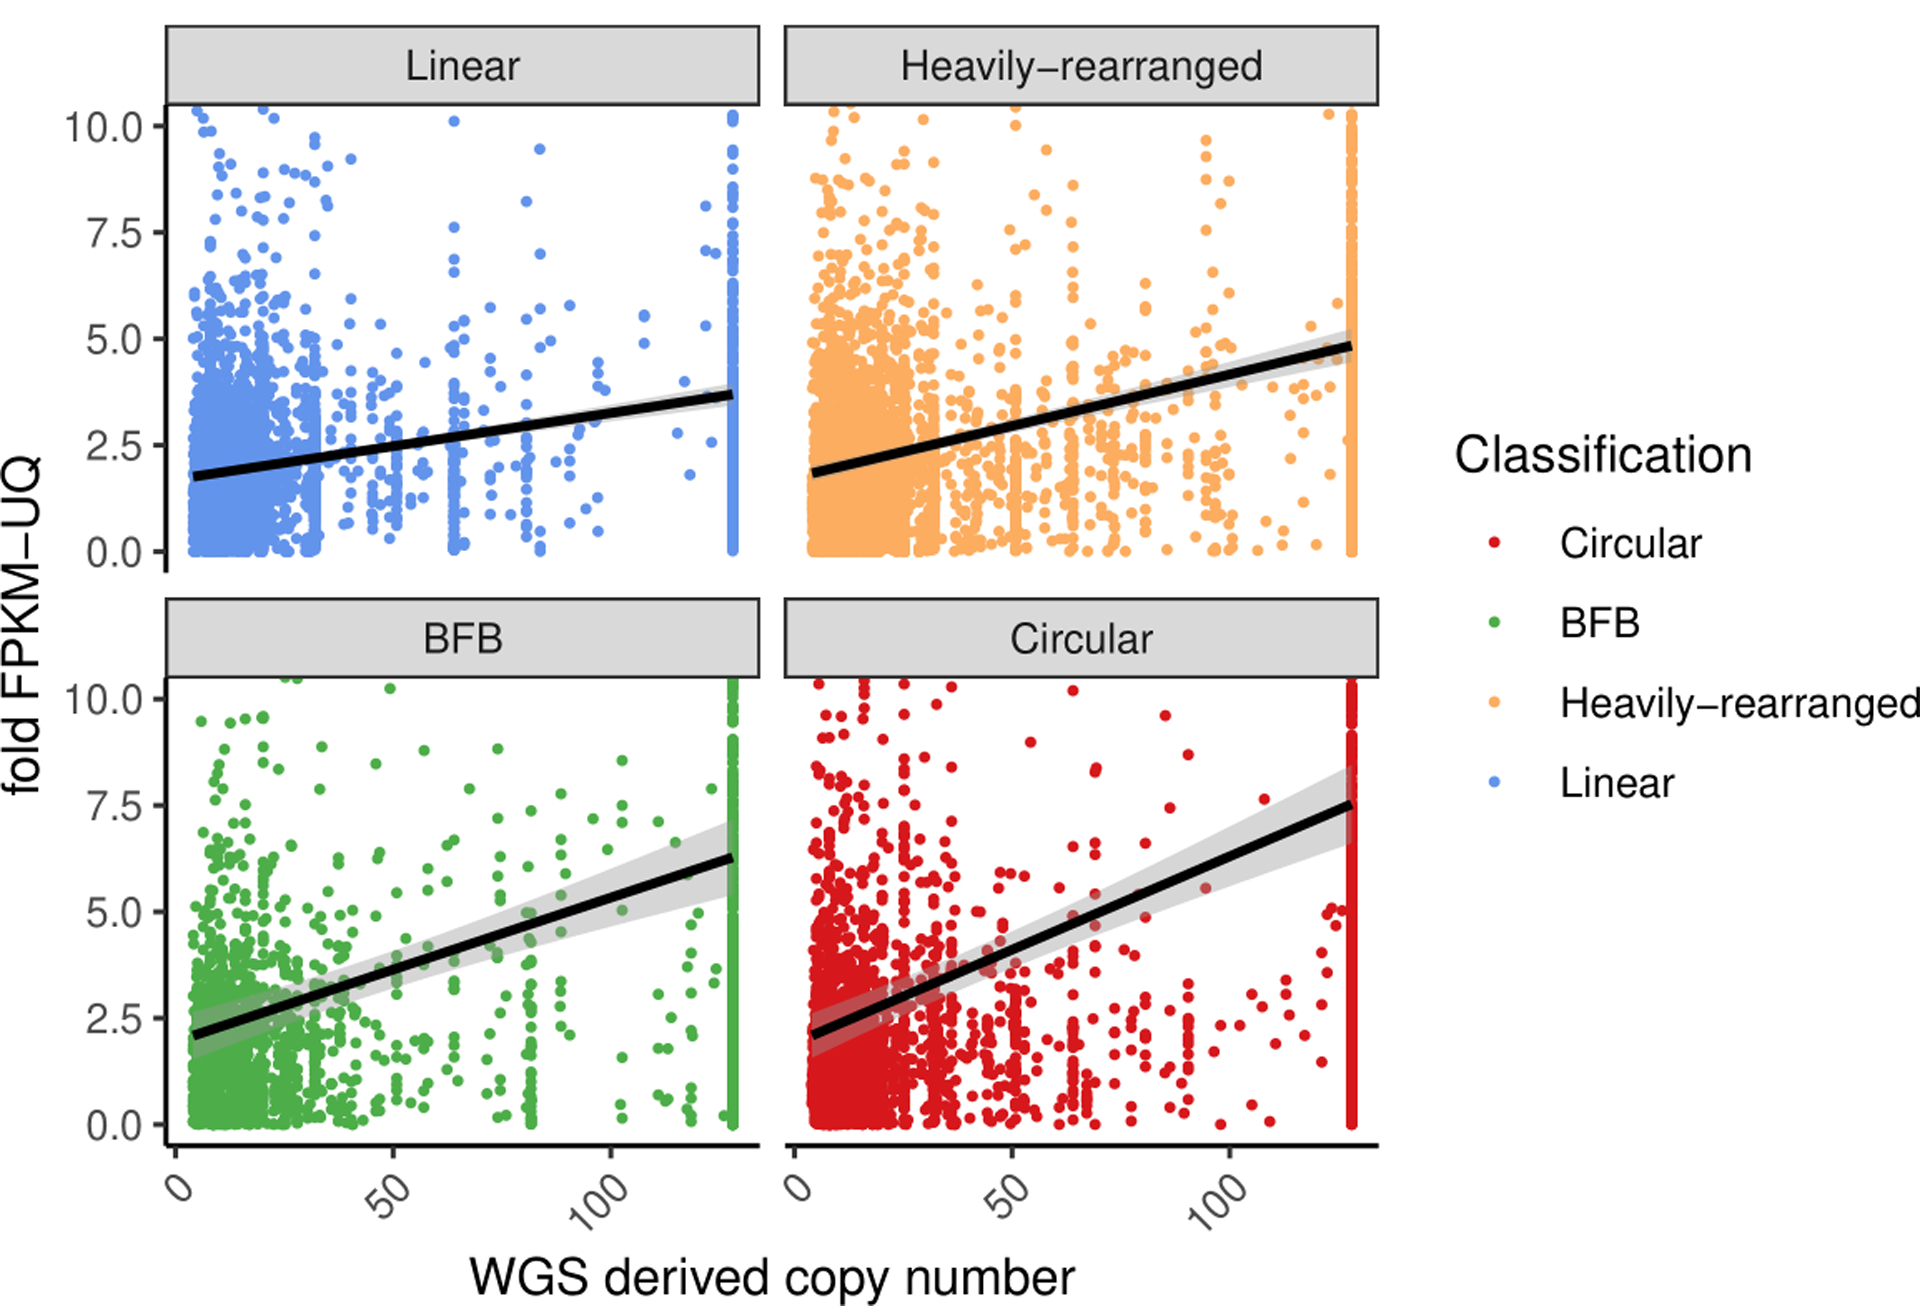
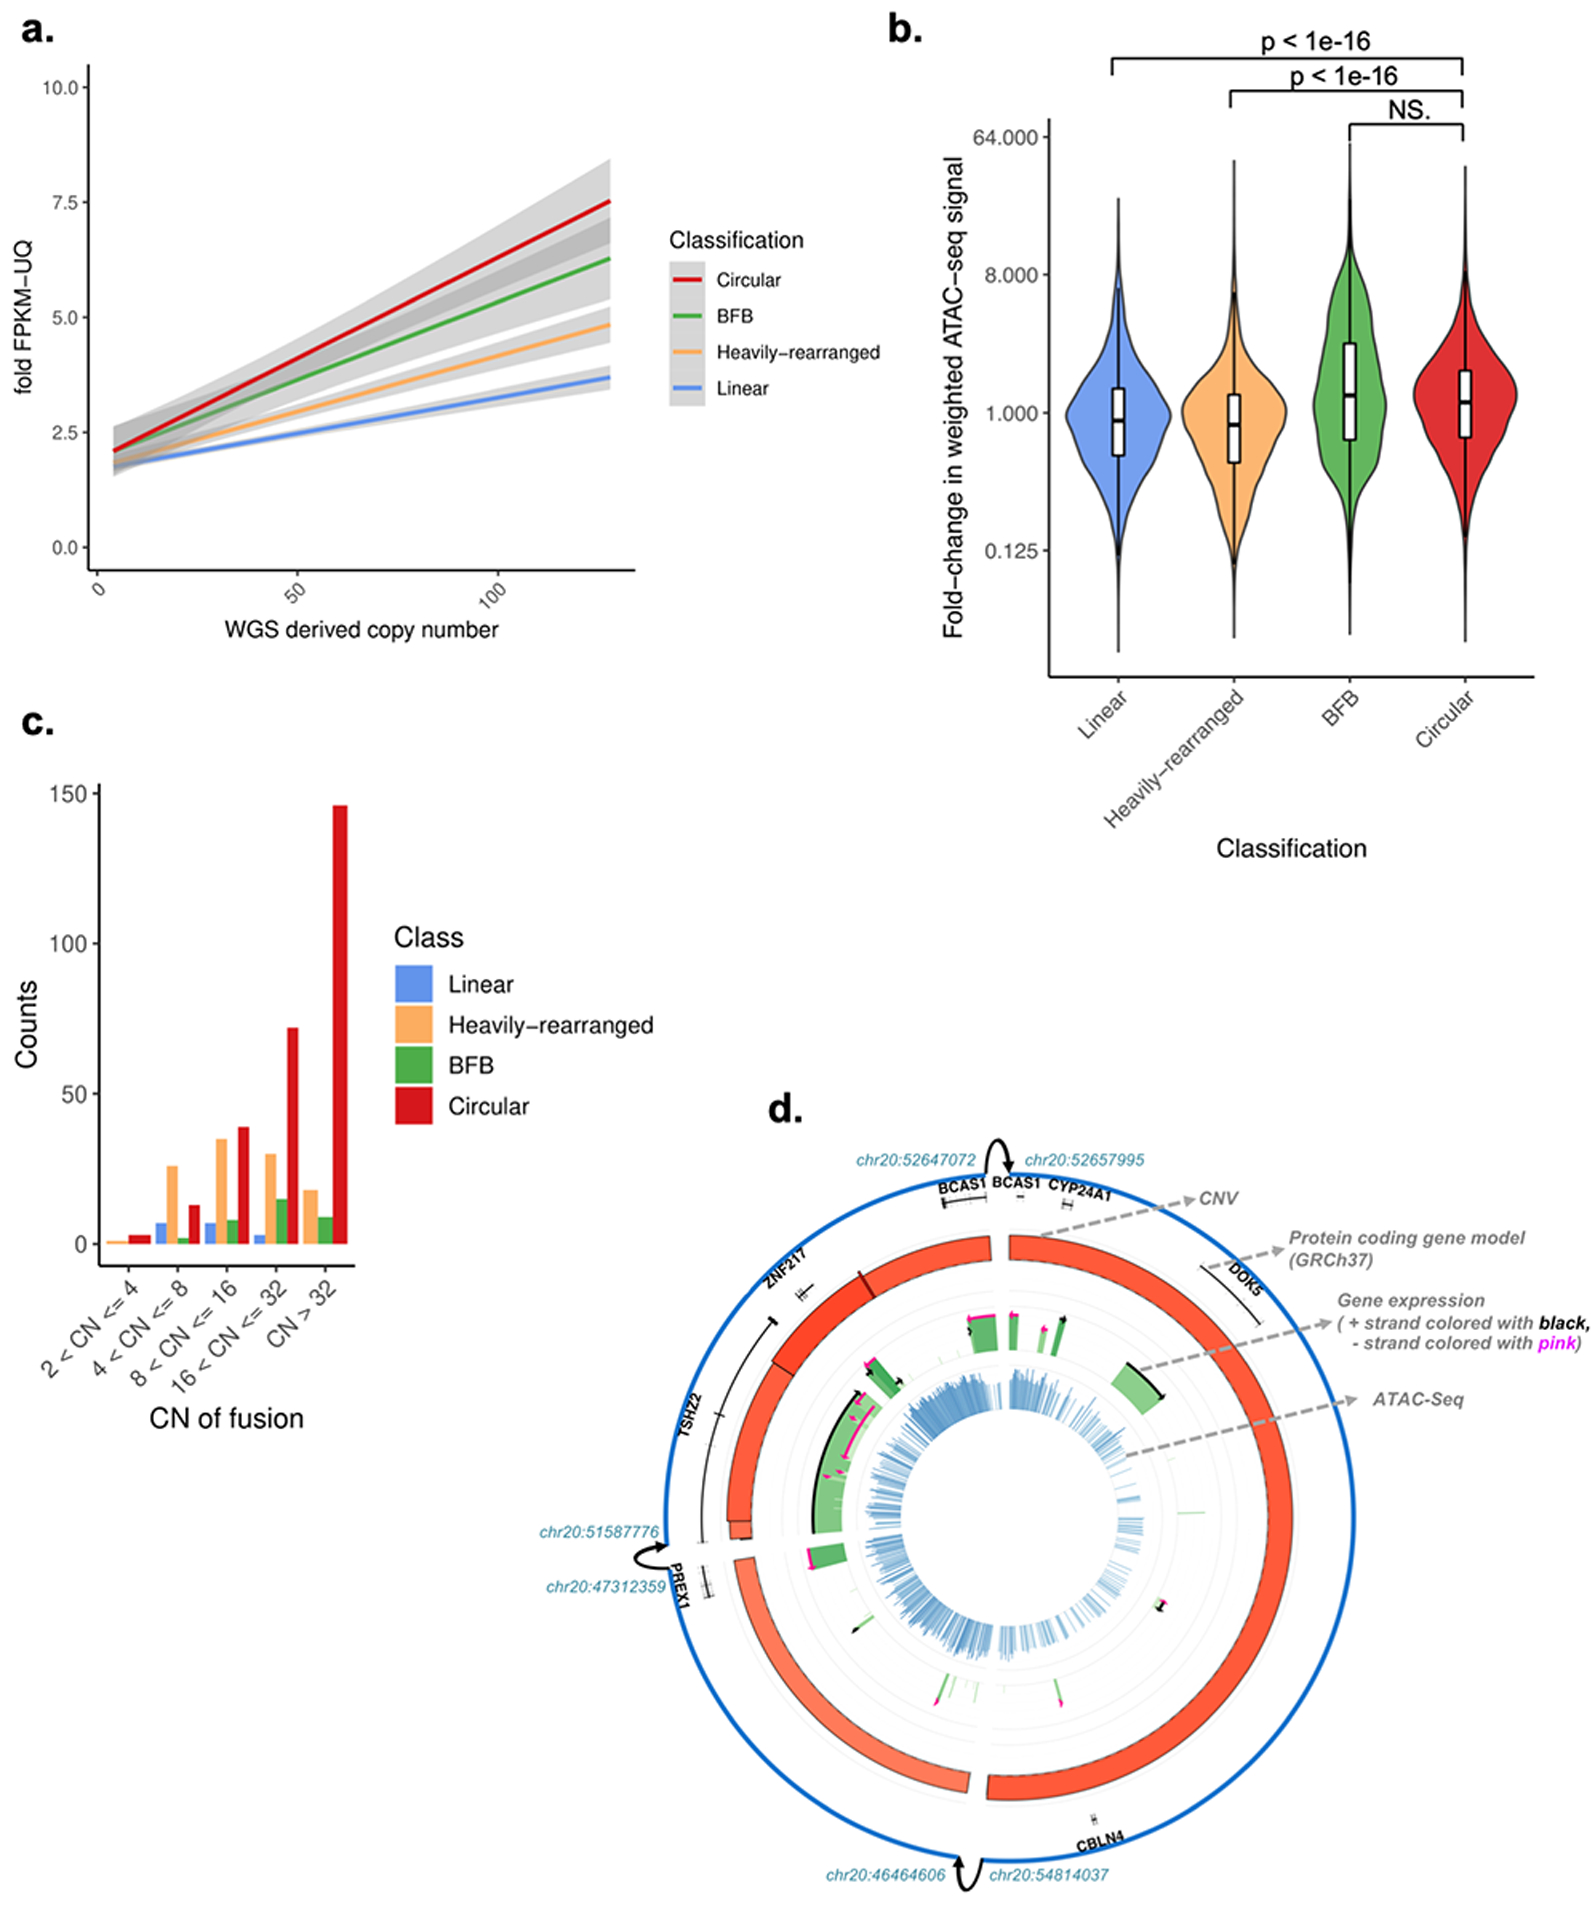
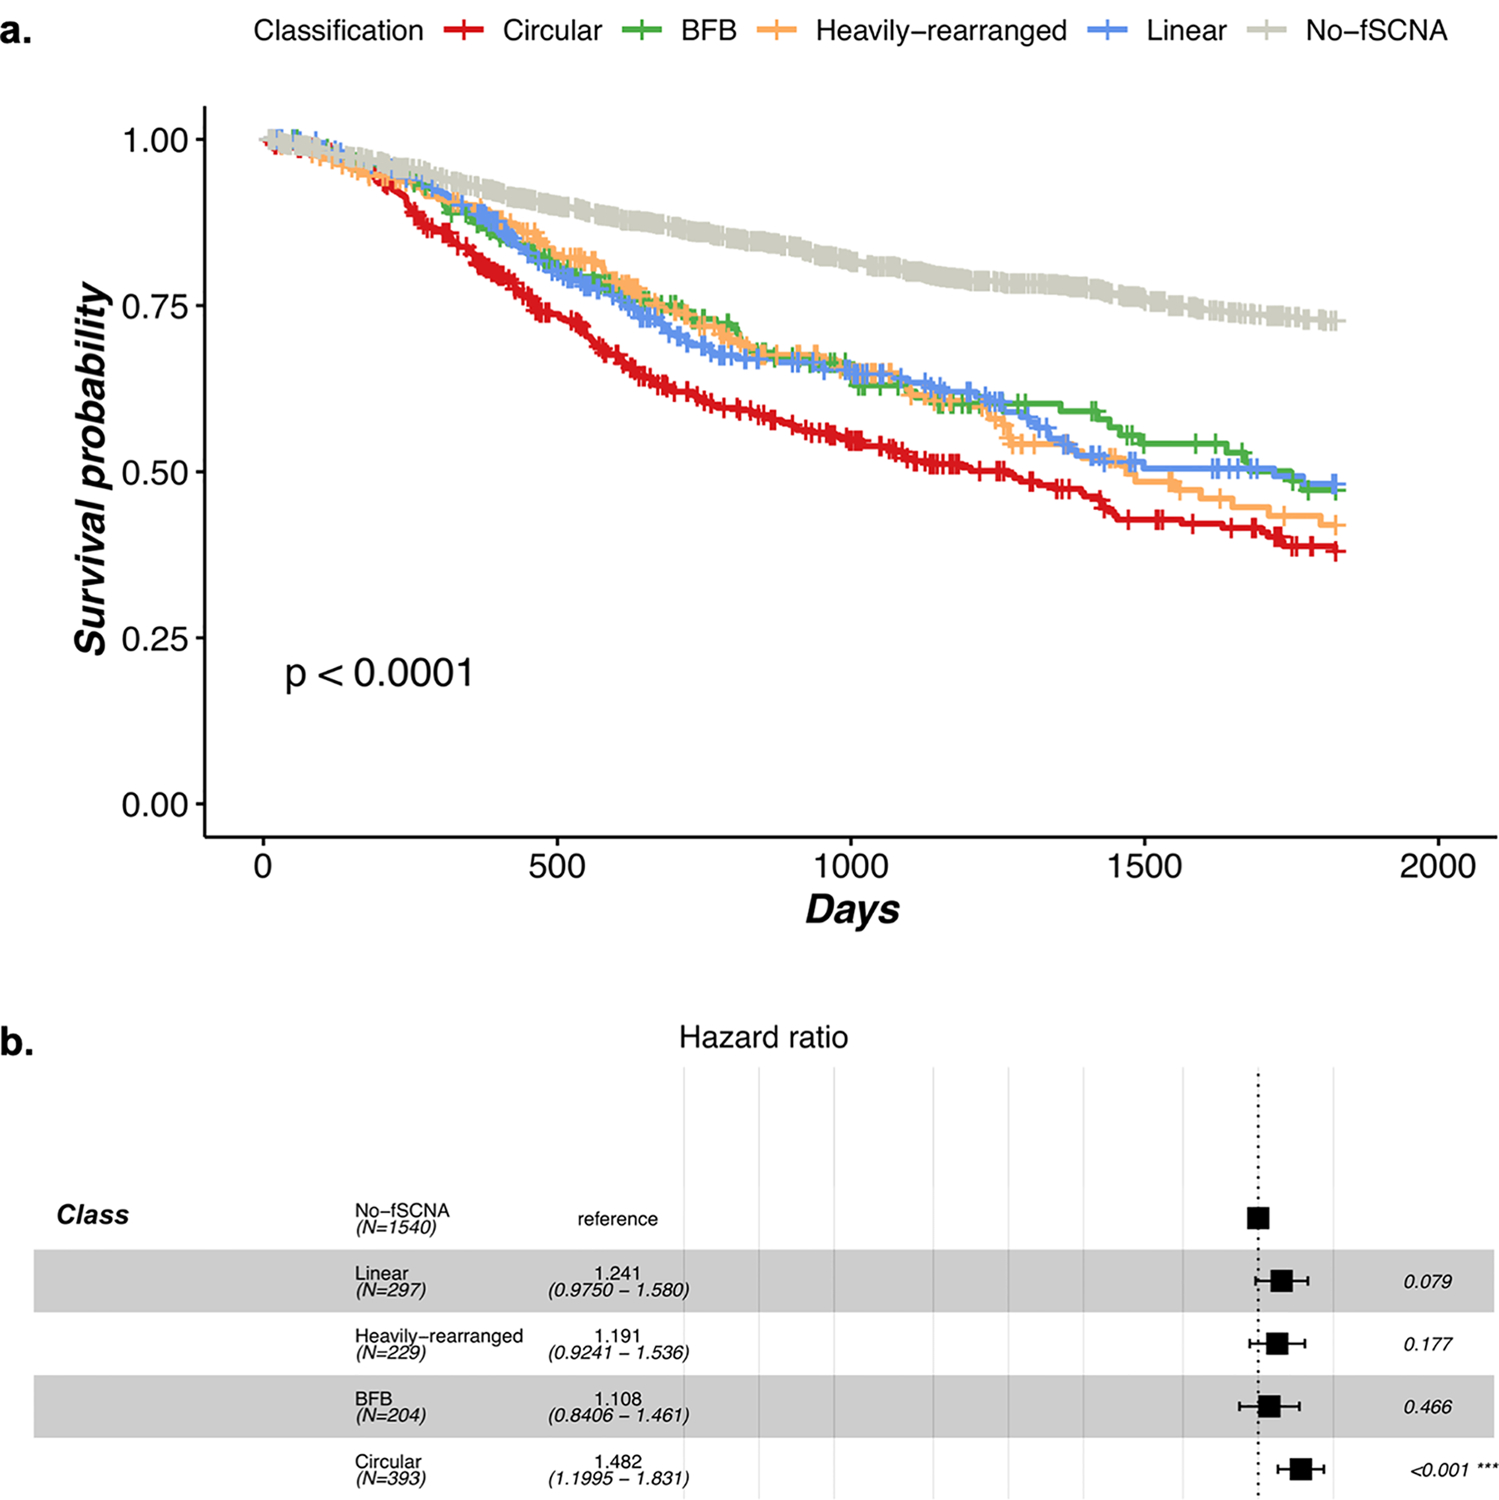
Extrachromosomal DNA (ecDNA) amplification promotes intratumoral genetic heterogeneity and accelerated tumor evolution1-3; however, its frequency and clinical impact are unclear. Using computational analysis of whole-genome sequencing data from 3,212 cancer patients, we show that ecDNA amplification frequently occurs in most cancer types but not in blood or normal tissue. Oncogenes were highly enriched on amplified ecDNA, and the most common recurrent oncogene amplifications arose on ecDNA. EcDNA amplifications resulted in higher levels of oncogene transcription compared to copy number-matched linear DNA, coupled with enhanced chromatin accessibility, and more frequently resulted in transcript fusions. Patients whose cancers carried ecDNA had significantly shorter survival, even when controlled for tissue type, than patients whose cancers were not driven by ecDNA-based oncogene amplification. The results presented here demonstrate that ecDNA-based oncogene amplification is common in cancer, is different from chromosomal amplification and drives poor outcome for patients across many cancer types.


Conflict of interest statement

COMPETING INTERESTS

H.Y.C., P.S.M., V.B. and R.G.W.V. are scientific co-founders of Boundless Bio, Inc. (BBI), and serve as consultants. V.B. is a co-founder, and has equity interest in Digital Proteomics, LLC (DP), and receives income from DP. The terms of this arrangement have been reviewed and approved by the University of California, San Diego in accordance with its conflict of interest policies. N.P. N. and K.T. are employees of Boundless Bio, Inc.

Figures

Extended Data Fig. 1
Extended Data Fig. 1. Amplicon classification
A. Validation on cell line data. Validation of the classification scheme on cell line data with FISH experiments for detecting ecDNA from the Turner et al. and deCarvalho et al. studies, in addition to newly generated data. FISH probes were designed for selected oncogenes and DAPI staining was performed to determine whether the FISH probe landed on chromosomal DNA or ecDNA. For each cell (represented as an image of the cell in metaphase), the number of positive ecDNA probes were counted, and for each cell line, the average positive ecDNA per cell was reported. For each probe, we report whether it landed in an amplicon (inferred from AmpliconArchitect), and if so, what was the amplicon’s classification. The distribution for the average ecDNA per cell between the Circular and non-circular classes was statistically significantly different (p-value < 1e-9; Wilcoxon rank sum test). B, C and D. Whole-genome sequencing derived based Circular amplicon regions (blue) were validated with Circle-seq (red) for three neuroblastoma samples (CB2001, CB2022, and CB2050, respectively) used in the Koche et al. study.
Extended Data Fig. 2
Extended Data Fig. 2. Circular vs amplified non-circular amplification comparisons
A. 24 recurrently amplified oncogenes significantly overlap circular regions (z-score 37.8), especially compared to amplified non-circular regions (z-scores of 30.4, 29.5, 28.0 for Linear, Heavily-rearranged, and BFB). B. For all oncogenes on amplicons with copy number >= 4 and present in at least 5 samples across the cohort, we show the class distribution of that oncogene. The oncogenes are ordered by proportion on circular amplification. C. For the 24 recurrent oncogenes known to be activated via amplification (Zack et al. Nat Gen. 2013), we report the average copy number for the oncogenes for circular amplification versus amplified-noncircular amplification. D. Breakpoint location across all samples for each recurrently amplified oncogene. We identified all breakpoints from each sample containing the recurrent oncogene on ecDNA and report the total number of breakpoints across this region in 1kb binned windows. E. Distribution of breakpoint locations across all circular samples for each recurrently amplified oncogene. We identified all breakpoints from each sample containing the recurrent oncogene on ecDNA. Shown is the distribution of the number of breakpoints in each bin, which closely follows a Poisson distribution, suggesting that the breakpoints are mostly randomly distributed across the region.
Extended Data Fig. 3
Extended Data Fig. 3. Genome instability vs amplicon classes
A. Chromosome arm aneuploidy scores showing no or marginal difference in chromosomal arm level events between circular and non-circular amplification classes. B. Genome doubling events by amplification class. C. Distribution for total DNA loss segments by amplification class. WGS-inferred CNV data was used to count the total number of DNA losses within a sample. A DNA loss was defined as a segment with CN < 2. D. Distribution for total DNA gain segments by amplification class. WGS-inferred CNV data was used to count the total number of DNA gains within a sample. A DNA gain was defined as a segment with CN > 2. Circular samples contain statistically significantly more DNA gains than BFB, Heavily-rearranged, Linear, and No-fSCNA (p-value <0.03, <0.03, <1e-20, and <1e-111, respectively; Wilcox Rank Sum Test). E. Breakpoint homology by amplification class. F. Comparison of amplicon versus locus-level chromothripsis (Pearson′s Chi-squared test data: X-squared = 4674.7, df = 3, p-value < 2.2e-16). G. Comparison of sample category versus sample-level chromothripsis (Pearson′s Chi-squared test data: X-squared = 21.58, df = 3, p-value 8e-05 (excludes ‘No fSCNA detected’ category)). H. Comparison of sample category versus sample-level tandem duplication (Pearson′s Chi-squared test data: X-squared = 7.39, df = 3, p-value 0.06 (excludes ‘No fSCNA detected’ category)).
Extended Data Fig. 4
Extended Data Fig. 4. Gene expression of amplicon classes
Copy number of the oncogene versus its fold-change in FPKM for all oncogenes with a copy count greater than 4, for each oncogene on each amplicon. The fold-change in FPKM is computed as the oncogene’s (FPKM-UQ+1) divided by the average of (FPKM-UQ+1) for the same oncogene in all other tumor samples from the same cohort for which the oncogene is not on any amplicon (i.e., not amplified). Linear regression lines, using fold change = m*CNV+b where m and b are selected to minimize error of the fit, are shown for each class. Tukey′s range test shows oncogenes on circular structures are significantly different to oncogenes on non-circular structures (p-value < 1e-7).
Extended Data Fig. 5
Extended Data Fig. 5. Lymph node stage vs amplicon classes
Lymph node stage for primary tumors showing samples with amplification are more likely to have spread to the lymph node at time of diagnosis (Chi-square test; df=4; p-value < 1e-05).
Extended Data Fig. 6
Extended Data Fig. 6. Cell cycle and immune infiltrate gene expression signatures vs amplicon classes
A. Cell Cycle gene expression signature single sample GSEA (ssGSEA) scores by amplification category. B. Immune infiltrate gene expression signature single sample GSEA (ssGSEA) scores by amplification category.
Fig. 1 |
Fig. 1 |. Frequency of circular amplification across tumor and non-tumor tissues.
A. Schematic representation of the four classification categories. All DNA regions with a copy number of 4 or greater than ploidy and comprising at least 10 kb were classified using a hierarchical scheme based on the AmpliconArchitect amplicon reconstruction as well as the types of discordant breakpoint edges in the region. The four categories are defined as follows - 1) Linear amplicon: an amplicon that contains amplified segments with either no discordant edges or with edges suggesting deletions smaller than 1 Mb. 2) Heavily-rearranged amplicon: an amplicon which contains amplified segments connected by discordant breakpoint edges suggesting higher-order rearrangements beyond small deletions - such as inversions, interchromosomal edges or deletions > 1Mbp. 3) Breakage-fusion-bridge (BFB) amplicon: an amplicon having a proportion of foldback reads in excess of 25%, and which may have signatures of heavily rearranged or circular amplification. 4) Circular amplicon: an amplicon which contains one or more genomic segments forming a cyclic path of at least 10 kbp and 4+ copies. B. Left panel: Comparison of whole-genome sequencing derived circular DNA amplicon and Circle-seq derived segments. Right panel: Circular amplicons detected from whole-genome sequencing with AmpliconArchitect were validated with Circle-seq. N: not validated by Circle-Seq. C. Distribution of circular, BFB, Heavily-rearranged, Linear, and no focal somatic copy number amplification detected (No-fSCNA) amplicon categories by tumor and normal tissue, across 3,731 tumor and non-neoplastic sample derived whole-genomes from TCGA and 1,291 whole-genomes from PCAWG.
Fig. 2 |
Fig. 2 |. Oncogene content and structural component of circular amplification.
A. Genome-wide distribution of amplification peaks by amplicon class. Amplifications were counted per 1Mb bin and are shown as a fraction of the total number of samples per amplicon class. B. Classification of amplification status by gene. Shown are the 24 most frequently amplified oncogenes. C. Breakpoint locations (right) and distribution of breakpoints (left) across all circular samples with amplified CCND1 (top), EGFR (middle), and MYC (bottom). Breakpoints were identified in each sample containing the amplified oncogene region. Shown are the total number of breakpoints across this region in 1kb binned windows (right). The distribution of the number of breakpoints in each bin closely follows a Poisson distribution (left), suggesting that the breakpoints are mostly randomly distributed across the region. D. The number of genome-wide DNA segments within a sample was compared between Circular, BFB, Heavily-rearranged, Linear, and No-fSCNA detected classes. Circular samples contained statistically significantly more DNA segments than non-circular samples (p-value 0.0046, 7.2e-6, 2.4e-19 and 9.4e-125, respectively; Wilcox Rank Sum Test (two-sided)).
Fig. 3 |
Fig. 3 |. Gene expression and chromatin accessibility of amplicon classes.
A. Copy number of oncogene versus its fold-change in Fragments Per Kilobase of transcript per Million mapped reads upper quartile (FPKM-UQ) for all oncogenes with a copy count greater than 4, for each oncogene on each amplicon. The fold-change in FPKM-UQ is computed as the oncogene’s (FPKM-UQ+1) divided by the average of (FPKM-UQ+1) for the same oncogene in all other tumor samples from the same cohort for which the oncogene is not on any amplicon (i.e., not amplified). Linear regression lines, using fold change = m*copy number+b, and their 95% confidence level intervals (in grey) are shown for each class. Tukey’s range test shows oncogenes on circular structures are significantly different to oncogenes on non-circular structures (p-value < 1e-7). WGS: whole-genome sequencing. B. For each of the 36 The Cancer Genome Atlas (TCGA) samples with Assay for Transposase-Accessible Chromatin using sequencing (ATAC-seq) profiles and AmpliconArchitect results, the copy-number normalized fold-change in ATAC-seq signal in each ATAC-seq peak that overlaps with the amplicon relative to tissue types without amplification within the same peak is shown. The distribution of fold-change for Circular amplicons is statistically significantly higher than Linear and Heavily-rearranged amplicons (Wilcoxon rank sum test (two-sided); p-value < 1e-16). Y-axis is on log(2) scale. Box plots are defined as 25th, 50th and 75th percentiles, respectively. Y-axis is on log(2) scale. NS: not significant. C. Circular structures expressed significantly more gene fusions compared to non-circular amplicons, after size normalization. CN: copy number. D. Representative Circos-plot showing (rings from outside to inside) 1) Amplicon regions identified by AmpliconArchitect, where interconnected breakpoints were indicated with arrows; 2) DNA copy-number, where height and color represent level (darker red means higher copy number amplification); 3) FPKM expression values in green, where height and color represent expression level (darker green means higher expression); 4) ATAC-seq chromatin accessibility in blue, where height and color represent expression level (darker blue means more accessible). CNV: Copy Number Variation.
Fig. 4 |
Fig. 4 |. Presence of circular amplification associates with poor outcomes.
A. Kaplan-Meier five-year survival curves by amplification category. Patients whose tumors contain at least one Circular amplicon have significantly worse outcome compared to patients whose tumors were classified as non-circular. The p-value comparing survival curves was based on a log-rank test. B. Multivariate Cox-Hazard model, incorporating disease and patient cohorts as parameters showing circular amplification results in significantly higher hazard ratios. The error bars represent 95% confidence intervals of the hazard ratio.

Comment in

References

    1. deCarvalho AC et al. Discordant inheritance of chromosomal and extrachromosomal DNA elements contributes to dynamic disease evolution in glioblastoma. Nat Genet 50, 708–717 (2018). - PMC - PubMed
    1. Turner KM et al. Extrachromosomal oncogene amplification drives tumour evolution and genetic heterogeneity. Nature 543, 122–125 (2017). - PMC - PubMed
    1. Verhaak RGW, Bafna V & Mischel PS Extrachromosomal oncogene amplification in tumour pathogenesis and evolution. Nat Rev Cancer (2019). - PMC - PubMed
    1. Weischenfeldt J et al. Pan-cancer analysis of somatic copy-number alterations implicates IRS4 and IGF2 in enhancer hijacking. Nat Genet 49, 65–74 (2017). - PMC - PubMed
    1. Zack TI et al. Pan-cancer patterns of somatic copy number alteration. Nat Genet 45, 1134–40 (2013). - PMC - PubMed

Publication types