. 2020 Oct;27(10):901-912.
doi: 10.1038/s41594-020-0475-8. Epub 2020 Aug 17.

Concentration-dependent splicing is enabled by Rbfox motifs of intermediate affinity

Affiliations

Concentration-dependent splicing is enabled by Rbfox motifs of intermediate affinity

Bridget E Begg et al. Nat Struct Mol Biol. 2020 Oct.

Abstract

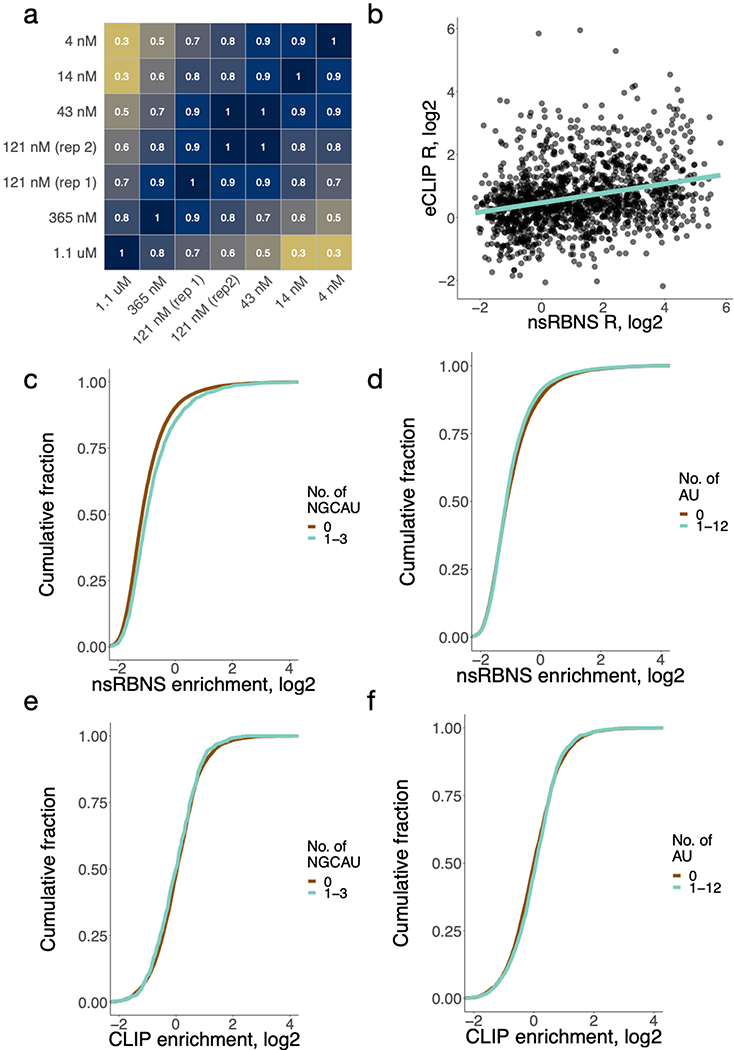
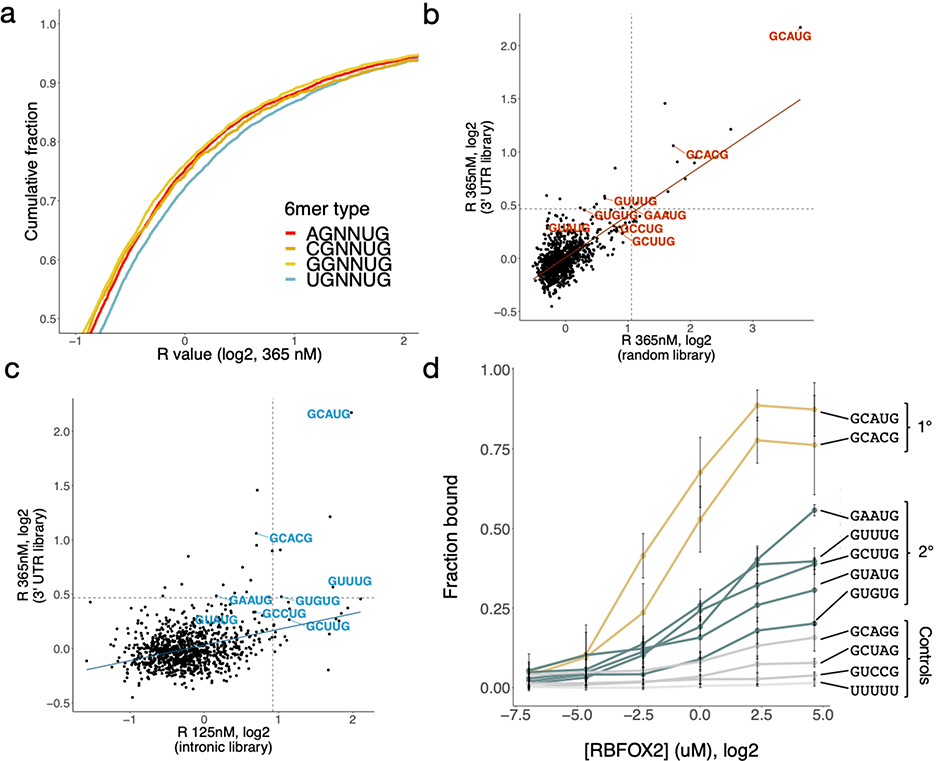
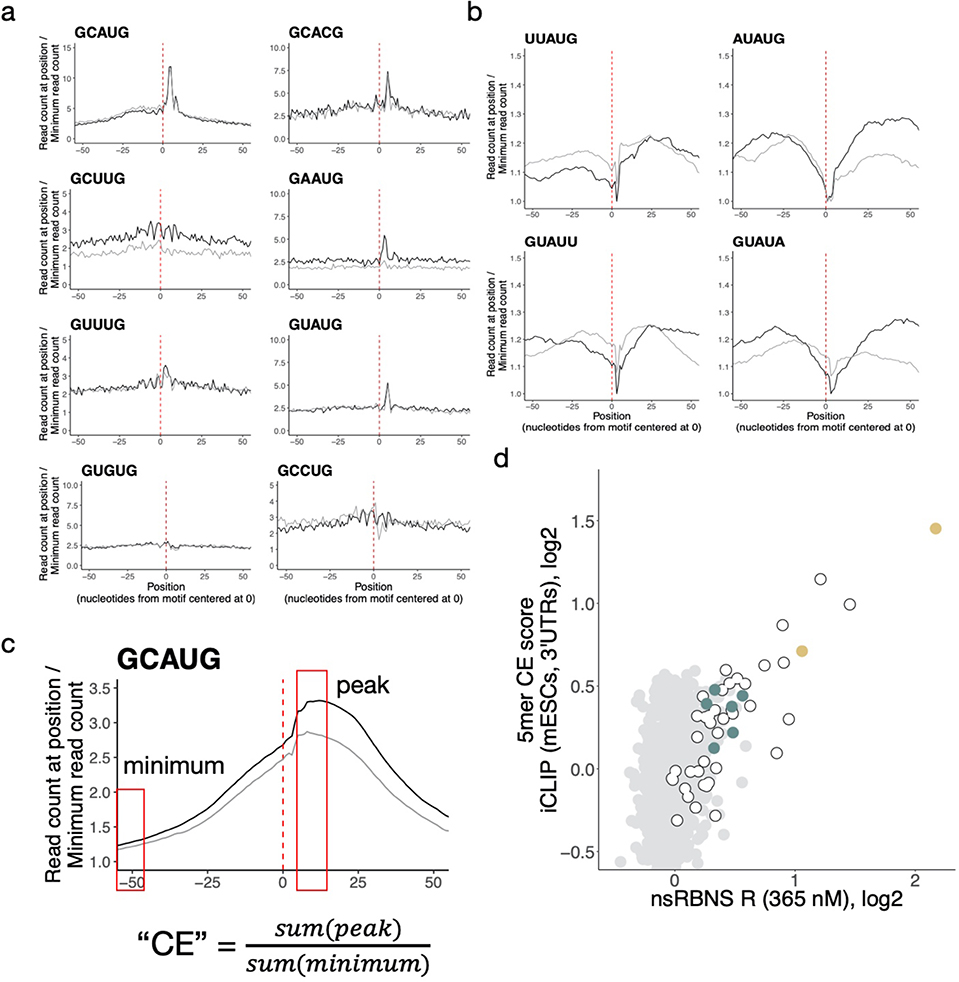
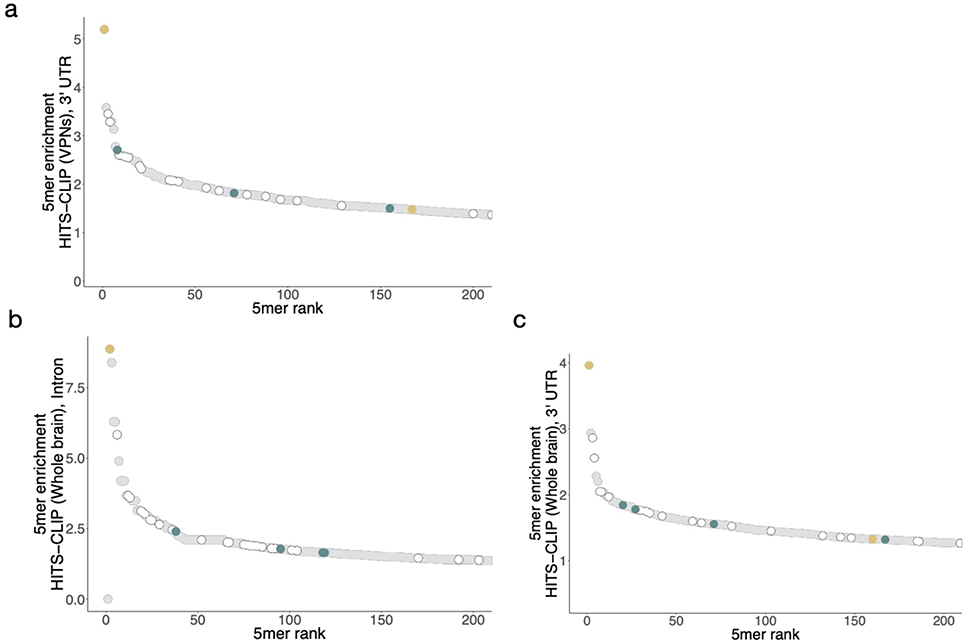
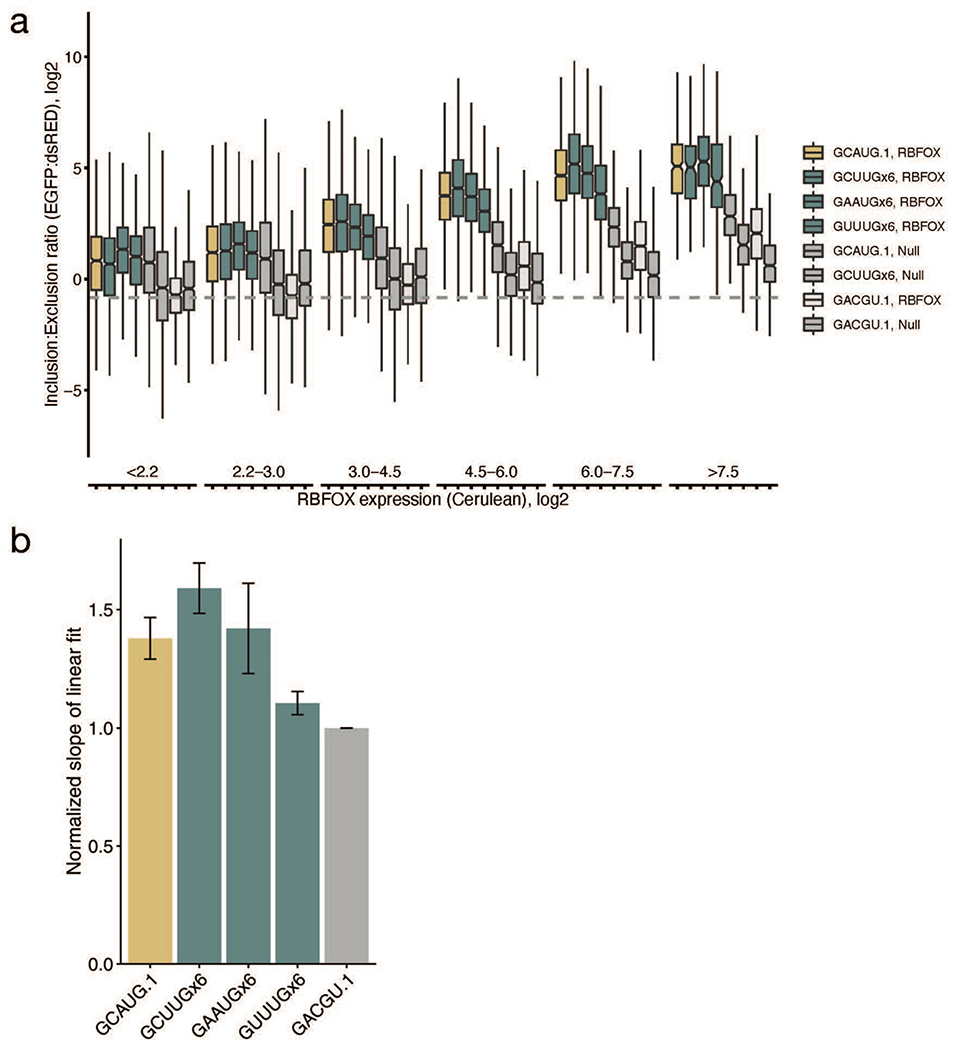
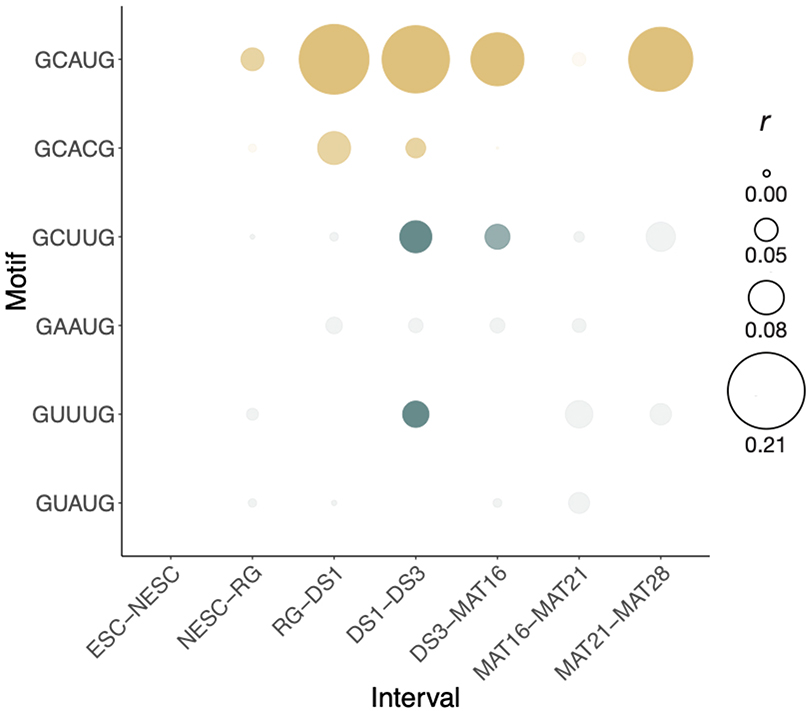
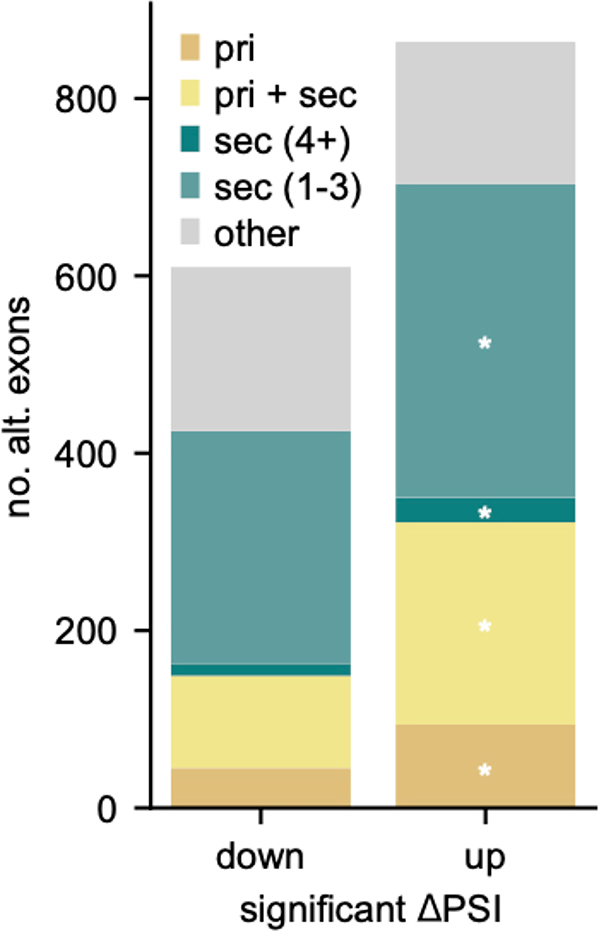
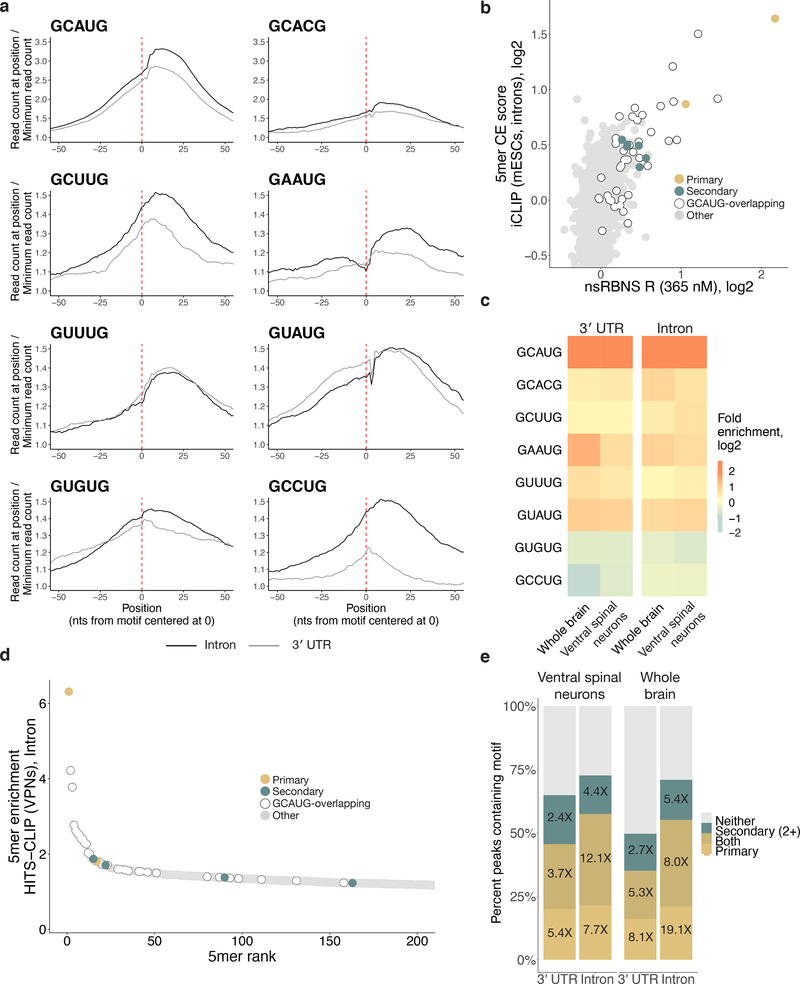
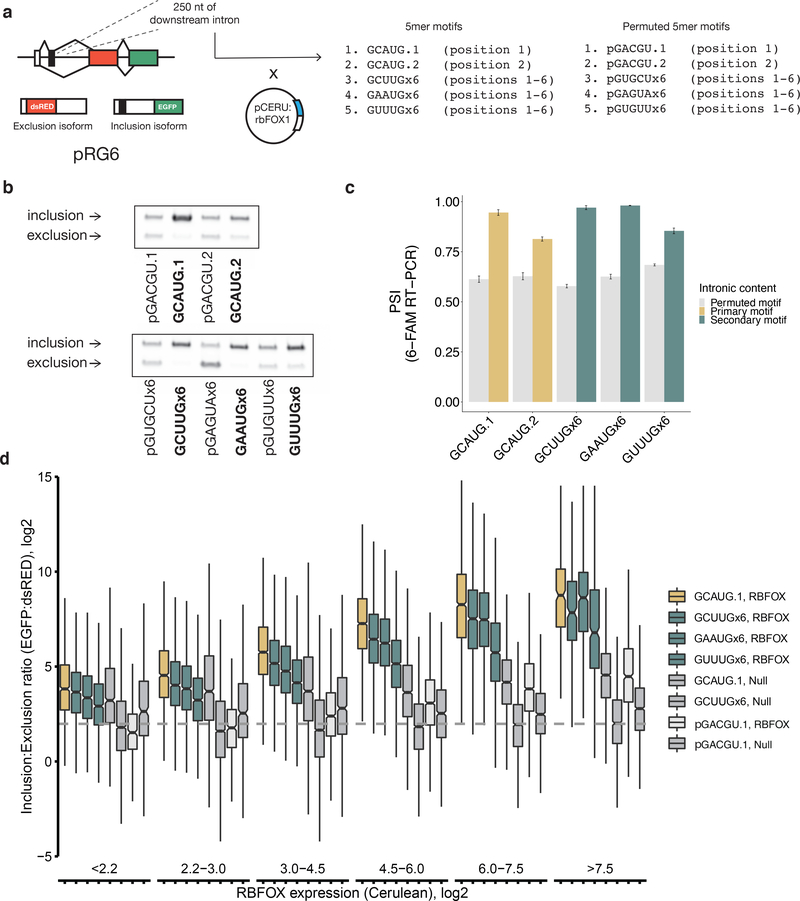
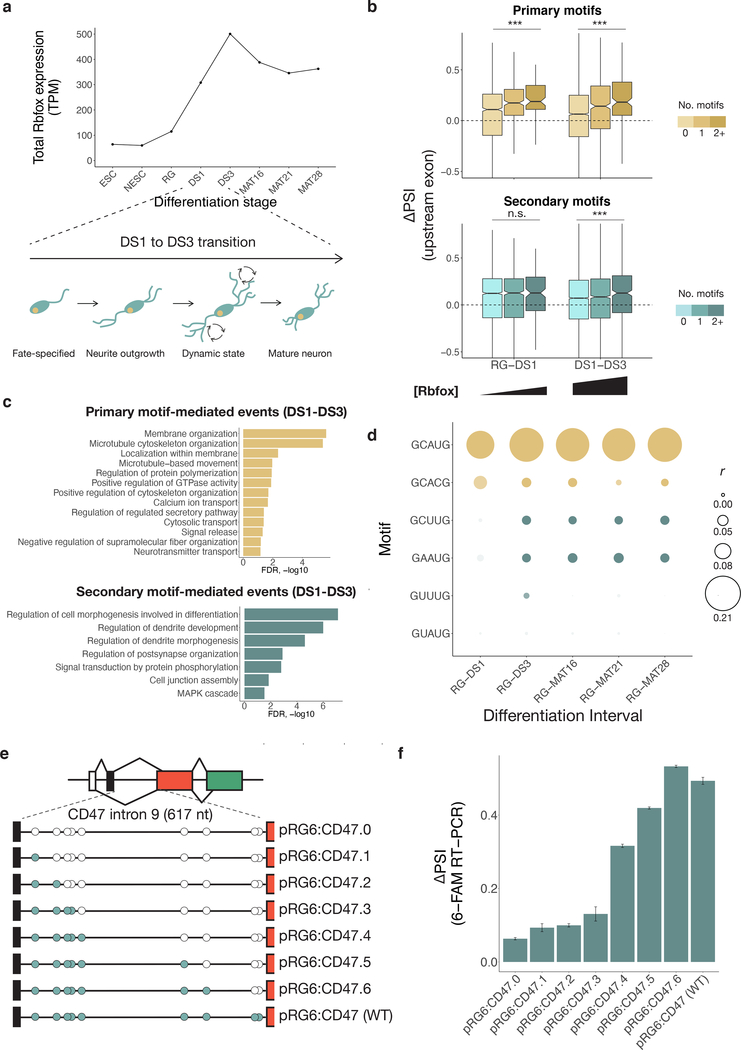
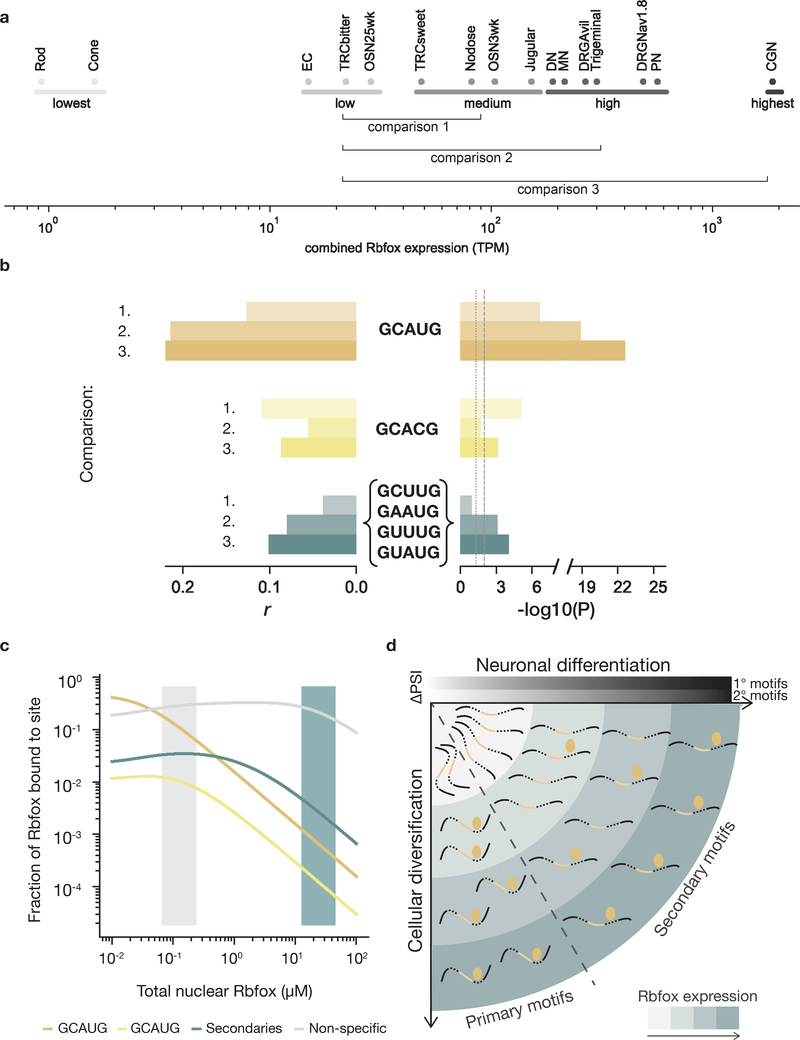
The Rbfox family of splicing factors regulate alternative splicing during animal development and in disease, impacting thousands of exons in the maturing brain, heart and muscle. Rbfox proteins have long been known to bind to the RNA sequence GCAUG with high affinity and specificity, but just half of Rbfox binding sites contain a GCAUG motif in vivo. We incubated recombinant RBFOX2 with over 60,000 mouse and human transcriptomic sequences to reveal substantial binding to several moderate-affinity, non-GCAYG sites at a physiologically relevant range of RBFOX2 concentrations. We find that these 'secondary motifs' bind Rbfox robustly in cells and that several together can exert regulation comparable to GCAUG in a trichromatic splicing reporter assay. Furthermore, secondary motifs regulate RNA splicing in neuronal development and in neuronal subtypes where cellular Rbfox concentrations are highest, enabling a second wave of splicing changes as Rbfox levels increase.


Conflict of interest statement

Competing interests statement

The authors declare no competing interests.

Figures

Extended Data Figure 1.
Extended Data Figure 1.. RBFOX2 nsRBNS reveals binding to a set of moderate-affinity secondary motifs.
a. Correlations among seven natural sequence nsRBNS experiments. Pearson correlations are reported for any sequence with an enrichment (R) value greater than 1. Darker color indicates a higher correlation (R 1.1.463 cor.test function). n = 38467. b. Correlation of nsRBNS R with eCLIP enrichment at oligo-derived regions for all oligonucleotides or sequence regions containing a single GCAUG Rbfox primary motif (n = 2946). c. R value distribution of nsRBNS sequences containing 0 (n = 21596) or 1–3 (n = 2397) NGCAU motifs. d. R value distribution of nsRBNS sequences containing 0 (n = 11077) or 1–3 (n = 12916) AU motifs. e. RBFOX2 eCLIP in HepG2 at library positions in the transcriptome for 0 (n = 7041) or 1–3 (n = 711) NGCAU motifs. RBFOX2 peaks were compared to an IgG control to determine enrichments. f. RBFOX2 eCLIP in HepG2 at library positions in the transcriptome for 0 (n = 4610) or 1–3 (n = 3142) AU motifs. RBFOX2 peaks were compared to an IgG control to determine enrichments.
Extended Data Figure 2.
Extended Data Figure 2.. Different nsRBNS libraries emphasize different 5mer binding preferences for RBFOX2.
a. R value distribution of nsRBNS sequences containing 1–2 copies of different 6mer classes UGNNUG (n = 7725), CGNNUG (n = 1751), AGNNUG (n = 6260), GGNNUG (n = 4935). b-c. Comparison of random (b) and intronic natural sequence (c) RBNS with 3' UTR nsRBNS 5mer enrichments. Primary and secondary motifs are labelled in red and blue, respectively. Dotted lines show 2.5 standard deviations above the mean. d. Filter binding with radiolabeled oligonucleotides containing three copies of the indicated sequence brought to equilibrium with six concentrations of RBFOX2. Primary motifs in gold, secondary motifs in teal, controls in grey. Error bars indicate +/− SD for three replicates.
Extended Data Figure 3.
Extended Data Figure 3.. RBFOX2 iCLIP demonstrates broad agreement with nsRBNS.
a. Some secondary motifs show sharp peaks near 0 in a metaplot centered at the motif in introns (black) and 3' UTRs (grey) in RBFOX2 iCLIP data27. 5' ends of iCLIP reads containing the motif of interest were aligned with position one of the pentamer at 0 and normalized to the minimum read count in an 80-nt window (50-nt window shown). Y-axis range was reduced for secondary motifs. See Methods for read counts. b. AU-rich nsRBNS motifs do not show characteristic read peaks near 0 in a metaplot centered at the motif in introns (black) and 3' UTRs (grey) in RBFOX2 iCLIP data27. iCLIP reads containing the motif of interest were aligned with position one of the pentamer at 0 and normalized to the minimum read count in an 80-nt window (50-nt window shown). Y-axis range was reduced for secondary motifs. See methods for read counts. c. Schematic showing the generation of a clip enrichment (CE) score from iCLIP data. After generation of a metaplot, the read count at the peak apex was divided by the read count at its lowest point to generate a CE score analogous to an enrichment. d. Correlation of iCLIP- and nsRBNS-enriched 5mers in 3' UTRs (n = 1024). CLIP enrichment (CE) scores were computed for iCLIP peaks. Secondary motifs indicated in teal, primary motifs indicated in gold.
Extended Data Figure 4.
Extended Data Figure 4.. Enrichment of 5mers in HiTS-CLIP.
5mer enrichment of top 200 5mers in two HiTS-CLIP datasets in both introns and 3' UTRs. 5mer enrichment was calculated by determining the frequencies of all 1,024 5mers in CLIP peaks in each region and dataset and subsequently normalizing to control peaks from that region. Peaks from (a) Mouse ventral spinal neuron 3' UTR HiTS-CLIP, (b) Mouse whole brain intronic HiTS-CLIP, and (c) Mouse whole brain 3' UTR HiTS-CLIP were analyzed. Gold indicates primary motifs, teal indicates secondary motifs.
Extended Data Figure 5.
Extended Data Figure 5.. Representative raw data from flow cytometry.
Graphs were drawn with pseudocolor in FlowJo. a. Gating strategy to select for single, live, intact cells. Events were gated through three serial gates to obtain approximately 25000 events for downstream analysis. Total number of events in each graph, and the percentage of events within the gate in each graph are shown. (FSC: forward scatter; SSC: side scatter; A: area; H: height; W: width.) b,c. Compensated values of the three fluorophores used (dsRED, EGFP, Cerulean), in positive and control samples with (b) primary and (c) secondary motifs.
Extended Data Figure 6.
Extended Data Figure 6.. Secondary motifs promote inclusion in a splicing reporter in an RBFOX1-dependent manner at the protein level.
a. Six secondary motifs approximate the exon inclusion of one primary motif in an Rbfox1-dependent manner at the protein level, replicate 2. RG6 plasmids containing one primary motif or six secondary motifs were co-transfected in HEK293T cells with fluorescently labelled Rbfox1 and monitored by flow cytometry for the inclusion isoform (GFP), exclusion isoform (dsRED), and Rbfox1 (Cerulean) expression at the single-cell level. Controls including a scrambled motif co-transfected with Rbfox1 (light grey) and scrambled and intact motifs without Rbfox1 (grey) are also shown. Bins detailed in Supplementary Table 5. b. The slope of linear fit of two flow cytometry replicates were null-subtracted and normalized to their permuted controls. Error bars represent standard error of the mean (SEM).
Extended Data Figure 7.
Extended Data Figure 7.. Secondary motifs become engaged at specific intervals of neuronal differentiation.
Pearson correlation of secondary motif presence with exon inclusion at intervals of neuronal differentiation beginning with embryonic stem cells and progressing to mature 28-day glutamatergic neurons (ESC–NESC (n = 448), NESC–RG (n = 1478), RG–DS1 (n = 940), DS1–DS3 (n = 2189), DS3–MAT16 (n = 1600), MAT16–MAT21 (n = 378), MAT21–MAT28 (n = 373)). Size of point indicates correlation coefficient, intensity indicates p-value < 0.05.
Extended Data Figure 8.
Extended Data Figure 8.. Estimation of secondary motif-dependent Rbfox events across neuronal cell types.
In a comparison of neuronal cell types with medium to highest Rbfox mRNA expression, exons likely to be regulated by Rbfox are significantly (P < .0084 Fisher’s exact test, ndown = 13; nup = 28) enriched in secondary motifs. Of 864 alternative exons with increased splicing, 11% are primary, 26.4% primary and secondary, and 3.2% are 4+ secondary motif-associated. Exons with one to three secondary motif instances are also significantly enriched (P < 0.0012, Fisher’s exact test, ndown = 263; nup = 354).
Extended Data Figure 9.
Extended Data Figure 9.. Affinity estimation of Rbfox secondary motifs.
RBNS 7-mer enrichments (R-value) for 1.1 μΜ RBFOX2 (a) and 1.3 μΜ RBFOX3 (b) binding were first corrected for non-specific contributions (R’ see Methods) and then linearly correlated with known dissociation constants (Kd) for RBFOX1 binding1,2. Correlation coefficients between log(R’) and log(Kd) were r=-0.955, P-value=8.379 × 10⁻⁹ (a) and r=−0.915, P-value=6.7 × 10⁻⁷ (b). Scatter plots show estimated Kd as a function of the original, uncorrected R-value. Resulting 7-mer Kd estimates were highly correlated between RBFOX2 and RBFOX3 (c) with r=0.763, P-value ≈ 0. Data for all 7-mers are shown on a logarithmic scale. Primary motif containing 7-mers are highlighted in gold (GCAUG), yellow (GCACG), and teal (secondary motifs GCUUG, GAAUG, GUUUG, GUGUG, GUAUG, GCCUG). Grouping 7-mers by their 5-mer content allows to estimate average Kds for each 5-mer (see Methods). A histogram of these 5-mer dissociation constants is shown in (d), with primary and secondary motifs highlighted as in (c). Motifs GCUUG, GAAUG and GUUUG were considered strong motifs. 136 non-primary or secondary 5-mers with partial overlap to primary motifs GCAUG, GCACG were excluded.
Extended Data Figure 10.
Extended Data Figure 10.. A model for Rbfox secondary motifs.
a. A high nuclear mRNA expression weighted histogram of potential intronic Rbfox binding sites (1,000,000 mRNAs/cell with average half-life time of 3 hours). Motif 5mers in gold (GCAUG), yellow (GCACG), and teal (GCUUG, GAAUG, GUUUG, GUAUG). b. A low nuclear mRNA expression weighted histogram of potential intronic Rbfox binding sites (10x lower mRNA copies/cell and a half-life time of 4 hours). c-d. Predicted average Rbfox occupancies on 5mer motifs as a function of the nuclear Rbfox concentration in low (c) and high (d) mRNA scenarios. The low mRNA scenario predicts that the fraction of Rbfox bound to secondary motifs surpasses primary motifs at Rbfox levels > 1 μΜ. This is lower than estimates from the high mRNA scenario in main Figure 6 (~14 μΜ). Non-specific binding depicted in grey. e. Filter binding with radiolabeled oligonucleotide containing three copies of a primary (GCAUG) or secondary (GCUUG, GAAUG, GUUUG) were incubated to equilibrium in the presence of unlabeled, single copy GCAUG oligonucleotide at six concentrations of RBFOX2. As protein concentration increased, so did the fraction bound of labeled RNA for both primary and secondary motifs. Error bars indicate +/− SD of three replicates.
Figure 1.
Figure 1.. 3' UTR natural sequence nsRBNS (nsRBNS) with RBFOX2 captures variation in binding affinity.
a. Schematic of nsRBNS. Recombinant protein is incubated with a designed RNA library to equilibrium and bound RBP:RNA complexes are purified. Oligonucleotides are sequenced and the enrichment (R) value is calculated ((reads per million)input/(reads per million)pulldown). b. nsRBNS 5mer frequencies correlated with 5mer frequencies of the 3' UTR transcriptome (n = 1024 5mers). Pearson correlation. c. Distribution of R for nsRBNS sequences containing 0 (n = 49931), 1 (n = 5586), 2 (n = 392), or 3+ (n = 22) Rbfox GCAUG motifs and 0 (n = 54637) or 1–3 (n = 1294) GCACG motifs *** P < 0.001 between lowest and highest counts (two-sided Wilcoxon Rank-Sum test). d. Distribution of enrichment of RBFOX2 eCLIP reads in HepG2 cells with increased motif count for 0 (n = 8004), 1 (n = 1244), or 2+ (n = 118) GCAUG motifs and 0 (n = 9065) or 1–3 (n = 301) GCACG motifs in transcriptomic regions corresponding to those in nsRBNS library (normalized to IgG control). *** P < 0.001, * P < 0.05 between lowest and highest counts (two-sided Wilcoxon Rank-Sum test). e. An iterative method discovers moderate binding by RBFOX2 to six motifs of the sequence format GHNUG (teal) beyond two known Rbfox motifs (gold). After nine rounds of enrichment analysis, remaining GNNUG 5mers (teal) were also included as secondary motifs, while AU-rich (grey) and shifted (light blue) 5mers were excluded from subsequent analyses. f. Distribution of R for nsRBNS sequences containing 0 (n = 25501), 1 (n = 18682), 2 (n = 7957), 3 (n = 2576), 4–6 (n = 1069), or 7–14 (n = 146) secondary motifs. *** P < 0.001 between lowest and highest counts (two-sided Wilcoxon Rank-Sum test). g. Distribution of enrichment of RBFOX2 eCLIP reads in HepG2 cells at 0 (n = 3922), 1 (n = 3188), 2 (n = 1453), 3 (n = 498), 4–6 (n = 262), or 7–14 (n = 43) secondary motifs at library positions in the transcriptome (normalized to IgG control). *** P < 0.001 between lowest and highest counts (two-sided Wilcoxon Rank-Sum).
Figure 2.
Figure 2.. Rbfox proteins reproducibly bind a class of secondary motifs with moderate affinity.
a. Ribbon structure of RBFOX1 (teal) bound to UGCAUG (gold). Generated with data from Auweter et al. (PDB 2ERR). Protein–RNA hydrogen bonds are indicated in black. b. Relative per-base conservation, as represented by PhyloP score, for each position of GCAUG at all instances of the motif in 3' UTRs (dark teal, n = 26707) and introns (light teal, n = 91791). c. Primary (gold), secondary (teal), polyA and polyC (light grey), and GCAGG, GUAAG, and GUCCG (dark grey) R values are shown across four concentrations of RBFOX2 nsRBNS experiments. d. Analysis of the fraction of oligonucleotides bound in nsRBNS at three concentrations of RBFOX2 for primary (gold (GCAUG and GCACG), nGCAUG-1 = 5435, nGCAUG-2 = 384, nGCACG-1 = 1246, nGCACG-2 = 30) and secondary (teal, nSecondary-1 = 15676, nSecondary-2 = 6722, nSecondary-6 = 64) motifs. An oligonucleotide was considered bound if it had an R value of at least 1.1. e. nsRBNS R values at 1.1 μM RBFOX2 concentration for all pentamers diverging from GCAUG or GCACG by 1 or 2 bases. Secondary motifs identified here are outlined in black.
Figure 3.
Figure 3.. Rbfox proteins bind secondary motifs in vivo.
a. Primary and secondary motif reads peak near 0 in a metaplot centered at the motif in introns (black) and 3' UTRs (grey) in RBFOX2 iCLIP data (GEO GSE54794). iCLIP reads containing the motif of interest (see Methods for read counts) were aligned with position one of the pentamer at 0 and normalized to the minimum read count in an 80-nt window (50-nt window shown). Y-axis range was reduced for secondary motifs. b. Correlation of intronic iCLIP- and nsRBNS-enriched 5mers (n = 1024). Secondary motifs indicated in teal, primary motifs indicated in gold. Grey dots indicate “hitchhiking” motifs that overlap the primary motif GCAUG by at least three bases but do not have intrinsic Rbfox affinity. c. RBFOX1 HiTS-CLIP data, (SRA SRP128054, SRP035321) enrichments for primary motifs and secondary six motifs in both 3' UTRs (left, n = 2963 and 989) and introns (right, n = 847 and 1431) relative to transcriptomic frequencies in mouse whole brain and ventral spinal neurons, respectively. Enrichment was calculated based on the 5mer composition of 100-base CLIP peak regions centered around the apex of the CLIP peak relative to 5mer composition of the transcriptomic region. d. Four secondary motifs (GCUUG, GAAUG, GUUUG, GUAUG) are indicated among the top 200 highly enriched 5mers derived from intronic HiTS-CLIP peaks from mouse ventral spinal neurons. Primary motifs in gold, secondary motifs in teal. Peaks calculated as above. e. High-confidence CLIP peaks in two different Rbfox1 HiTS-CLIP datasets (SRA SRP128054, SRP035321) in ventral spinal neurons and mouse whole brain cells attributable to primary (light gold), or four secondary (teal; GCUUG, GAAUG, GUUUG, and GUAUG), or both (dark gold) motifs in both 3' UTRs (n = 15487 and n = 24972, respectively) and introns (n = 4800 and n = 1519, respectively). Fold enrichments above transcriptomic background are indicated. Peaks containing neither primary nor two or more secondary motifs are shown in grey.
Figure 4.
Figure 4.. Secondary motifs in downstream introns promote exon inclusion in an Rbfox-dependent manner in a splicing reporter.
a. Experimental design of Rbfox1 splicing reporter. One GCAUG primary motif or six copies of a secondary motif (GCUUG, GAAUG, or GUAUG) were cloned in a 250-base window downstream of an alternative exon in the RG6 dual fluorescent splicing reporter. Plasmids were co-transfected in HEK293T cells with a plasmid expressing fluorescently labelled RBFOX1 to monitor cellular protein levels. b. Semi-quantitative PCR with 5’ 6-FAM-labelled primer indicates exon inclusion in the presence of both primary and secondary motifs in an Rbfox1-dependent manner. c. Mean percent spliced in (PSI) values of exons containing primary motifs (gold), secondary motifs (teal), or motif permutations (grey) in the downstream intron after expression of Rbfox1. Error bars show SD of technical replicates in triplicate. For GAAUG, the median permutation value was used due to the introduction of a splicing silencer in its permuted form. d. Per-cell inclusion:exclusion (EGFP:dsRED, y-axis) ratio for the RG6 alternative exon as Rbfox expression (Cerulean, x-axis) increases as measured by flow cytometry. Primary motifs (gold), six copies of three indicated secondary motifs (teal), primary (intact and permuted) and secondary motifs without co-transfection of Rbfox (dark grey), and a permuted primary motif with co-expressed Rbfox (light grey) are shown. Representative data from one of two replicates (the other is shown in Extended Data Figure 6). Bin numbers can be found in Supplementary Table 5. The center line represents the median, lower and upper hinges the first and third quartiles, respectively, and whiskers extend to the smallest or largest value (at most 1.5*IQR (interquartile range) of the hinge. Outliers are not shown. Notches extend 1.58*IQR/sqrt(n), giving a roughly 95% confidence interval on the medians. Uncropped gel image is available as source data online.
Figure 5.
Figure 5.. Secondary motifs enable splicing regulation at distinct concentration Rbfox concentration ranges in neuronal differentiation.
a. Total expression of Rbfox1, Rbfox2, and Rbfox3 in transcripts per million (TPM) based on RNA-seq during a neuronal differentiation time course (SRA PRJNA185305). b. Correlation of Rbfox primary (gold) and secondary (teal) motifs in the downstream intron with delta PSI at both low-moderate (RG-DS1) and moderate-high (DS1-DS3) transitions of Rbfox expression during in vitro neuronal differentiation. Increased color intensity represents 0, 1, or 2+ motifs in the downstream intron. Primary motifs, RG–DS1: 0 (n = 1521), 1 (n = 269), 2+ (n = 90), DS1–DS3: 0, (n = 3611), 1 (n = 596), 2+ (n = 171). Secondary motifs, RG–DS1: 0 (n = 2763), 1 (n = 838), 2+ (n = 159), DS1–DS3: 0, (n = 6461), 1 (n = 1882), 2+ (n = 413). The center line of the boxplot represents the median, lower and upper hinges the first and third quartiles, respectively, and whiskers extend to the smallest or largest value (at most 1.5*IQR (interquartile range) of the hinge. Outliers are not shown. Notches extend 1.58*IQR/sqrt(n), giving a roughly 95% confidence interval on the medians. *** P < 0.001 (two-sided Wilcoxon Rank-Sum). c. Gene Ontology categories of splicing events driven by primary motifs (n = 388) (top) and secondary motifs (n = 561) (bottom) during neuronal differentiation. Events were compared to all expressed genes at DS3 and terms were filtered for FDR < 0.1, B > 99, and b > 9. d. Correlation of Rbfox primary (gold) and secondary (teal) motifs throughout stages of neuronal differentiation subsequent to RG stage. Pearson correlation of secondary motif presence with delta PSI is shown at intervals of neuronal differentiation from radial glia stage to mature 28-day glutamatergic neurons. Events: RG–DS1 (n = 940), RG–DS3 (n = 3436), RG–MAT16 (n = 3860) RG–MAT21 (n = 3942) RG–MAT28 (n = 4119). Size of point indicates correlation coefficient, intensity indicates uncorrected p-value < 0.05. e. Reporter design of CD47 intron 10-containing RG6. All secondary motifs were ablated from the 617-nt intron and sequentially reintroduced into the reporter to examine the effects of individual secondary motifs. f. Mean percent spliced in (PSI) values of exons containing secondary motifs in the downstream intron after expression of Rbfox1. Error bars show SD of triplicate technical replicates.
Figure 6.
Figure 6.. Secondary motifs are active in neuronal cell types with high Rbfox expression.
a. Differentiated neuronal cell types from Weyn-Vanhentenryck et al. (SRA SRP055008), arranged by combined Rbfox1, Rbfox2, and Rbfox3 expression (log10 of sum of RPKM values). Cell types were grouped into Lowest, Low, Medium, High, and Highest Rbfox expression categories. Cells analyzed: olfactory sensory neurons (OMP+) (OSN), enterochromaffin cells (EC), taste receptor cells (TRC), rod or cone photoreceptors, jugular or nodose visceral sensory ganglia, dopaminergic neurons (DN), motor neurons (MN), dorsal root ganglia sensory neurons (Nav1.8+ or Avil+) (DRG), trigeminal ganglia, Purkinje neurons (PN), and cerebellar granule neurons (CGN). b. Linear regression of 1,909 alternatively spliced exons comparing the Rbfox expression groups indicated in a. Horizontal bars represent the Pearson r value (left) and uncorrected significance (right) of the correlation between the number of occurrences of primary or secondary (GCUUG, GAAUG, GUUUG, and GUAUG) motifs and ΔPSI values between Medium and Low (1.), between High and Low (2.), or between Highest and Low (3.) Rbfox expression regimes. Grey dotted and dashed lines indicate 0.05 and 0.01 significance thresholds, respectively. c. An equilibrium model for Rbfox binding to intronic sequences in the nucleus at various expression levels of Rbfox (low, grey area; high, teal area). GCAUG indicated by gold, GCACG indicated by yellow, secondary motifs indicated in teal, non-specific 5mers in grey. d. Graphical summary of how Rbfox proteins (golden ellipses) regulate distinct splicing events at different expression levels (teal shading). Secondary motifs are functionally relevant only at higher Rbfox levels, occurring at later stages of neuronal differentiation or in cell types with high Rbfox expression, while primary motifs are functionally relevant at earlier stages and in cell types with medium as well as high Rbfox levels.

References

    1. Hodgkin J, Zellan JD & Albertson DG Identification of a candidate primary sex determination locus, fox-1, on the X chromosome of Caenorhabditis elegans. Development (1994). - PubMed
    1. Skipper M, Milne CA & Hodgkin J Genetic and molecular analysis of fox-1, a numerator element involved in Caenorhabditis elegans primary sex determination. Genetics (1999). - PMC - PubMed
    1. Kim KK, Adelstein RS & Kawamoto S Identification of neuronal nuclei (NeuN) as Fox-3, a new member of the Fox-1 gene family of splicing factors. J. Biol. Chem. (2009). doi:10.1074/jbc.M109.052969 - DOI - PMC - PubMed
    1. Weyn-Vanhentenryck SM et al. Precise temporal regulation of alternative splicing during neural development. Nat. Commun. (2018). doi:10.1038/s41467-018-04559-0 - DOI - PMC - PubMed
    1. Gallagher TL et al. Rbfox-regulated alternative splicing is critical for zebrafish cardiac and skeletal muscle functions. Dev. Biol. (2011). doi:10.1016/j.ydbio.2011.08.025 - DOI - PMC - PubMed

Publication types

MeSH terms