. 2021 Jan 1;31(1):1-14.
doi: 10.1093/cercor/bhaa184.

Spatial Relationships between Molecular Pathology and Neurodegeneration in the Alzheimer's Disease Continuum

Affiliations

Spatial Relationships between Molecular Pathology and Neurodegeneration in the Alzheimer's Disease Continuum

Leonardo Iaccarino et al. Cereb Cortex. .

Abstract

A deeper understanding of the spatial relationships of β-amyloid (Aβ), tau, and neurodegeneration in Alzheimer's disease (AD) could provide insight into pathogenesis and clinical trial design. We included 81 amyloid-positive patients (age 64.4 ± 9.5) diagnosed with AD dementia or mild cognitive impairment due to AD and available 11C-PiB (PIB), 18F-Flortaucipir (FTP),18F-FDG-PET, and 3T-MRI, and 31 amyloid-positive, cognitively normal participants (age 77.3 ± 6.5, no FDG-PET). W-score voxel-wise deviation maps were created and binarized for each imaging-modality (W > 1.64, P < 0.05) adjusting for age, sex, and total intracranial volume (sMRI-only) using amyloid-negative cognitively normal adults. For symptomatic patients, FDG-PET and atrophy W-maps were combined into neurodegeneration maps (ND). Aβ-pathology showed the greatest proportion of cortical gray matter suprathreshold voxels (spatial extent) for both symptomatic and asymptomatic participants (median 94-55%, respectively), followed by tau (79-11%) and neurodegeneration (41-3%). Amyloid > tau > neurodegeneration was the most frequent hierarchy for both groups (79-77%, respectively), followed by tau > amyloid > neurodegeneration (13-10%) and amyloid > neurodegeneration > tau (6-13%). For symptomatic participants, most abnormal voxels were PIB+/FTP+/ND- (median 35%), and the great majority of ND+ voxels (91%) colocalized with molecular pathology. Amyloid spatially exceeded tau and neurodegeneration, with individual heterogeneities. Molecular pathology and neurodegeneration showed a progressive overlap along AD course, indicating shared vulnerabilities or synergistic toxic mechanisms.

Keywords: amyloid; neurodegeneration; spatial extent; tau; topography.


Figures

Figure 1
Figure 1
Spatial extent of Aβ-, tau-pathology, and neurodegeneration. Boxplots showing spatial extents for each modality for both symptomatic patients (A) and preclinical AD subjects (B). Single points for each participant are added to show the underlying distribution. ***All the pairwise differences were significant at P < 0.001 (see text for details). Legend: GM, gray matter; AD, Alzheimer’s disease; FTP, 18F-flortaucipir-PET; PIB, 11C-PIB-PET; ND, neurodegeneration; MRI, magnetic resonance imaging.
Figure 2
Figure 2
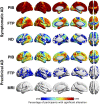
Voxel-wise frequency maps of biomarker alteration. Figure showing voxel-wise frequency maps for each biomarker alteration for both symptomatic (upper panel) and preclinical AD participants (lower panel). Values indicate the percentage of subjects showing abnormality in each voxel. Color scale was limited to 25% as minimum for the sake of visualization. Frequency maps are overlaid on an ICBM152 smoothed template with BrainNet Viewer (Xia et al. 2013). Legend: AD, Alzheimer’s disease; FTP, 18F-flortaucipir-PET; PIB, 11C-PIB-PET; ND, neurodegeneration; MRI, magnetic resonance imaging.
Figure 3
Figure 3
Hierarchies of spatial extents. Spaghetti plots showing rankings of spatial extents for both symptomatic (A) and preclinical AD participants (B). Individual relative hierarchies are shown in gray in the background. Colored lines connect median group values relative to the assigned hierarchies (see text). Legend: GM, gray matter; AD, Alzheimer’s disease; FTP, 18F-flortaucipir-PET; PIB, 11C-PIB-PET; ND, neurodegeneration; MRI, magnetic resonance imaging.
Figure 4
Figure 4
Voxel classifications combining Aβ, tau, and neurodegeneration alterations. Figure showing the median proportion for each PIB±/FTP±/ND± voxel classification at the whole cortical GM level (A) and the molecular pathology status of neurodegeneration-positive voxels (B) for both symptomatic and preclinical AD participants. (A) Venn diagrams show proportions of voxel classifications over the whole cortical GM for both symptomatic (upper diagram) and preclinical AD participants (lower diagram). The size of the diagrams has been scaled according to the proportion of voxels spared by both molecular pathology and neurodegeneration (median 2% for symptomatic AD, 28% for preclinical AD, see text and Supplementary Table 2 for details). The ND data for the preclinical AD participants refer to atrophy changes only. (B) Barplots show the molecular pathology status for all the neurodegeneration-positive voxels in the whole cortical GM. Proportions shown are calculated over the total amount of neurodegeneration-positive voxels (therefore totaling to 100% for both groups). Legend: GM, gray matter; AD, Alzheimer’s disease; FTP, 18F-flortaucipir-PET; PIB, 11C-PIB-PET; ND, neurodegeneration.
Figure 5
Figure 5
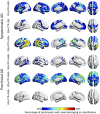
Voxel-wise frequency maps of voxel classifications. Figure showing voxel-wise frequency maps for voxel classifications for both symptomatic patients (upper panel) and preclinical AD participants (lower panel). Only the three most frequent voxel classifications for each group are shown (see text and Supplementary Table 2). Values indicate the percentage of participants showing the specific PIB±/FTP±/ND(MRI)± classification in each voxel. Color scale was limited to 25% as minimum for the sake of visualization. Frequency maps are overlaid on an ICBM152 smoothed template with BrainNet Viewer (Xia et al. 2013). Legend: AD, Alzheimer’s disease; FTP, 18F-flortaucipir-PET; PIB, 11C-PIB-PET; ND, neurodegeneration; MRI, magnetic resonance imaging.
Figure 6
Figure 6
Relationships between spatial extents and global cognition. Scatterplots showing relationships in symptomatic participants between MMSE total score and spatial extent of neurodegeneration (A) or spatial extent of voxels positive to both molecular pathologies and neurodegeneration (B). Red lines show linear fit and respective confidence intervals (gray shaded area). Legend: GM, gray matter; AD, Alzheimer’s disease; FTP, 18F-flortaucipir-PET; PIB, 11C-PIB-PET; ND, neurodegeneration; MMSE, Mini-Mental State Examination.

References

    1. Adams JN, Maass A, Harrison TM, Baker SL, Jagust WJ. 2019. Cortical tau deposition follows patterns of entorhinal functional connectivity in aging. Elife. 8:e49132. - PMC - PubMed
    1. Albert MS, DeKosky ST, Dickson D, Dubois B, Feldman HH, Fox NC, Gamst A, Holtzman DM, Jagust WJ, Petersen RC et al. . 2011. The diagnosis of mild cognitive impairment due to Alzheimer’s Disease: recommendations from the National Institute on Aging-Alzheimer’s Association workgroups on diagnostic guidelines for Alzheimer’s Disease. Alzheimers Dement. 7:270–279. - PMC - PubMed
    1. Altmann A, Ng B, Landau SM, Jagust WJ, Greicius MD. 2015. Regional brain hypometabolism is unrelated to regional amyloid plaque burden. Brain. 138:3734–3746. - PMC - PubMed
    1. Ashburner J. 2007. A fast diffeomorphic image registration algorithm. Neuroimage. 38:95–113. - PubMed
    1. Bejanin A, Schonhaut DR, La Joie R, Kramer JH, Baker SL, Sosa N, Ayakta N, Cantwell A, Janabi M, Lauriola M et al. . 2017. Tau pathology and neurodegeneration contribute to cognitive impairment in Alzheimer’s Disease. Brain. 140:3286–3300. - PMC - PubMed

Publication types

MeSH terms