. 2020 Dec 2;48(21):11827-11844.
doi: 10.1093/nar/gkaa670.

Investigating the pharmacodynamic durability of GalNAc-siRNA conjugates

Affiliations

Investigating the pharmacodynamic durability of GalNAc-siRNA conjugates

Christopher R Brown et al. Nucleic Acids Res. .

Abstract

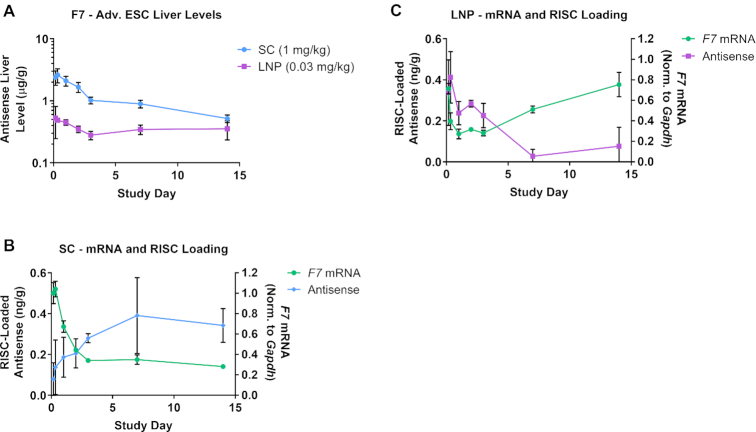
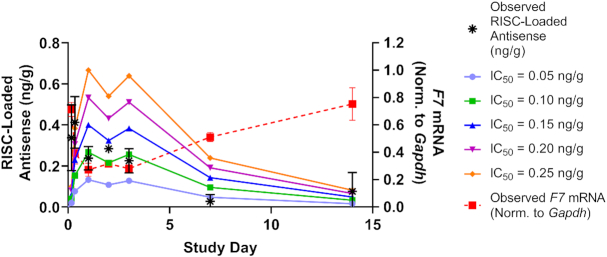
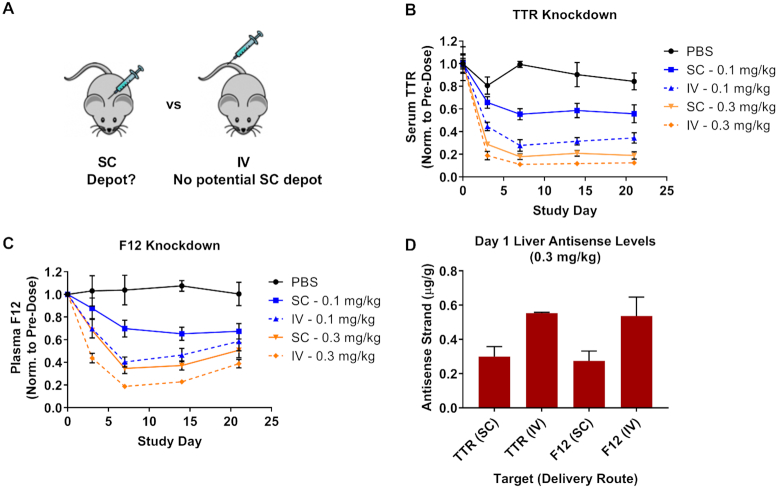
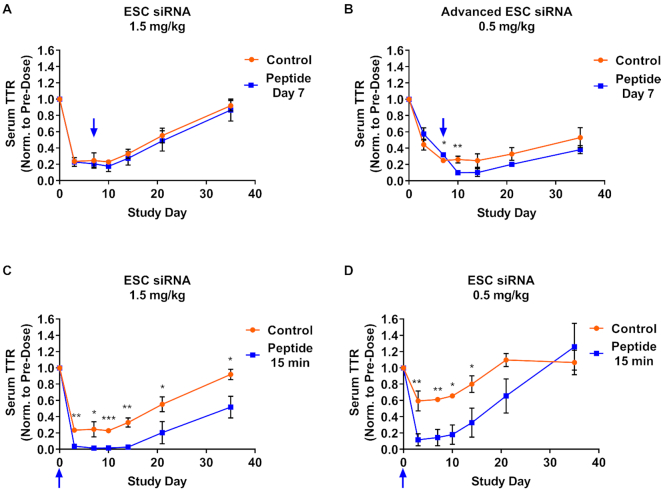
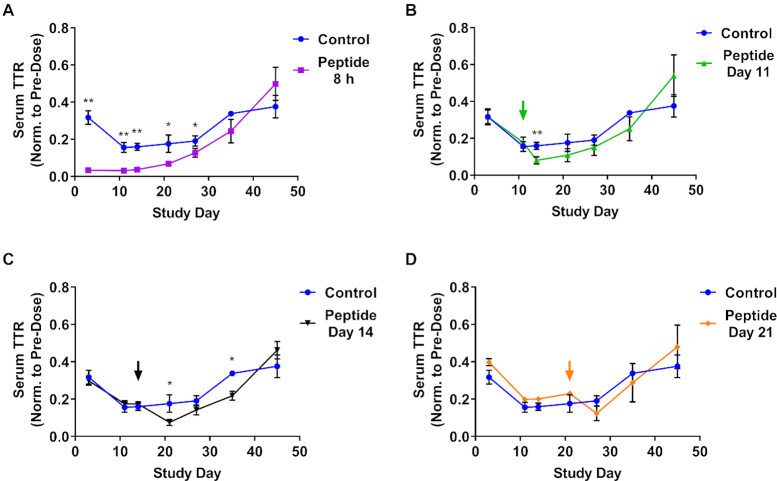
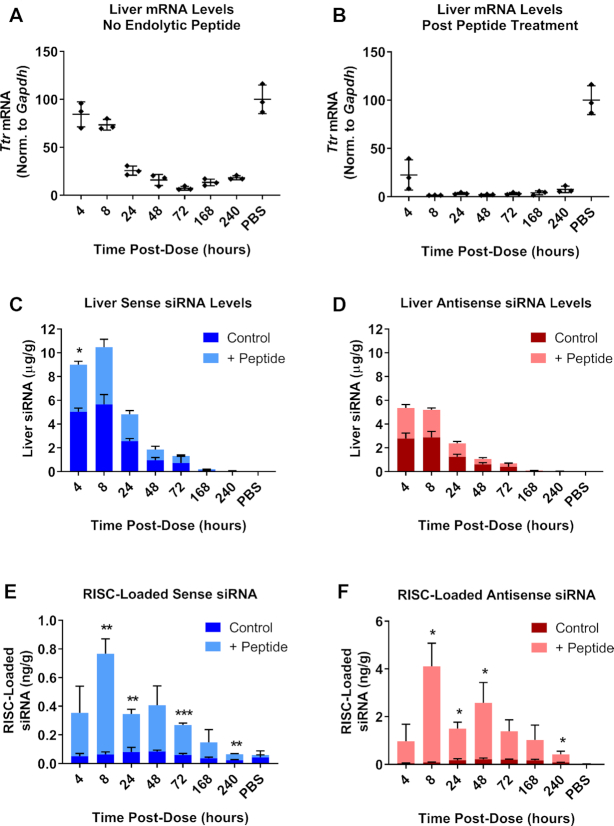
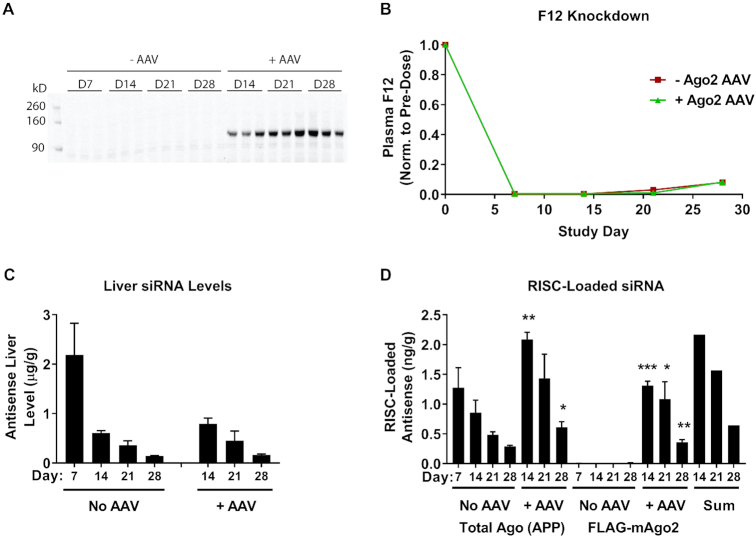
One hallmark of trivalent N-acetylgalactosamine (GalNAc)-conjugated siRNAs is the remarkable durability of silencing that can persist for months in preclinical species and humans. Here, we investigated the underlying biology supporting this extended duration of pharmacological activity. We found that siRNA accumulation and stability in acidic intracellular compartments is critical for long-term activity. We show that functional siRNA can be liberated from these compartments and loaded into newly generated Argonaute 2 protein complexes weeks after dosing, enabling continuous RNAi activity over time. Identical siRNAs delivered in lipid nanoparticles or as GalNAc conjugates were dose-adjusted to achieve similar knockdown, but only GalNAc-siRNAs supported an extended duration of activity, illustrating the importance of receptor-mediated siRNA trafficking in the process. Taken together, we provide several lines of evidence that acidic intracellular compartments serve as a long-term depot for GalNAc-siRNA conjugates and are the major contributor to the extended duration of activity observed in vivo.


Figures

Scheme 1.
Scheme 1.
Generation of the GalNAc-conjugated D-INF7 peptide (Compound 804).
Figure 1.
Figure 1.
RNAi activity is delayed upon free-uptake of GalNAc–siRNAs. Advanced ESC GalNAc–siRNA-mediated knockdown (siTTR-2) of Ttr mRNA in primary mouse hepatocytes (PMH) following transfection (A) or free uptake (B) relative to Gapdh. A dose response and time course were carried out for all conditions. Similar results were obtained for an ESC GalNAc–siRNA design (siTTR-1, Supplementary Figure S1). Data is represented as mean ± SD, for N = 3. (C, D) An Advanced ESC GalNAc–siRNA labeled with Alexa-488 (siTTR-4, green, 5′ end of the sense strand), was incubated with primary mouse hepatocytes at 10 nM for free uptake delivery. Cells were treated with Lysosome Cytopaint (red) 90 min (C) or 16 hours (D) after siRNA treatment and live-cell images were taken 20 min later. Scale bars are 10 μm.
Figure 2.
Figure 2.
Increased siRNA stability improves knockdown and duration of activity. Cohorts of mice were dosed SC with ESC (2.5 mg/kg, siF9-1) or Advanced ESC (0.75 mg/kg, siF9-2) siRNA targeting F9 (A–C). Animals were sacrificed after 4 hours and on days 3, 7, 14, 21 and 35 post dose. Antisense siRNA levels (μg/g, μg antisense strand per gram of liver) were measured from total liver (A) and plotted on a log10 scale. RISC-loaded antisense siRNA levels were also measured (ng/g, ng of antisense strand per gram of liver) and plotted for ESC (B) and Advanced ESC (C) siRNAs. F9 mRNA knockdown was quantified and normalized to Gapdh for all samples (B, C). Data is represented as mean ± SD, for N = 3. Similar results were obtained with siRNAs targeting Factor 7 (F7, Supplementary Figure S2). (D) Cohorts of mice were dosed with Advanced ESC (siF9-2, 3 mg/kg) siRNA targeting F9. Animals were sacrificed on days 35, 49, 63 and 77 post dose. Antisense siRNA liver levels were plotted on a log10 scale alongside RISC-loaded antisense siRNA levels (both shown in ng/g units, ng of antisense strand per gram of liver). F9 mRNA knockdown was normalized to Gapdh for all samples. Data is represented as mean ± SD, for N = 3.
Figure 3.
Figure 3.
siRNA route of delivery affects target knockdown profile and duration of effect. (A) GalNAc–siRNAs were dosed SC at 3 mg/kg (ESC, siF7-1) or 1 mg/kg (Advanced ESC, siF7-3) and plasma F7 protein activity relative to pre-dose was measured. (B–D) ESC and Advanced ESC GalNAc–siRNAs were formulated into LNPs and delivered by IV at 0.3, 0.1 and 0.03 mg/kg. Both conjugate (SC) and LNP (IV) arms of the experiment were monitored for 49 days by measuring F7 protein activity in the blood. (E) A comparison between the Advanced ESC siRNA delivered as an LNP (0.03 mg/kg, siF7-3) or conjugate (1 mg/kg, siF7-3) is shown. Data is represented as mean ± SD, for N = 3.
Figure 4.
Figure 4.
SC siRNA delivery supports sustained RISC loading compared with LNP delivery. (A) An Advanced ESC GalNAc–siRNA (siF7-3) targeting F7 mRNA was delivered by IV (LNP, 0.03 mg/kg) or by SC injection (1 mg/kg) into cohorts of mice (n = 3). Animals were sacrificed at 4 and 8 hours, and days 1, 2, 3, 7 and 14 and antisense siRNA levels (μg/g, μg antisense strand per gram of liver) were measured from total liver. (B, C) RISC-loaded antisense siRNA levels were measured for SC (B) and LNP (C) groups (ng/g, ng of antisense strand per gram of liver). F7 mRNA knockdown was quantified and normalized to Gapdh for all samples. Data is represented as mean ± SD, for N = 3.
Figure 5.
Figure 5.
Estimate of antisense-loaded RISC half-life in vivo. Data from Figure 4C (advanced ESC, siF7-3, 0.03 mg/kg by LNP) were used to calculate the half-life of antisense-loaded RISC. The terminal half-life (t1/2) is independent of IC50 and is approximately 3.8 days. The IC50 is estimated to be between 0.05 and 0.15 ng/g (ng loaded antisense strand in RISC per gram of liver).
Figure 6.
Figure 6.
The SC site of injection is not a depot for GalNAc–siRNA conjugates. (A) Schematic illustrating the location of SC (back) and IV (tail) injection sites for the GalNAc–siRNA conjugates used in this comparison (note: IV-injected GalNAc–siRNA was not LNP-formulated). (B, C) Cohorts of mice (n = 3) were dosed by SC or IV injection at 0.3 or 0.1 mg/kg with Advanced ESC GalNAc–siRNA conjugates targeting Ttr (B, siTTR-2) or F12 (C, siF12-1) mRNA. (D) Antisense siRNA levels (μg/g, μg antisense strand per gram of liver) were measured from total liver collected one day post-dose from the 0.3 mg/kg groups. The route of administration (RoA) is indicated. Data is represented as mean ± SD, for N = 3.
Figure 7.
Figure 7.
Functional siRNA can be liberated from acidic intracellular compartments by an endolytic GalNAc-peptide conjugate. Cohorts of control mice were dosed with an siRNA alone, either ESC (siTTR-1) or Advanced ESC (siTTR-3), targeting Ttr. Separate cohorts of mice were dosed with the same siRNA as control cohorts followed by the GalNAc-INF7 endolytic peptide at various time points. (A) siTTR-1 was dosed SC at 1.5 mg/kg in two cohorts of mice, one of those cohorts was also dosed with 5 mg/kg of the endolytic peptide at day 7 post siRNA dose. (B) siTTR-3 was dosed SC at 0.5 mg/kg in two cohorts of mice, one of those cohorts was also dosed with 5 mg/kg of the endolytic peptide at day 7 post siRNA dose. (C) siTTR-1 was dosed SC at 1.5 mg/kg in two cohorts of mice, one of those cohorts was also dosed with 5 mg/kg of the endolytic peptide 15 min post siRNA dose. Note the control siRNA group is the same in (A) and (C). (D) siTTR-1 was dosed SC at 0.5 mg/kg in two cohorts of mice, one of those cohorts was also dosed with 5 mg/kg of the endolytic peptide 15 min post siRNA dose. Serum TTR protein levels were monitored for 35 days post-dose. Blue arrows indicate endolytic peptide dose time. Data is represented as mean ± SD, for N = 3. Welch's independent t-test was utilized to compare the mean value between the control and peptide-treated groups at each timepoint to identify significant differences in target knockdown (*P ≤ 0.05, **P ≤ 0.01, ***P ≤ 0.001). Full results for the statistical analysis are included in the Supplemental Information.
Figure 8.
Figure 8.
Chemically stabilized siRNA survives for weeks in acidic intracellular compartments. An Advanced ESC GalNAc–siRNA (siTTR-2) targeting Ttr was dosed SC at 0.5 mg/kg (all cohorts including the control group, which is shown in each graph as a comparison). GalNAc-INF7 endolytic peptide was dosed SC at 5 mg/kg in cohorts of mice at either 8 h (A) or days 11 (B), 14 (C) or 21 (D) post siRNA dose. Serum TTR protein levels were monitored through day 45. Data is represented as mean ± SD, for N = 3. Welch's independent t-test was utilized to compare the mean value between the control and peptide-treated groups at each timepoint to identify significant differences in target knockdown(*P ≤ 0.05, **P ≤ 0.01). Full results for the statistical analysis are included in the Supplemental Information.
Figure 9.
Figure 9.
A large amount of functional siRNA is released and loaded into RISC following treatment with a GalNAc-conjugated endolytic peptide. An ESC GalNAc–siRNA (siTTR-1) targeting Ttr was dosed SC at 0.5 mg/kg. Half of the mice in the study were treated with 5 mg/kg of the GalNAc-INF7 endolytic peptide dosed SC 15 min after the siRNA dose. Cohorts of mice were sacrificed at several times post-dose (4 h through day 10). Ttr mRNA levels were quantified and normalized to Gapdh in control animals (A) or those that were treated with GalNAc-INF7 peptide (B). (C) Total siRNA sense strand liver levels were quantified by RT-qPCR in control (dark blue) or endolytic peptide-treated animals (light blue). (D) Total siRNA antisense strand liver levels were quantified by RT-qPCR in control (dark red) or endolytic peptide-treated animals (light red). (E) Sense strand RISC loading was quantified by RT-qPCR in control (dark blue) or endolytic peptide-treated animals (light blue). (F) Antisense strand RISC loading was quantified by RT-qPCR in control (dark red) or endolytic peptide-treated animals (light red). Additional control pull downs were performed with a mutant APP peptide (Supplementary Figure S3). Data is represented as mean ± SD, for N = 3. Welch's independent t-test was utilized to compare the mean value between the control and peptide-treated groups at each timepoint to identify significant differences in siRNA liver levels and RISC loading (*P ≤ 0.05, **P ≤ 0.01, ***P ≤ 0.001). Full results for the statistical analysis are included in the Supplemental Information.
Figure 10.
Figure 10.
Exogenously expressed Ago2 loads F12 siRNA (siF12-1, 3 mg/kg) 1–3 weeks after dosing. An AAV vector was designed to express 3xFLAG-tagged mouse Ago2 (FLAG-mAgo2) under a constitutive liver-specific promoter (TBG). (A) Expression of the FLAG-mAgo2 protein was verified in AAV treated mice by Western Blot using an anti-FLAG antibody. Days refer to days post siRNA dose (day 0). FLAG-mAgo2 AAV was injected into three cohorts of mice on day 7 of the experiment (B) Plasma F12 protein levels were quantified by ELISA and normalized to pre-dose for each animal. (C) F12 antisense siRNA liver levels were quantified by RT-qPCR. (D) RISC loading was performed by anti-FLAG IP for both -AAV and +AAV groups (FLAG-mAgo2) and by Ago-APP for -AAV and +AAV groups (Total Ago (APP)). Loaded antisense siRNA was quantified by RT-qPCR. Data is represented as mean ± SD, for N = 3. Welch's independent t-test was utilized to compare the mean value between the control and +AAV groups at each timepoint in (C, D), with statistically significant increases in either liver level or RISC loading shown for the +AAV groups (*P ≤ 0.05, **P ≤ 0.01, ***P ≤ 0.001). Full results for the statistical analysis are included in the Supplemental Information.

References

    1. Tuschl T., Zamore P.D., Lehmann R., Bartel D.P., Sharp P.A.. Targeted mRNA degradation by double-stranded RNA in vitro. Genes Dev. 1999; 13:3191–3197. - PMC - PubMed
    1. Fire A., Xu S., Montgomery M.K., Kostas S.A., Driver S.E., Mello C.C.. Potent and specific genetic interference by double-stranded RNA in Caenorhabditis elegans. Nature. 1998; 391:806–811. - PubMed
    1. Elbashir S.M., Harborth J., Lendeckel W., Yalcin A., Weber K., Tuschl T.. Duplexes of 21-nucleotide RNAs mediate RNA interference in cultured mammalian cells. Nature. 2001; 411:494–498. - PubMed
    1. Akinc A., Maier M.A., Manoharan M., Fitzgerald K., Jayaraman M., Barros S., Ansell S., Du X., Hope M.J., Madden T.D. et al. .. The Onpattro story and the clinical translation of nanomedicines containing nucleic acid-based drugs. Nat. Nanotechnol. 2019; 14:1084–1087. - PubMed
    1. Balwani M., Sardh E., Ventura P., Peiro P.A., Rees D.C., Stolzel U., Bissell D.M., Bonkovsky H.L., Windyga J., Anderson K.E. et al. .. Phase 3 trial of RNAi therapeutic givosiran for acute intermittent Porphyria. N. Engl. J. Med. 2020; 382:2289–2301. - PubMed

Publication types

MeSH terms