. 2020 Aug 17;34(5):e4347.
doi: 10.1002/nbm.4347. Online ahead of print.

Terminology and concepts for the characterization of in vivo MR spectroscopy methods and MR spectra: Background and experts' consensus recommendations

Affiliations

Terminology and concepts for the characterization of in vivo MR spectroscopy methods and MR spectra: Background and experts' consensus recommendations

Roland Kreis et al. NMR Biomed. .

Abstract

With a 40-year history of use for in vivo studies, the terminology used to describe the methodology and results of magnetic resonance spectroscopy (MRS) has grown substantially and is not consistent in many aspects. Given the platform offered by this special issue on advanced MRS methodology, the authors decided to describe many of the implicated terms, to pinpoint differences in their meanings and to suggest specific uses or definitions. This work covers terms used to describe all aspects of MRS, starting from the description of the MR signal and its theoretical basis to acquisition methods, processing and to quantification procedures, as well as terms involved in describing results, for example, those used with regard to aspects of quality, reproducibility or indications of error. The descriptions of the meanings of such terms emerge from the descriptions of the basic concepts involved in MRS methods and examinations. This paper also includes specific suggestions for future use of terms where multiple conventions have emerged or coexisted in the past.

Keywords: MR spectroscopic imaging, MR spectroscopy, spectroscopic quantitation, standardization.


Figures

FIGURE 1
FIGURE 1
Illustration that demonstrates how the length of acquisition and sampling rate influence SNR in TD and FD, as well as CRLB. (A) shows in the upper trace the decrease of FD SNR (based on peak height) with length of actual acquisition (more acquired data points with identical sampling rate) while the TD SNR and the fit uncertainty (CRLB) essentially remain the same. By contrast, the lower trace documents that extension of the FID by adding zeroes (zero‐filling) does not alter the FD SNR (TD SNR is then ill‐defined and calculation of CRLB would have to include a zero‐filled signal model, leading to unchanged CRLB). (Simulated single Lorentz line with constant amplitude and width [12.6 Hz], changing noise). (B) illustrates the effect of changing the sampling rate (at constant duration of signal acquisition), which brings along a change in analog and/or digital filters causing high‐frequency noise to be excluded from the acquired FID and thus higher TD SNR at smaller bandwidths. FD SNR and CRLB for the amplitude of the single line remain unchanged. (Simulated single Lorentz line with constant amplitude and width [6.3 Hz], created from identical data set by digital filtering). Δt, sampling interval; NP, number of sampled points; SW, spectral width; ZF, number of points after zero‐filling
FIGURE 2
FIGURE 2
Illustration of terminology for RF pulses and spatial selection: RF pulses are characterized by (A) their RF pulse shape including a B1 +(t) magnitude and phase envelope. For amplitude‐modulated RF pulses (constant carrier frequency, green dashed line), the phase envelope is constant except for 180° jumps (sign change of amplitude). For adiabatic pulses, the phase/carrier frequency envelope is time‐dependent (black solid line).Playing out an RF pulse translates into excitation/inversion of a certain frequency‐band (B). Ideally, only magnetization with a resonance frequency within this band is affected. In reality, the RF pulse profile (B) is nonideal (ie, not rectangular) as illustrated for an adiabatic (left) and a conventional inversion pulse (right). The bandwidth of RF pulses is defined by the FWHM of the pulse profile (frequency width at 50% of the profile maximum). The contour plots illustrate how strongly the magnetization Mz at different resonance frequencies is affected by the RF pulse as a function of the B1 + amplitude (−1: full inversion; +1: no effect).Playing out a B0 gradient concomitantly with an RF pulse translates the pulse profile into a slice profile (C). Both slice and pulse profiles can be further characterized by the pass‐band (frequency range over which the profile is >95% of its maximum), the stop‐band (<5% of the maximum) and the transition‐band (5% to 95% of the maximum). The shift of the slice profile for entities with inherently different resonance frequencies (ie, CSDE) is qualitatively illustrated in (C) (slice profile for an “on‐resonance” compound such as NAA in black vs. that for an “off‐resonance” compound such as water in red solid lines). (D) As the volume of interest (VOI) is often selected using different RF pulses for the different directions, the CSDE (spatial shift between the black solid and the red dashed rectangle), as well as the slice imperfections (indicated by the passband ripples and transition bands in (C)), can vary with direction (eg, for refocusing vs. excitation‐based selection)
FIGURE 3
FIGURE 3
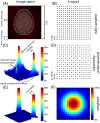
Illustration of terminology for MRSI encoding in image space (left) and k‐space (right). (A) The FOV (exemplified by a slice through a head) is subdivided into a matrix of 16 × 16 voxels with the nominal voxel size defined by FOV/matrix size. The matrix size is determined by (B) the number of k‐space encoding points in each dimension. The size of the FOV is determined by the distance between adjacent k‐space points (1/FOV). Zero‐filling (adding zeroes in the periphery of this acquired k‐space) results in (A) interpolation to smaller voxels in image space (interpolated voxel size). In contrast to acquiring all k‐space points (full sampling in (B)), leaving out k‐space points in a systematic pattern (illustrated by a checkerboard pattern in (D), where empty circles stand for not acquired data) is called coherent undersampling. Such a violation of the Nyquist criterion (ie, the distance between two adjacent k‐space points is >1/object size) causes aliasing artifacts in image domain (C). For coherent undersampling the signal of a point source will therefore not only have contributions from adjacent voxels (ie, signal contamination/bleed caused by discrete Fourier sampling), but also signal contributions from distant voxels through the aliasing artifacts. This is illustrated in (C) via the SRF. The vertical axis (signal amplitude) is cut off at 50% of the maximum of the SRF to illustrate that the effective voxel size is typically assessed as the FWHM. The point source is displayed with a FOV/2‐shift to highlight the signal bleed caused by discrete Fourier sampling. Multiplication of k‐space with a weighting function (Hamming filter illustrated in (F)) reduces the contribution of high‐frequency components in image space. When comparing the SRF in the weighted (E) and nonweighted case (C), it becomes evident that k‐space weighting reduces signal contamination/bleed significantly, but increases the effective voxel size (the spatial response to a point source measured at FWHM)

References

    1. Axel L, Margulis AR, Meaney TF. Glossary of NMR terms. Magn Reson Med. 1984;1:414‐433. - PubMed
    1. Bernstein MA, King KF, Zhou XJ. Handbook of MRI Pulse Sequences. Burlington, VT: Academic Press; 2004.
    1. Brown RW, Cheng Y‐CN, Haacke EM, Thompson MR, Venkatesan R. Magnetic Resonance Imaging: Physical Principles and Sequence Design. 2nd ed. Hoboken, NJ: Wiley Blackwell; 2014.
    1. Ernst RR, Bodenhausen G, Wokaun A. Principles of nuclear magnetic resonance in one and two dimensions. Oxford, UK: Clarendon Press; 1987.
    1. Levitt MH. Spin Dynamics, Basics of Nuclear Magnetic Resonance. 2nd ed. Hoboken, NJ: Wiley; 2008.