. 2020 Nov;23(11):1611-1622.
doi: 10.1111/ele.13590. Epub 2020 Aug 18.

Biodiversity loss underlies the dilution effect of biodiversity

Affiliations

Biodiversity loss underlies the dilution effect of biodiversity

Fletcher W Halliday et al. Ecol Lett. 2020 Nov.

Abstract

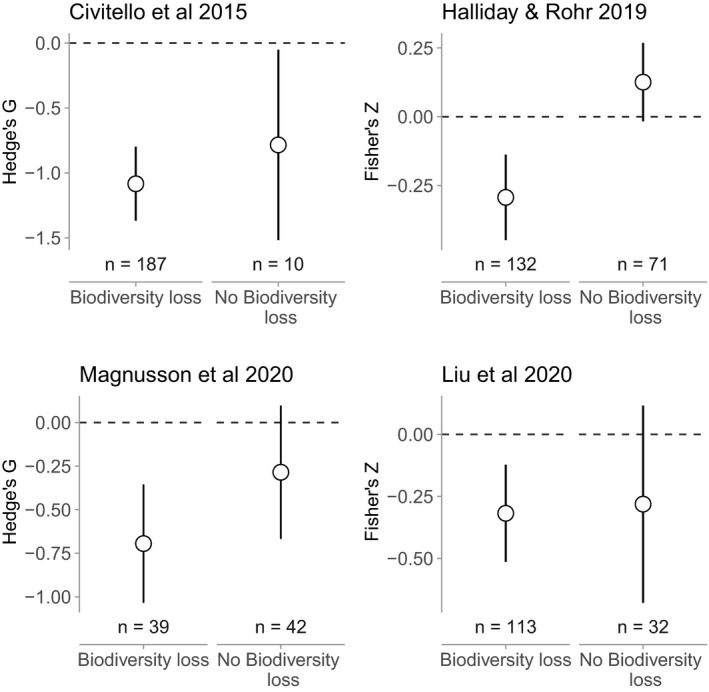
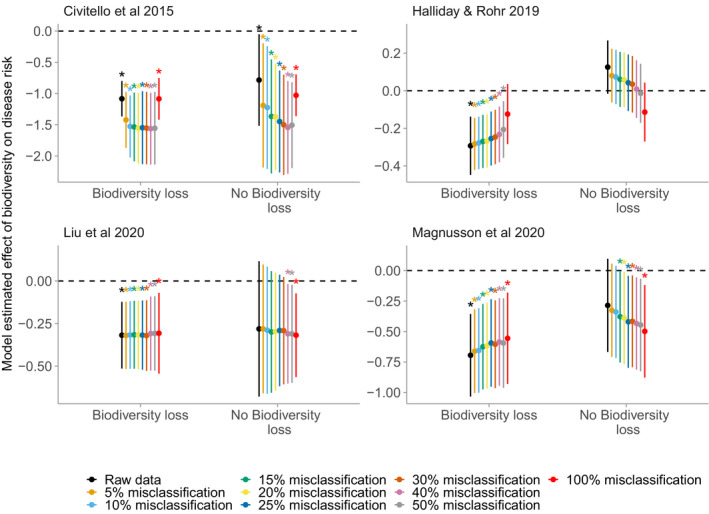
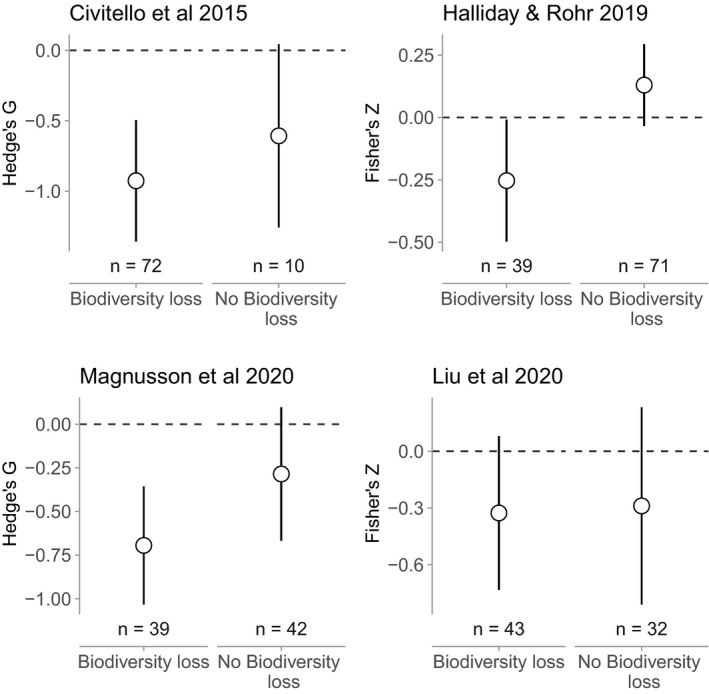
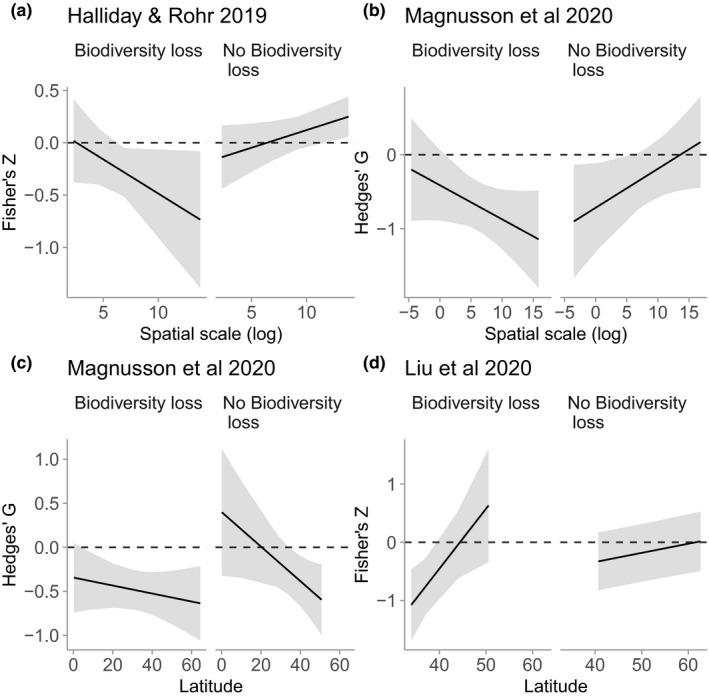
The dilution effect predicts increasing biodiversity to reduce the risk of infection, but the generality of this effect remains unresolved. Because biodiversity loss generates predictable changes in host community competence, we hypothesised that biodiversity loss might drive the dilution effect. We tested this hypothesis by reanalysing four previously published meta-analyses that came to contradictory conclusions regarding generality of the dilution effect. In the context of biodiversity loss, our analyses revealed a unifying pattern: dilution effects were inconsistently observed for natural biodiversity gradients, but were commonly observed for biodiversity gradients generated by disturbances causing losses of biodiversity. Incorporating biodiversity loss into tests of generality of the dilution effect further indicated that scale-dependency may strengthen the dilution effect only when biodiversity gradients are driven by biodiversity loss. Together, these results help to resolve one of the most contentious issues in disease ecology: the generality of the dilution effect.

Keywords: biodiversity; community structure; dilution effect; parasitism.


Figures

Figure 1
Figure 1
Effect of biodiversity loss on the dilution effect. Each panel corresponds to a separate meta‐analysis of the dilution effect. The y‐axis is a standardised effect size from the meta‐analysis, aimed at estimating the strength of the dilution effect, with values below zero corresponding to a negative effect of biodiversity on disease risk (i.e., dilution). Points are model‐estimated means, and error bars are model‐estimated 95% confidence intervals. The dilution effect is robust across biodiversity gradients driven by biodiversity loss, but this effect is idiosyncratic across diversity gradients that do not involve biodiversity loss.
Figure 2
Figure 2
Effect of misclassification on moderation of the dilution effect by biodiversity loss. Each panel corresponds to a separate meta‐analysis of the dilution effect. The y‐axis is a standardised effect size from the meta‐analysis, aimed at estimating the strength of the dilution effect, with values below zero corresponding to a negative effect of biodiversity on disease risk (i.e., dilution). Points are the average model‐estimated mean, and error bars are the average model‐estimated 95% confidence intervals across 200 simulations. Asterisks correspond to misclassification rates in which the average 95% confidence interval did not overlap zero (i.e., in which tests identified significant dilution or amplification, on average, across the 200 simulations). The effect of biodiversity loss on the strength of the dilution effect is robus to misclassification of at least 10% and up to 50% of studies.
Figure 3
Figure 3
Effect of biodiversity loss on the dilution effect after excluding experiments. Panels correspond to different databases. Y‐axes are standardised effect sizes, with values below zero corresponding to negative effects (i.e., dilution). Points are model‐estimated means, and error bars are model‐estimated 95% confidence intervals. With the exception of Liu, which was sensitive to study design, the dilution effect is robust across biodiversity gradients driven by biodiversity loss, but this effect is idiosyncratic across diversity gradients that do not involve biodiversity loss, even after excluding experiments.
Figure 4
Figure 4
Effect of biodiversity loss on moderation of the dilution effect. Panels correspond to models of the interaction between biodiversity‐loss and spatial scale (a and b) or latitude (c and d) for different meta‐analyses, excluding experiments. The y‐axis is a standardised effect size from the meta‐analysis. Lines are model‐estimated means, and ribbons are model‐estimated 95% confidence intervals. Incorporating biodiversity loss resolves inconsistences in the effect of spatial scale, but not latitude.

References

    1. Albrecht, H. & Haider, S. (2013). Species diversity and life history traits in calcareous grasslands vary along an urbanization gradient. Biodivers. Conserv., 22, 2243–2267.
    1. Allan, B.F. , Keesing, F. & Ostfeld, R.S. (2003). Effect of Forest Fragmentation on Lyme Disease Risk. Conserv. Biol., 17, 267–272.
    1. Allan, E. , Manning, P. , Alt, F. , Binkenstein, J. , Blaser, S. , Blüthgen, N. et al (2015). Land use intensification alters ecosystem multifunctionality via loss of biodiversity and changes to functional composition. Ecol. Lett., 18, 834–843. - PMC - PubMed
    1. Altermatt, F. , Seymour, M. & Martinez, N. (2013). River network properties shape α‐diversity and community similarity patterns of aquatic insect communities across major drainage basins. J. Biogeogr., 40, 2249–2260.
    1. Bagousse‐Pinguet, Y.L. , Soliveres, S. , Gross, N. , Torices, R. , Berdugo, M. & Maestre, F.T. (2019). Phylogenetic, functional, and taxonomic richness have both positive and negative effects on ecosystem multifunctionality. Proc. Natl Acad. Sci., 116, 8419–8424. - PMC - PubMed

LinkOut - more resources