. 2020 Oct 16;15(10):2766-2774.
doi: 10.1021/acschembio.0c00558. Epub 2020 Sep 14.

Unlocking Cryptic Metabolites with Mass Spectrometry-Guided Transposon Mutant Selection

Affiliations

Unlocking Cryptic Metabolites with Mass Spectrometry-Guided Transposon Mutant Selection

Aya Yoshimura et al. ACS Chem Biol. .

Abstract

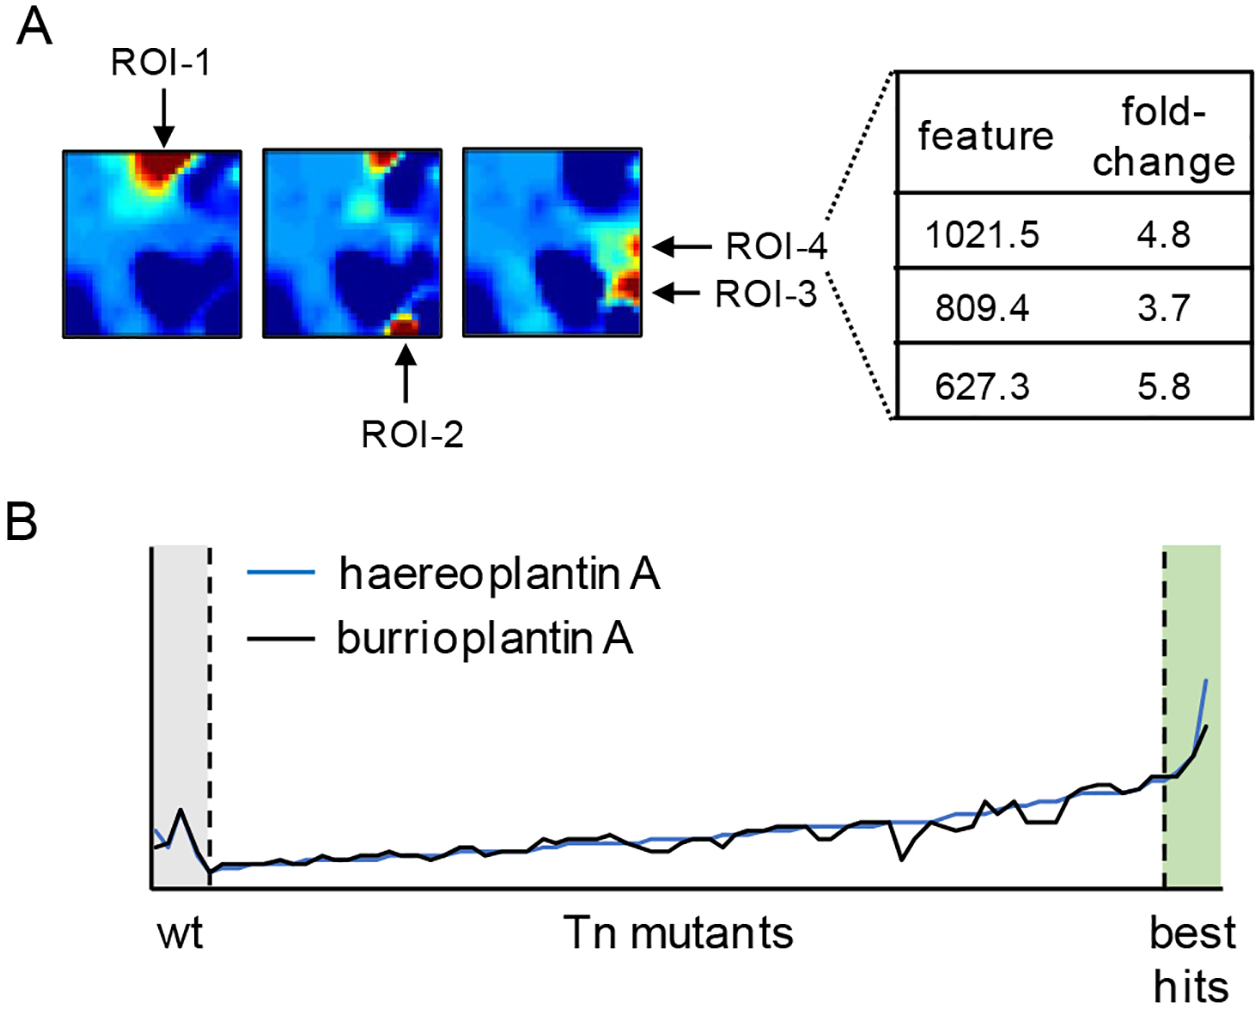
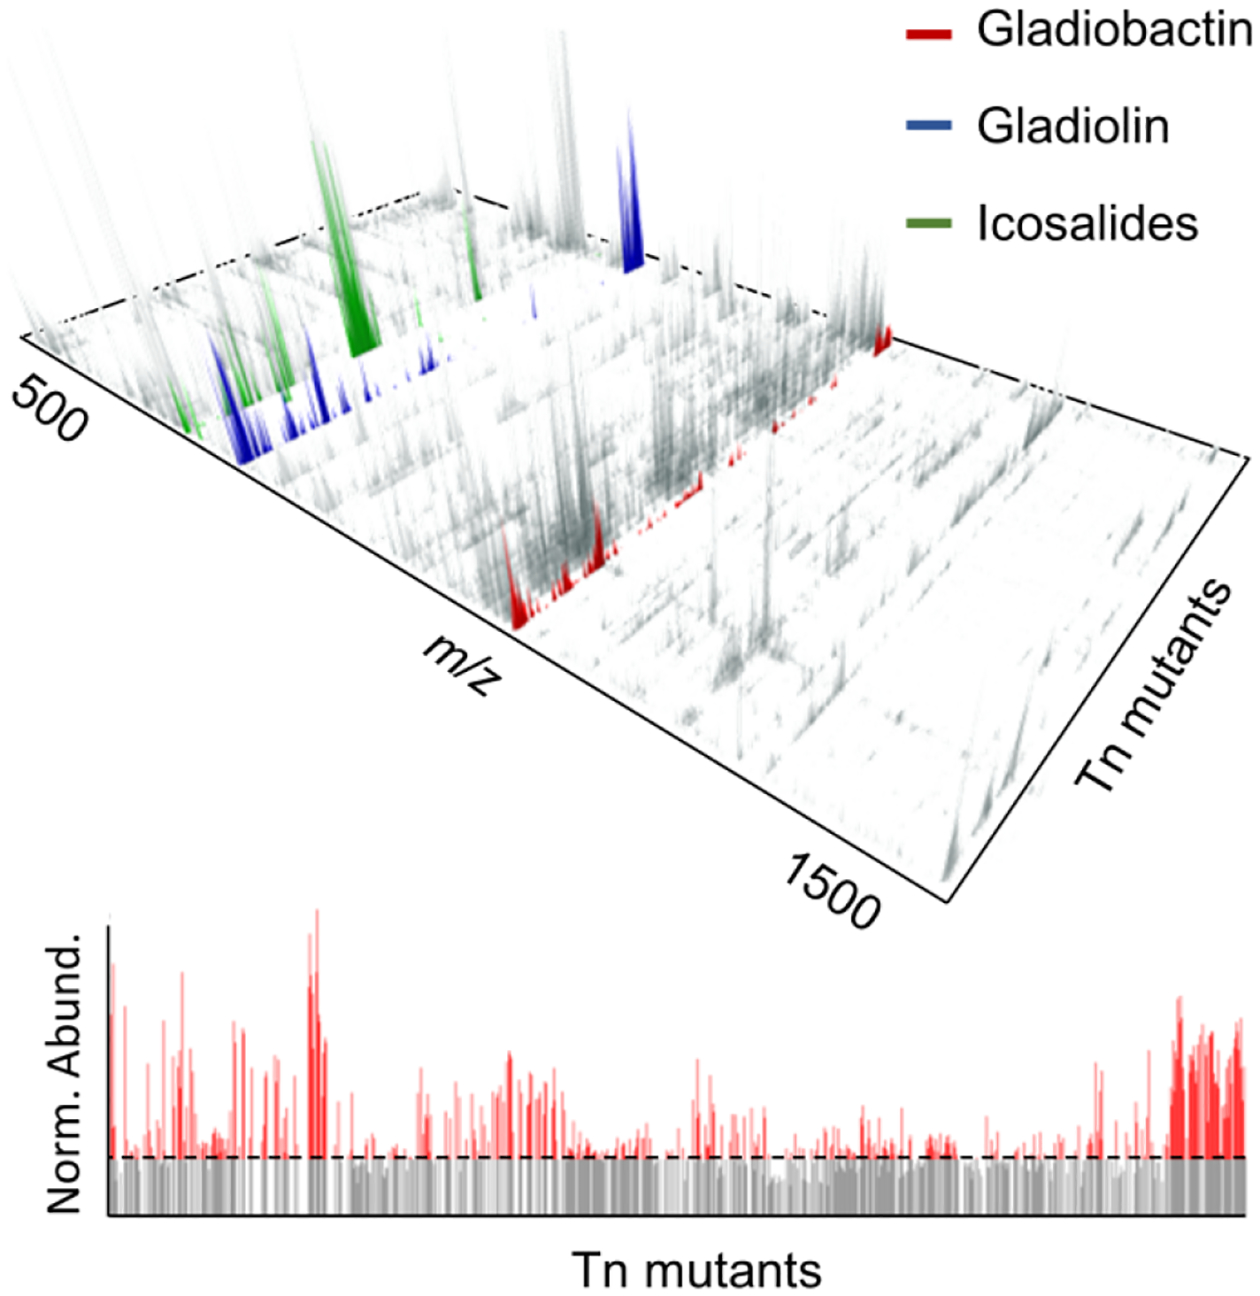
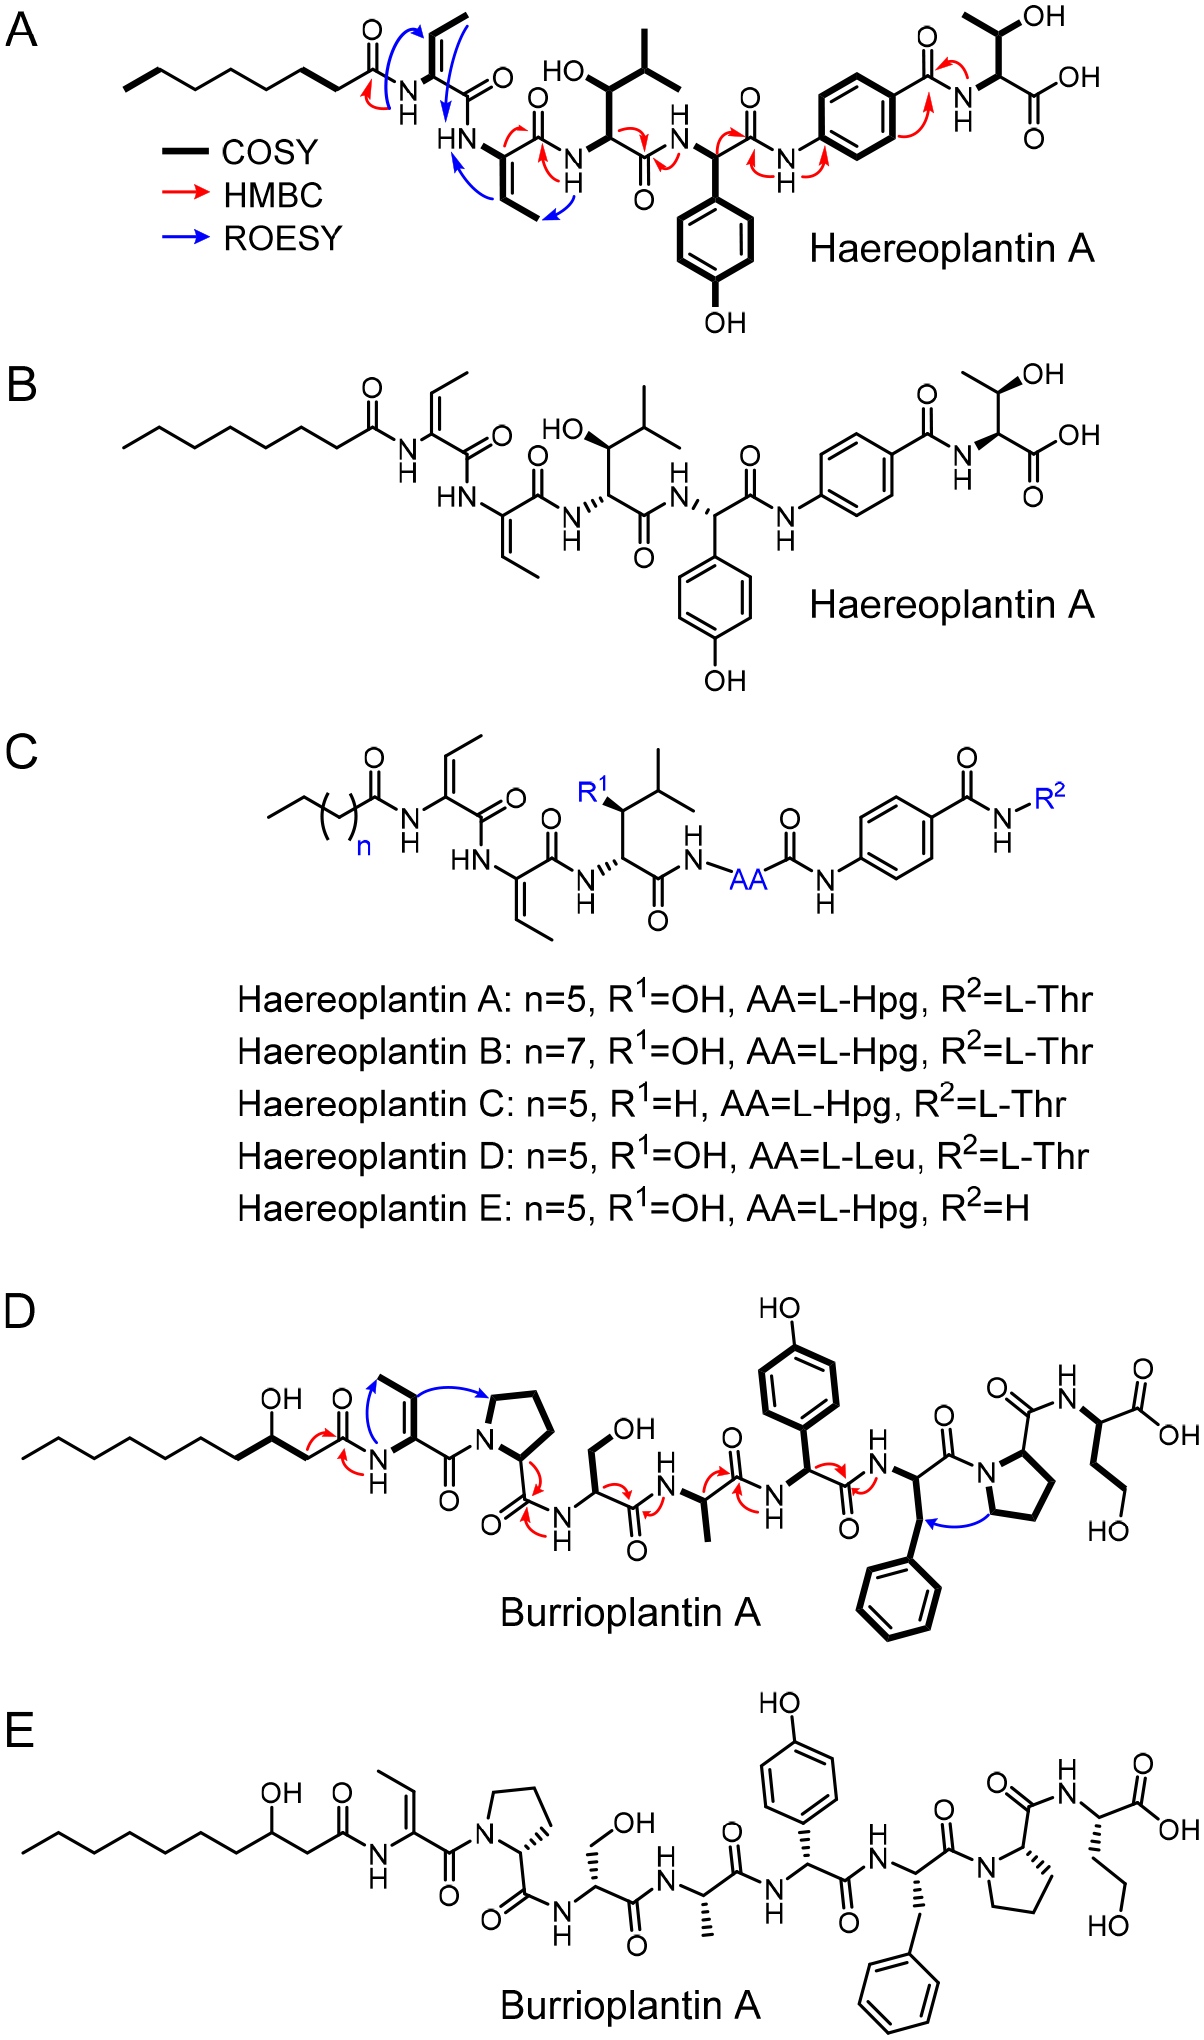
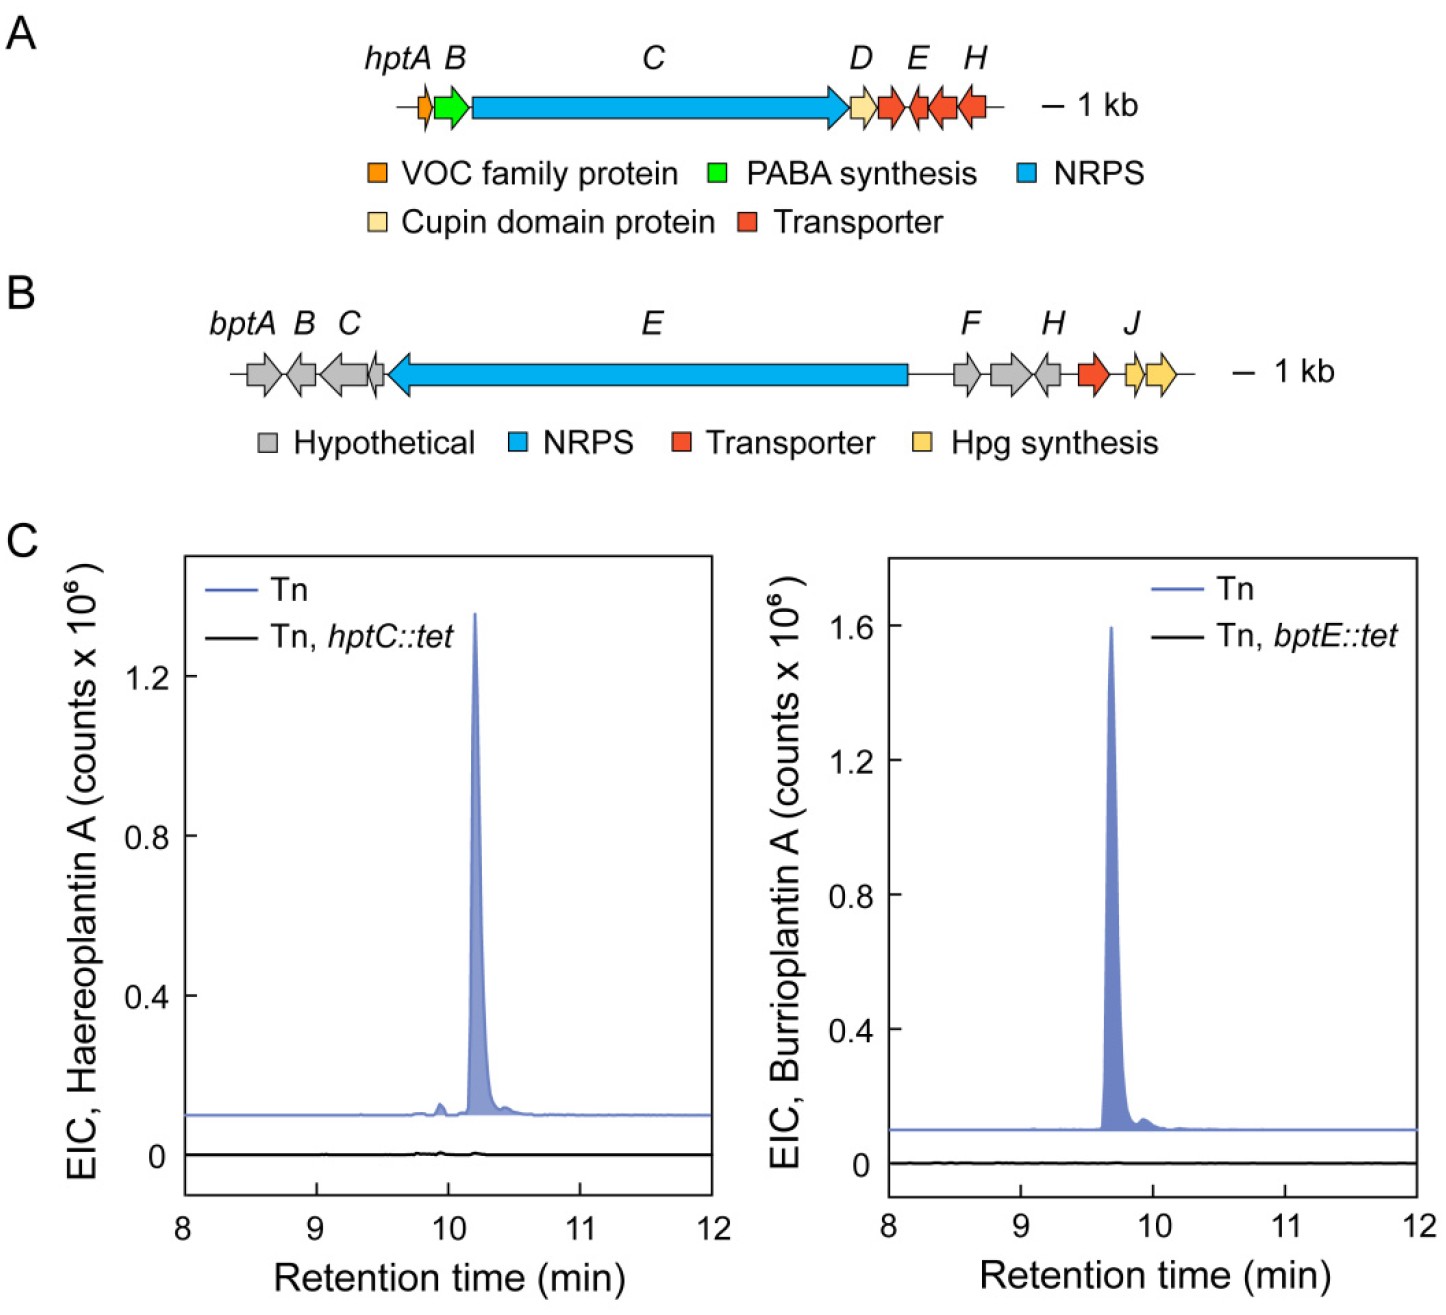
The products of most secondary metabolite biosynthetic gene clusters (BGCs) have yet to be discovered, in part due to low expression levels in laboratory cultures. Reporter-guided mutant selection (RGMS) has recently been developed for this purpose: a mutant library is generated and screened, using genetic reporters to a chosen BGC, to select transcriptionally active mutants that then enable the characterization of the "cryptic" metabolite. The requirement for genetic reporters limits the approach to a single pathway within genetically tractable microorganisms. Herein, we utilize untargeted metabolomics in conjunction with transposon mutagenesis to provide a global read-out of secondary metabolism across large numbers of mutants. We employ self-organizing map analytics and imaging mass spectrometry to identify and characterize seven cryptic metabolites from mutant libraries of two different Burkholderia species. Applications of the methodologies reported can expand our understanding of the products and regulation of cryptic BGCs across phylogenetically diverse bacteria.


Conflict of interest statement

The authors declare no competing financial interests.

Figures

Figure 1.
Figure 1.
Analysis of B. plantarii Tn mutants using HPLC-MS-based SOM analytics. (A) Three representative differential maps are shown. As described in SI methods, these were obtained by extracting features from HPLC-Qtof-MS data for each Tn mutant, arraying the features in a grid using self-organizing map software, and subtracting three-times the wt map from each mutant to yield the differential maps shown (Figure S1). Four major ROIs, which emerged from this analysis, are marked. Select metabolites in ROI-4 are highlighted. (B) Production of two compounds haereoplantin A (m/z 809.4) and burrioplantin A (m/z 1021.5) are correlated across all Tn mutants. One of these, in the ‘best hits’ zone, was selected for further study.
Figure 2.
Figure 2.
Analysis of B. gladioli Tn mutants using imaging mass spectrometry. (Top) 3D-Map of the global secondary metabolome of B. gladioli detected by LAESI-MS. The map shows the m/z and intensity of detected metabolites as a function of 960 Tn mutants. It was generated by analyzing the metabolome of each Tn mutant with LAESI-MS and extracting all ions detected for each Tn mutant with the appropriate software (see SI methods). Two-fold of the intensity observed in the wt sample was subtracted from the corresponding metabolite in the Tn mutant to give the 3D difference plot. Note that ions with intensities lower than 2-fold that of the wt are not shown. Peaks corresponding to gladiolin, icosalide, and a compound investigated further, gladiobactin, are highlighted. (Bottom) 2D-Slice out of the 3D plot focusing on gladiobactin intensity as a function of 960 Tn mutant. The dashed line indicates the level of gladiobactin synthesis by wt B. gladioli.
Figure 3.
Figure 3.
Identification of haereoplantins and burrioplantin from B. plantarii. (A) Relevant NMR correlations used to solve the structure of haereoplantin A. (B) Structure of haereoplantin A, including absolute configuration of chiral centers. (C) Structures of haereoplantin A–E. (D) Relevant NMR correlations used to solve the structure of burrioplantin A. (E) Structure of burrioplantin A, including absolute configuration of α-carbons.
Figure 4.
Figure 4.
Validation of the haereoplantin and burrioplantin BGCs. (A, B) The hpt and bpt biosynthetic loci. Genes are color coded as indicated. (C) (Left) Extracted ion chromatogram for haereoplantin A in the overproducing Tn mutant (blue trace) as well as the overproducing Tn mutant in which hptC is replaced with tet by insertional mutagenesis (black trace). (Right) Extracted ion chromatogram for burrioplantin A in the overproducing Tn mutant (blue trace) as well as the overproducing Tn mutant in which bptE is removed by insertional mutagenesis (black trace).
Figure 5.
Figure 5.
Gladiobactin structure and BGC. (A) Relevant NMR correlations used to solve the structure of gladiobactin A. (B) Structure of gladiobactin A, including absolute configuration of chiral centers. (C) Gladiobactin BGC; genes are color coded as indicated.
Figure 6.
Figure 6.
Identification of Tn insertion sites in the haereoplantin, burrioplantin, and gladiobactin overproducers. (A) Tn insertion in B. plantarii occurs in a DNA/RNA helicase, as indicated by the red pin. In B. gladioli, Tn insertion occurred into potF (red pin) in the pot operon. (B) Disruption of the DNA/RNA helicase recapitulates the effect of Tn insertion. (Left) Extracted ion chromatograms of haereoplantin A in wt B. plantarii (gray trace), the helicase::Tn mutant (red), and the helicase deletion mutant (helicase::tet, blue). (Right) Extracted ion chromatograms of burrioplantin A in wt B. plantarii (gray), Tn mutant (red), and helicase deletion mutant (blue). (C) Induction of gladiobactin synthesis by spermidine. Shown is cell density-normalized relative quantification of gladiobactin A as a function of exogenous spermidine concentrations. The relative levels of gladiobactin in each culture supernatant were determined from integration of the gladiobactin peak observed in extracted-ion chromatograms. The average from two independent measurements is reported. Error bars represent standard error.

References

    1. Newman DJ, and Cragg GM (2020) Natural Products as Sources of New Drugs over the Nearly Four Decades from 01/1981 to 09/2019. J. Nat. Prod 83, 770–803. - PubMed
    1. Nicolaou KC, Sorensen EJ, and Winssinger N (1998) The art and science of organic and natural products synthesis. J. Chem. Educ 75, 1226–1258.
    1. Nett M, Ikeda H, and Moore BS (2009) Genomic basis for natural product biosynthetic diversity in the actinomycetes. Nat. Prod. Rep 26, 1362–1384. - PMC - PubMed
    1. Jensen PR, Chavarria KL, Fenical W, Moore BS, and Ziemert N (2014) Challenges and triumphs to genomics-based natural product discovery. J. Ind. Microbiol. Biotechnol 41, 203–209. - PMC - PubMed
    1. Liu X, and Cheng YQ (2014) Genome-guided discovery of diverse natural products from Burkholderia sp. J. Ind. Microbiol. Biotechnol 41, 275–284. - PMC - PubMed

Publication types

Substances