. 2020 Dec;43(6):1161-1174.
doi: 10.1007/s13402-020-00549-x. Epub 2020 Aug 18.

Macrophage-secreted MMP9 induces mesenchymal transition in pancreatic cancer cells via PAR1 activation

Affiliations

Macrophage-secreted MMP9 induces mesenchymal transition in pancreatic cancer cells via PAR1 activation

Cansu Tekin et al. Cell Oncol (Dordr). 2020 Dec.

Abstract

Purpose: Targeting tumor-infiltrating macrophages limits progression and improves chemotherapeutic responses in pancreatic ductal adenocarcinoma (PDAC). Protease-activated receptor (PAR)1 drives monocyte/macrophage recruitment, and stromal ablation of PAR1 limits cancer growth and enhances gemcitabine sensitivity in experimental PDAC. However, the functional interplay between PAR1, macrophages and tumor cells remains unexplored. Here we address the PAR1-macrophage-tumor cell crosstalk and assess its contributions to tumor progression.

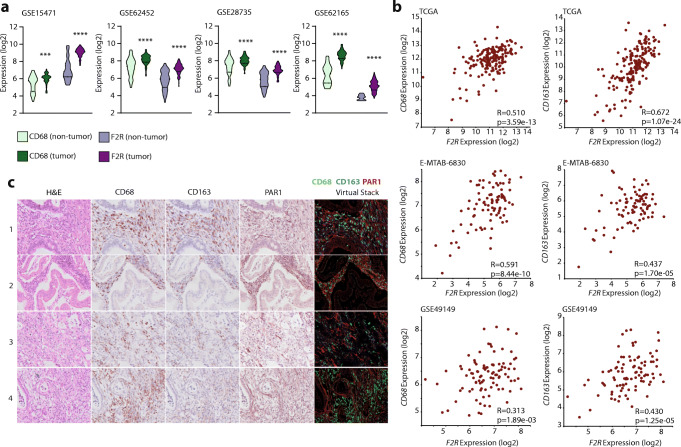
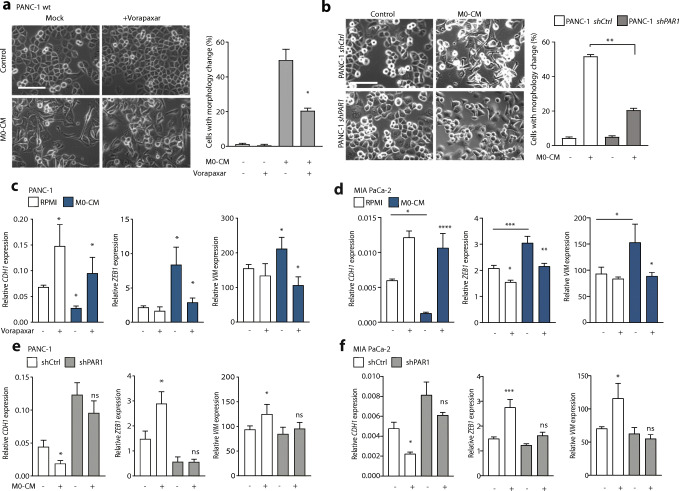
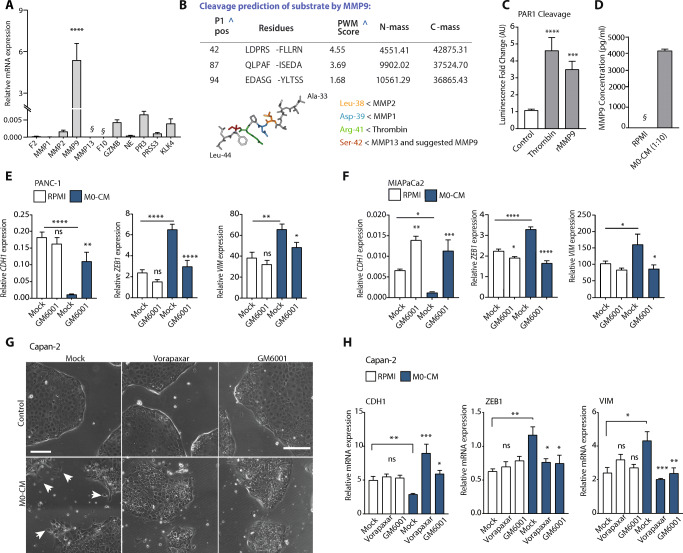
Methods: PAR1 expression and macrophage infiltration were correlated in primary PDAC biopsies using gene expression datasets and tissue microarrays. Medium transfer experiments were used to evaluate the functional consequences of macrophage-tumor cell crosstalk and to assess the contribution of PAR1 to the observed responses. PAR1 cleavage assays were used to identify a macrophage-secreted PAR1 agonist, and the effects of candidate proteases were assessed in medium transfer experiments with specific inhibitors and/or recombinant agonist.

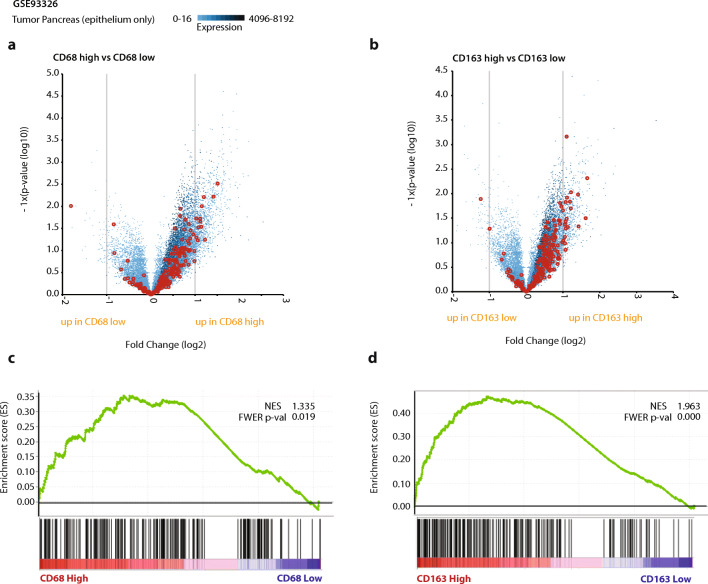
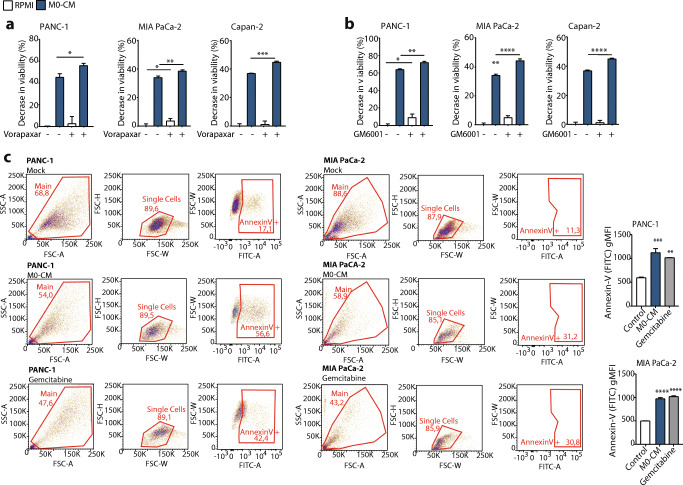
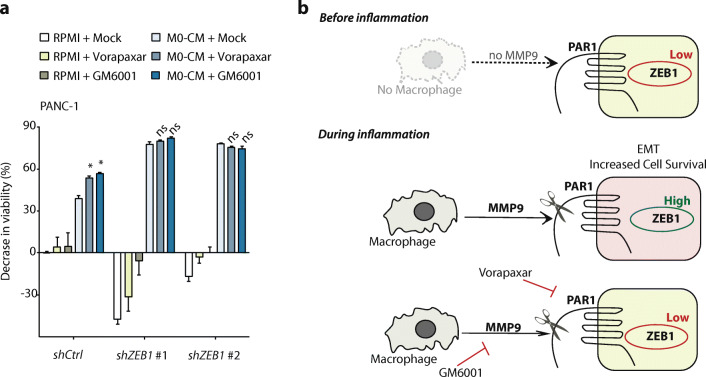
Results: PAR1 expression correlates with macrophage infiltration in primary PDACs, and macrophages induce mesenchymal transition of PDAC cells through PAR1 activation. Protease profiling identified macrophage-secreted matrix metalloprotease 9 (MMP9) as the relevant PAR1 agonist in PDAC. PAR1 and/or MMP9 inhibition limited macrophage-driven mesenchymal transition. Likewise, preventing mesenchymal transition by silencing ZEB1 or by pharmacological inhibition of the MMP9/PAR1 axis significantly reduced the ability of tumor cells to survive the anti-tumor activities of macrophages.

Conclusion: Macrophages secrete MMP9, which acts upon PDAC cell PAR1 to induce mesenchymal transition. This macrophage-induced mesenchymal transition supports the tumor-promoting role of macrophage influx, explaining the dichotomous contributions of these immune cells to tumor growth.

Keywords: EMT; MMP9; Macrophages; PAR1; PDAC; Pancreatic cancer.


Conflict of interest statement

The authors declare that they have no competing interests. MFB has received research funding from Celgene and has acted as a consultant for Servier. These parties were not involved in the design or drafting of this manuscript.

Figures

Fig. 1
Fig. 1
PAR1 is predominantly expressed in tumor tissue and correlates with macrophage markers. (A) Density plots for expression of CD68 (green) and PAR1(F2R) (purple) in the GSE15471, GSE62452, GSE28735 and GSE62165 datasets. For each set, expression in pancreatic cancer patients (dark) and non-tumor controls (light) is indicated. Student’s t test was used to determine the significance of the differences in expression between the tumor and non-tumor control groups. (B) Correlations between F2R and CD68 or CD163 expression (log2 scale) in the TCGA-PDAC, E-MTAB-6830 and GSE49149 datasets. On the lower right corner of each graph, p-values and Pearson correlation coefficients (R) are shown. (C) Pancreatic tumor microarray staining for CD68, CD163, PAR1, and H&E. Each layer was scanned separately and generated as virtual stacks in ImageJ. The virtual image stack on the right represents CD68 (green), CD163 (blue) and PAR1 (red) staining
Fig. 2
Fig. 2
Macrophages induce EMT of pancreatic cancer cells in a PAR1-dependent manner. (A) Phase-contrast microscopic images of PANC-1 wildtype cells treated with control or M0-CM medium. PAR1 was inhibited by Vorapaxar (500 nM) using DMSO as a mock control. Spindle-shaped cells were quantified using the cell counter tool of Image J, after which the percentage per field was calculated according to the total number of cells. Shown is the mean ± SEM (n = 3); Student’s t test. (B) Morphology assessment of shCtrl and shPAR1 PANC-1 cells treated with M0-CM. Spindle-shaped cells were quantified using the cell counter tool of Image J, after which the percentage per field was calculated according to the total number of cells. Shown is the mean ± SEM (n = 3); Student’s t test. In panels A and B, magnification is 20x, and the scale bar indicates 50 μm. (C-D) Relative mRNA expression of CDH1, ZEB1 and VIM in RPMI-1640 (white) or M0-CM (blue) treated PANC-1 (C) and MIA PaCa-2 (D) cells. PAR1 was inhibited by Vorapaxar (500 nM) using DMSO as a mock control. Shown is the mean ± SEM (n = 4); Student’s t test. (E-F) Relative mRNA expression of CDH1, ZEB1 and VIM in RPMI-1640 (−) or M0-CM (+) treated PANC-1 (E) or MIA PaCa-2 (F) shCtrl (white) and shPAR1 (gray) cells. Shown is the mean ± SEM (n = 4); Student’s t test. Relative expression levels, as depicted in panels C-F, were calculated using the comparative threshold cycle (dCt method) and normalized to the expression of the reference gene TBP
Fig. 3
Fig. 3
Macrophage influx correlates with EMT of cancer cells. High CD68 and CD163 macrophage marker expression in stroma indicate enhanced EMT in epithelial cells. (A-B) Differential expression analysis of tumor cells dichotomized on the stromal expression of CD68 (A) or CD163 (B) with genes from the Hallmark_EMT signature highlighted in red. (C-D) Gene Set Enrichment Analysis (GSEA) results for human PDAC cells from the GSE93326 expression set (dichotomized for median CD68 (C) or CD163 (D)) with the Hallmark_EMT signature. Normalized Enhancement Score (NES) and Family-Wise Error Rate (FWER) p-values are shown on the enrichment plots
Fig. 4
Fig. 4
Macrophage-secreted MMP9 activates PAR1. (A) Relative mRNA expression levels of PAR1-cleaving proteases in M0 macrophages. The expression levels of F2 (Thrombin), MMP1, MMP2, MMP9, MMP13, F10 (FX), GZMB, NE, PR3, PRSS3 and KLK4 are shown as mean ± SEM (n = 4); Student’s t test. § indicates signals below the detection limit. (B) MMP9 cleavage prediction of the PAR1 N-terminal amino acid sequence, derived from the FASTA sequence of Uniprot ID: P25116. P1 position, sequence, and PWM (position weight matrices) are shown together with the mass of the N- and C-terminal sequences after cleavage. Below the table, a stick representation for the PAR1 N-terminal amino acid sequence, where protease cleavage sites are concentrated, is shown. In this representation, locations for MMP2 (yellow), MMP1 (blue), Thrombin (Green) and MMP13, together with MMP9 (red) are indicated. (C) Quantification of PAR1 cleavage with 100 nM recombinant MMP9 (rMMP9) and 0.1 U/ml Thrombin in PAR1-SEAP assays. N = 4. Error bars show mean ± SEM. One-way ANOVA. (D) MMP9 levels in M0-CM and RPMI-1640 media. Shown is the mean ± SEM (n = 4); Student’s t test. § indicates signals below the detection limit. (E-F) Relative mRNA expression of CDH1, ZEB1 and VIM in RPMI-1640 (white) or M0-CM (blue) treated PANC-1 (E) and MIA PaCa-2 (F) cells. MMP9 was inhibited by GM6001 (5 μM) using DMSO as a mock control. Shown is the mean ± SEM (n = 4); Student’s t test. (G) Phase-contrast microscope image of Capan-2 cells after control (1:1 DMEM+RPMI-1640) and M0-CM treatment. PAR1 was inhibited by Vorapaxar (500 nM), MMP9 was inhibited by GM6001 (5 μM), and DMSO served as a mock control. Shown are images at t = 72 h after the addition of M0-CM. Magnification is 10x, and scale bars indicate 100 μm. (H) Relative mRNA expression of CDH1, ZEB1 and VIM in RPMI-1640 (white) or M0-CM (blue) treated Capan-2 cells. PAR1 was inhibited by Vorapaxar (500 nM), MMP9 was inhibited by GM6001 (5 μM), and DMSO served as a mock control. Shown is the mean ± SEM (n = 4); Student’s t test. Relative expression levels, as depicted in panels E, F, and H, were calculated using the comparative threshold cycle (dCt method) and normalized to the expression of the reference gene TBP
Fig. 5
Fig. 5
The PAR1-MMP9 axis reduces macrophage induced cytotoxicity. (A-B) MTT viability assay of PANC-1, MIA PaCa-2 and Capan-2 cells in RPMI-1640 (white) or M0-CM (blue) medium. Shown in the effect of PAR1 inhibition with 500 nM Vorapaxar (A) or MMP9 inhibition with 5 μM GM6001 (B). Decreased viability is calculated relative to the viability of control-treated cells. Shown is the mean ± SEM (n = 6); One-way ANOVA. (C) Annexin V-FITC+ cells in mock (RPMI-1640), M0-CM, or positive-control (Gemcitabine) treated PANC-1 and MIA PaCa-2 cells at t = 48 h. Left panel: gating strategy for the Annexin V+ population. The FITC gate was set on antibody controls. Right panel: geometric Mean Fluorescent Intensity (gMFI) on the FITC channel (Annexin V density) for Mock, M0-CM, and positive-control treated cells from the previous panel is given. Shown is the mean ± SEM (n = 3); One-way ANOVA
Fig. 6
Fig. 6
Mesenchymal transition protects tumor cells from macrophage induced cytotoxicity. (A) MTT viability assays of PANC-1 shCtrl, shZEB1 #1 and shZEB1 #2 cells treated with RPMI-1640 (green bars) or M0-CM (blue bars). PAR1 was inhibited by Vorapaxar (500 nM), MMP9 was inhibited by GM6001 (5 μM), and DMSO served as a mock control. Decreased viability was calculated relative to the viability of control-treated cells. Shown is the mean ± SEM (n = 6); One-way ANOVA. (B) Schematic representation showing that macrophages secrete MMP9 that activates PAR1 on pancreatic cancer cells, thereby inducing mesenchymal transition and subsequent resistance to macrophage-induced cytotoxicity

Similar articles

Cited by

References

    1. Li D, Xie K, Wolff R, Abbruzzese JL. Pancreatic cancer. Lancet. 2004;363:1049–1057. - PubMed
    1. Siegel RL, Miller KD, Jemal A. Cancer statistics, 2019. CA Cancer J. Clin. 2019;69:7–34. - PubMed
    1. Burris HA, 3rd, Moore MJ, Andersen J, Green MR, Rothenberg ML, Modiano MR, Cripps MC, Portenoy RK, Storniolo AM, Tarassoff P, Nelson R, Dorr FA, Stephens CD, Von Hoff DD. Improvements in survival and clinical benefit with gemcitabine as first-line therapy for patients with advanced pancreas cancer: A randomized trial. J. Clin. Oncol. 1997;15:2403–2413. - PubMed
    1. T. Conroy, F. Desseigne, M. Ychou, O. Bouché, R. Guimbaud, Y. Bécouarn, A. Adenis, J.L. Raoul, S. Gourgou-Bourgade, C. de la Fouchardière, J. Bennouna, J.B. Bachet, F. Khemissa-Akouz, D. Péré-Vergé, C. Delbaldo, E. Assenat, B. Chauffert, P. Michel, C. Montoto-Grillot, M. Ducreux, Groupe Tumeurs digestives of Unicancer, and PRODIGE intergroup, FOLFIRINOX versus gemcitabine for metastatic pancreatic cancer. New Engl. J. Med. 364, 1817–1825 (2011) - PubMed
    1. Von Hoff DD, Ervin T, Arena FP, Chiorean EG, Infante J, Moore M, Seay T, Tjulandin SA, Ma WW, Saleh MN, Harris M, Reni M, Dowden S, Laheru D, Bahary N, Ramanathan RK, Tabernero J, Hidalgo M, Goldstein D, Van Cutsem E, Wei X, Iglesias J, Renschler MF. Increased survival in pancreatic cancer with nab-paclitaxel plus gemcitabine. New Engl. J. Med. 2013;369:1691–1703. - PMC - PubMed