. 2020 Dec 1;130(12):6443-6456.
doi: 10.1172/JCI126584.

Intestinal proinflammatory macrophages induce a phenotypic switch in interstitial cells of Cajal

Affiliations

Intestinal proinflammatory macrophages induce a phenotypic switch in interstitial cells of Cajal

Xuyong Chen et al. J Clin Invest. .

Abstract

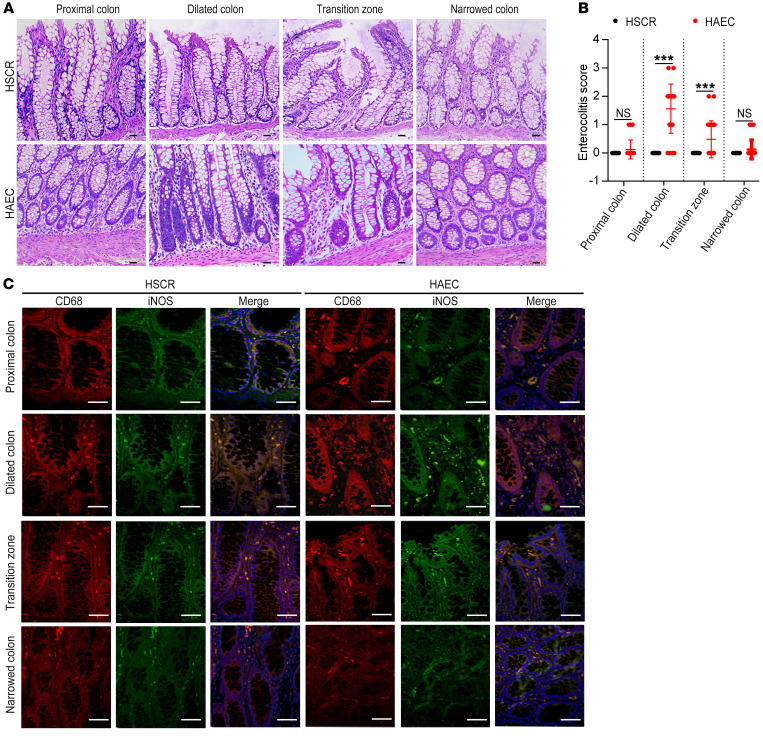
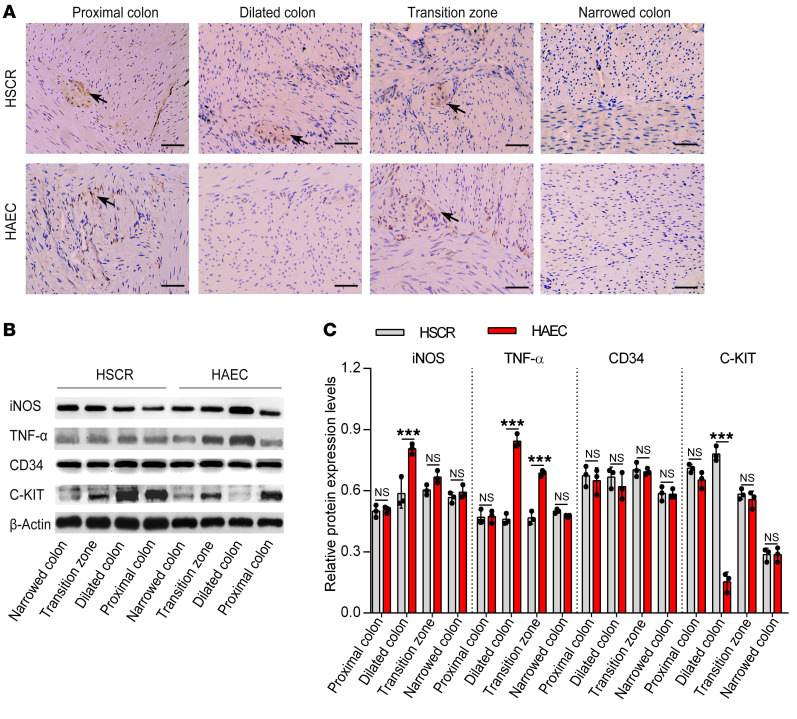
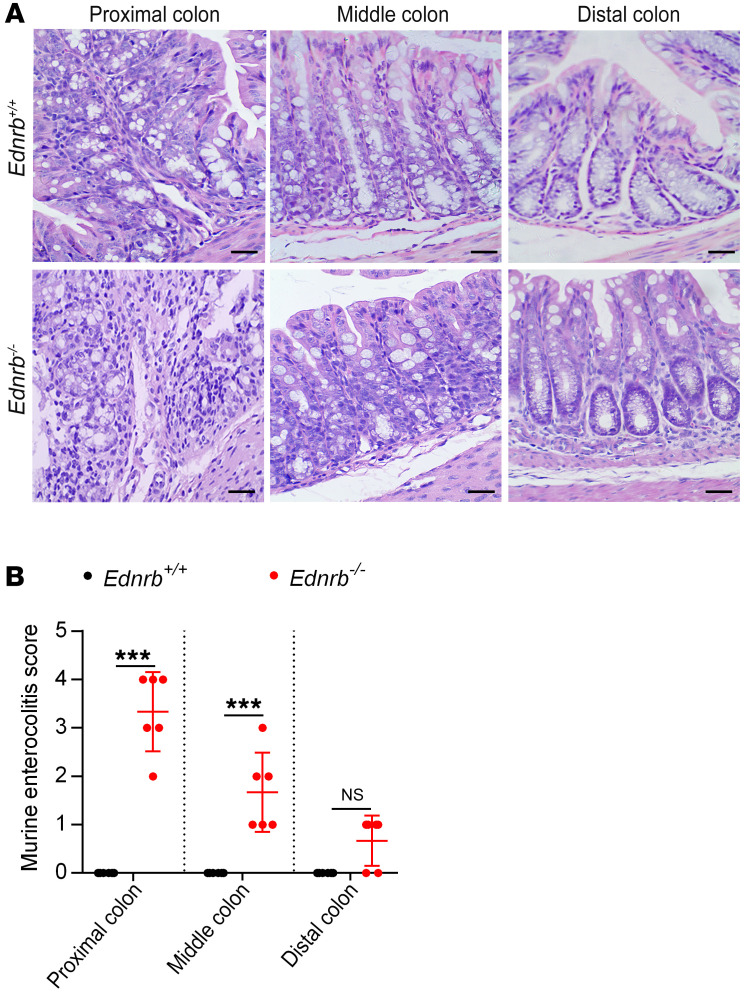
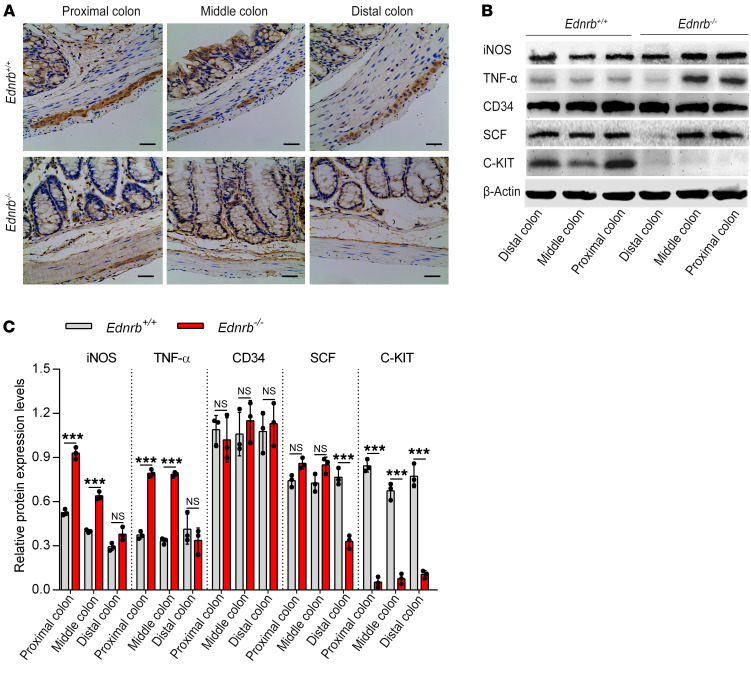
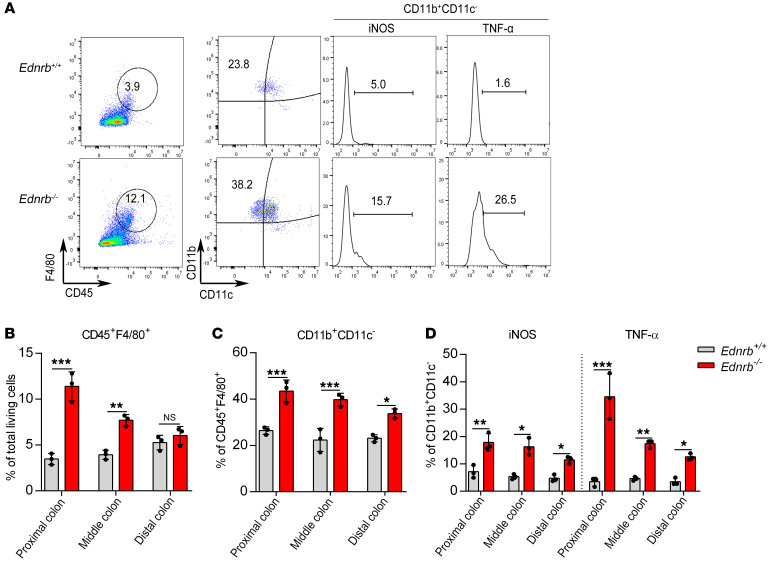
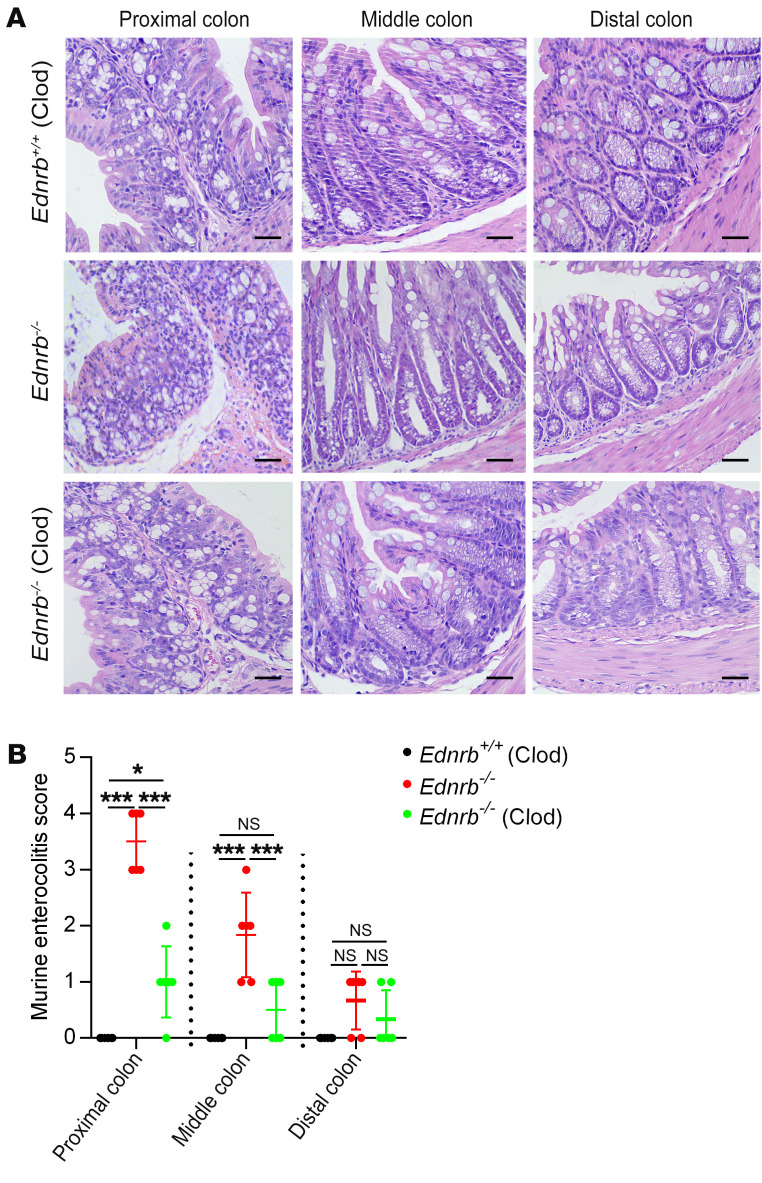
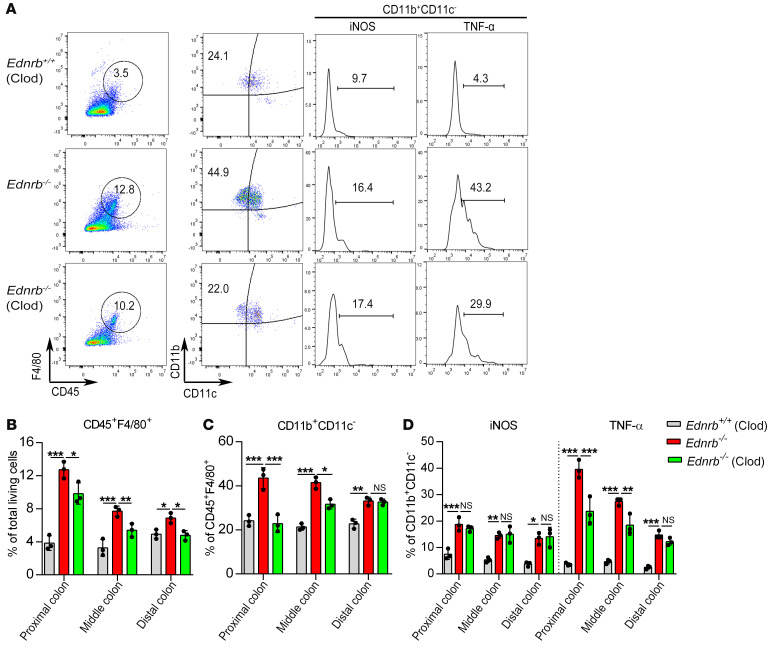
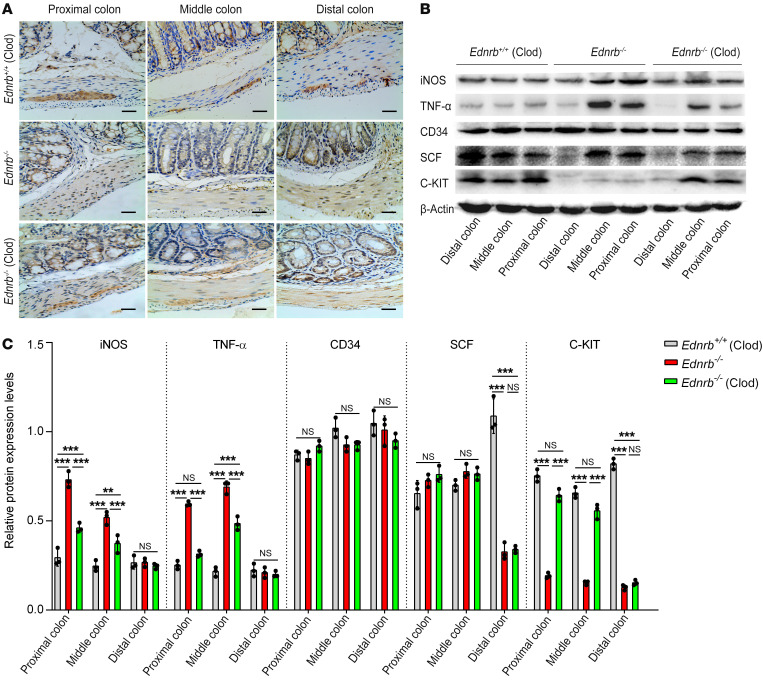
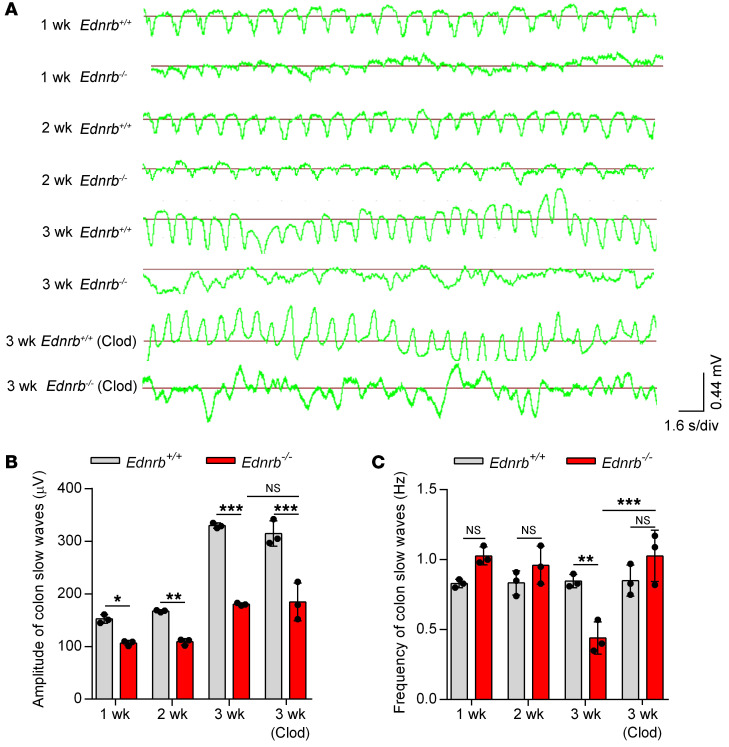
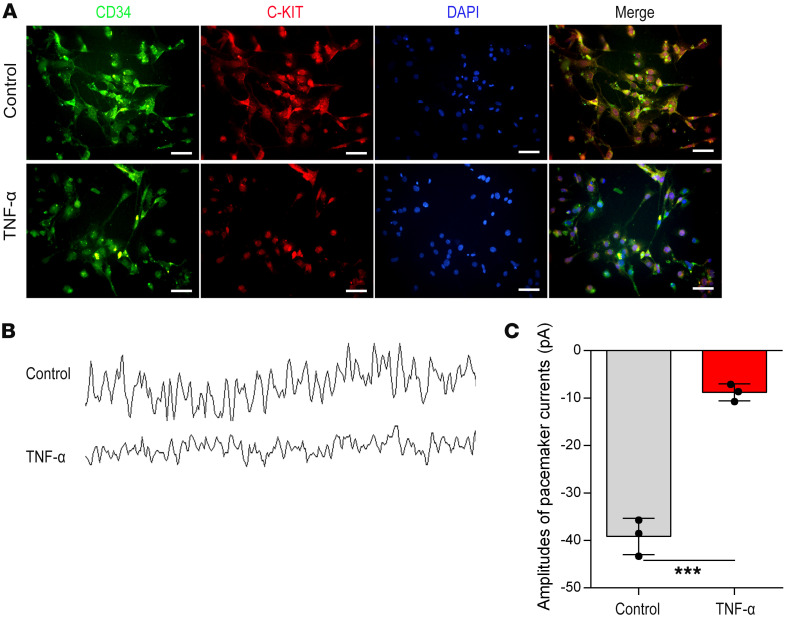
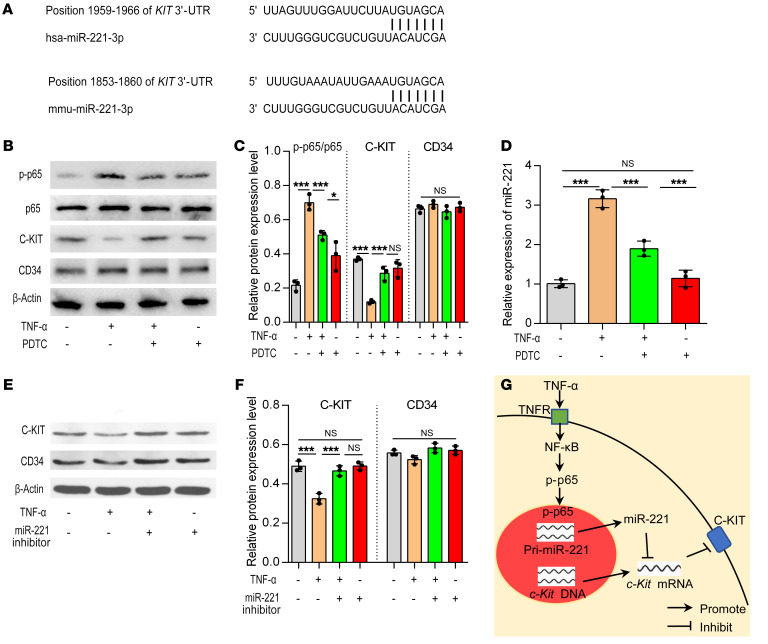
Interstitial cells of Cajal (ICCs) are pacemaker cells in the intestine, and their function can be compromised by loss of C-KIT expression. Macrophage activation has been identified in intestine affected by Hirschsprung disease-associated enterocolitis (HAEC). In this study, we examined proinflammatory macrophage activation and explored the mechanisms by which it downregulates C-KIT expression in ICCs in colon affected by HAEC. We found that macrophage activation and TNF-α production were dramatically increased in the proximal dilated colon of HAEC patients and 3-week-old Ednrb-/- mice. Moreover, ICCs lost their C-KIT+ phenotype in the dilated colon, resulting in damaged pacemaker function and intestinal dysmotility. However, macrophage depletion or TNF-α neutralization led to recovery of ICC phenotype and restored their pacemaker function. In isolated ICCs, TNF-α-mediated phosphorylation of p65 induced overexpression of microRNA-221 (miR-221), resulting in suppression of C-KIT expression and pacemaker currents. We also identified a TNF-α/NF-κB/miR-221 pathway that downregulated C-KIT expression in ICCs in the colon affected by HAEC. These findings suggest the important roles of proinflammatory macrophage activation in a phenotypic switch of ICCs, representing a promising therapeutic target for HAEC.

Keywords: Gastroenterology; Inflammatory bowel disease; Macrophages.


Conflict of interest statement

Conflict of interest: The authors have declared that no conflict of interest exists.

Figures

Figure 1
Figure 1. Enterocolitis score increases and macrophages infiltrate in the dilated colon of HAEC patients.
(A) H&E staining of the proximal resection margin, dilated segment, transition zone, and narrowed colon of HSCR and HAEC patients. Scale bars: 100 μm. (B) An enterocolitis grading system was used to evaluate inflammation. (C) CD68 and iNOS immunofluorescence double staining to identify M1 macrophages. Red, CD68; green, iNOS; blue, DAPI. Scale bars: 100 μm. Data shown are representative of n = 75 samples of HSCR patients and n = 21 samples of HAEC patients. One-way ANOVA: ***P < 0.001.
Figure 2
Figure 2. Proinflammatory cytokines increase, whereas C-KIT+ ICCs decrease, in the dilated colon of HAEC patients.
(A) Immunohistochemistry staining of ICCs of HSCR and HAEC patients for C-KIT. Scale bars: 100 μm. Data are representative of n = 75 samples of HSCR patients and n = 21 samples of HAEC patients. Arrows indicate C-KIT+ ICCs. (B) Western blotting of colon of HSCR and HAEC patients. (C) Semiquantitative analysis of protein expression levels, with each protein being normalized to β-actin. One-way ANOVA: ***P < 0.001.
Figure 3
Figure 3. Enterocolitis score increases in the proximal colon of 3-week-old Ednrb–/– mice.
(A) H&E staining of proximal, middle, and distal colon sections from 3-week-old Ednrb+/+ and Ednrb–/– mice. Scale bars: 100 μm. (B) An enterocolitis grading system was used to evaluate inflammation. Data shown represent results from 6 independent experiments. One-way ANOVA: ***P < 0.001.
Figure 4
Figure 4. Proinflammatory cytokines increase but C-KIT+ ICCs decrease in the proximal colon of 3-week-old Ednrb–/– mice.
(A) Immunohistochemistry staining of ICCs from 3-week-old Ednrb+/+ and Ednrb–/– mice for C-KIT. Scale bars: 100 μm. (B) Western blotting of colon from 3-week-old Ednrb+/+ and Ednrb–/– mice. (C) Semiquantitative analysis of protein expression levels, with each protein being normalized to β-actin. Data shown represent results from 3 independent experiments. One-way ANOVA: ***P < 0.001.
Figure 5
Figure 5. Proinflammatory M1 macrophages increase in the proximal colon of 3-week-old Ednrb–/– mice.
(A) Representative analysis of CD45+F4/80+, CD11b+CD11c, iNOS+, and TNF-α+ cells in the proximal colon from 3-week-old Ednrb+/+ and Ednrb–/– mice. (B) Percentage of CD45+F4/80+ cells among total viable cells in colonic tissue. (C) Percentage of CD11b+CD11c cells among CD45+F4/80+ cells. (D) Percentage of iNOS+ cells and TNF-α+ cells among CD11b+CD11c cells. Data shown represent results from 3 independent experiments. One-way ANOVA: *P < 0.05; **P < 0.01; ***P < 0.001.
Figure 6
Figure 6. Clod treatment alleviates colitis in 3-week-old Ednrb–/– mice.
(A) H&E staining of proximal, middle, and distal colon from 3-week-old Ednrb+/+ and Ednrb–/– mice treated with Clod. Scale bars: 100 μm. (B) An enterocolitis grading system was used to evaluate inflammation. Data shown represent results from 6 independent experiments. One-way ANOVA: *P < 0.05; ***P < 0.001.
Figure 7
Figure 7. Proinflammatory M1 macrophages decrease in the proximal colon of 3-week-old Ednrb–/– mice after Clod treatment.
(A) Representative analysis of CD45+F4/80+, CD11b+CD11c, iNOS+, and TNF-α+ cells in the proximal colon from 3-week-old Ednrb+/+ and Ednrb–/– mice treated with Clod. (B) Percentage of CD45+F4/80+ cells among total viable cells in colonic tissue. (C) Percentage of CD11b+CD11c cells among CD45+F4/80+ cells. (D) Percentage of iNOS+ cells and TNF-α+ cells among CD11b+CD11c cells. Data shown represent results from 3 independent experiments. One-way ANOVA: *P < 0.05; **P < 0.01; ***P < 0.001.
Figure 8
Figure 8. Clod treatment suppresses inflammatory cytokine production and promotes recovery of ICC phenotype in 3-week-old Ednrb–/– mice.
(A) Immunohistochemistry staining for C-KIT in ICCs from 3-week-old Ednrb+/+ and Ednrb–/– mice treated with Clod. Scale bars: 100 μm. (B) Western blot analysis of colon from 3-week-old Ednrb+/+ and Ednrb–/– mice treated with Clod. (C) Semiquantitative analysis of protein expression levels, with each protein being normalized to β-actin. Data shown represent results from 3 independent experiments. One-way ANOVA: **P < 0.01; ***P < 0.001.
Figure 9
Figure 9. Clod treatment restores murine colon slow waves.
(A) Colonic slow waves from 1-, 2-, and 3-week-old Ednrb+/+ and Ednrb–/– mice, and 3-week-old Ednrb+/+ and Ednrb–/– mice treated with Clod. s/div, seconds/division. (B and C) The amplitudes (B) and frequencies (C) of colonic slow waves of 1-, 2-, and 3-week-old Ednrb+/+ and Ednrb–/– mice are shown. Data shown represent results from 3 independent experiments. One-way ANOVA: *P < 0.05; **P < 0.01; ***P < 0.001.
Figure 10
Figure 10. TNF-α induces downregulation of C-KIT and inhibits the pacemaker currents of isolated ICCs.
(A) C-KIT and CD34 immunofluorescence double staining was used to identify the ICC phenotype with or without TNF-α treatment. Green, CD34; red, C-KIT; blue, DAPI. Scale bars: 100 μm. (B) Pacemaker currents of ICCs were recorded using the whole-cell mode of the patch clamp technique. (C) Amplitudes of pacemaker currents with or without TNF-α treatment. Data shown represent results from 3 independent experiments. Student’s t test: ***P < 0.001.
Figure 11
Figure 11. The TNF-α/NF-κB/miR-221 signaling pathway is involved in C-KIT expression in isolated ICCs.
(A) TargetScan software was used to predict the possible miRNAs that could target the 3′-UTR of c-Kit mRNA in humans and mice. (B) Western blotting of isolated ICCs with or without TNF-α and PDTC treatment. (C) Semiquantitative analysis of protein expression levels with each protein normalized to β-actin. (D) MiR-221 expression levels with or without TNF-α and PDTC treatment. (E and F) Western blot analysis of C-KIT and CD34 in isolated ICCs with or without TNF-α and miR-221 inhibitor treatment. Semiquantitative analysis of protein expression levels with each protein normalized to β-actin. Data shown represent results from 3 independent experiments. (G) The signaling pathway involving TNF-α, miR-221, and C-KIT in ICCs. One-way ANOVA: *P < 0.05; ***P < 0.001.

Similar articles

Cited by

References

    1. Langer JC. Hirschsprung disease. Curr Opin Pediatr. 2013;25(3):368–374. doi: 10.1097/MOP.0b013e328360c2a0. - DOI - PubMed
    1. Demehri FR, Halaweish IF, Coran AG, Teitelbaum DH. Hirschsprung-associated enterocolitis: pathogenesis, treatment and prevention. Pediatr Surg Int. 2013;29(9):873–881. doi: 10.1007/s00383-013-3353-1. - DOI - PubMed
    1. Jiao CL, Chen XY, Feng JX. Novel insights into the pathogenesis of Hirschsprung’s-associated enterocolitis. Chin Med J. 2016;129(12):1491–1497. doi: 10.4103/0366-6999.183433. - DOI - PMC - PubMed
    1. Sanders KM. Spontaneous electrical activity and rhythmicity in gastrointestinal smooth muscles. Adv Exp Med Biol. 2019;1124:3–46. doi: 10.1007/978-981-13-5895-1_1. - DOI - PMC - PubMed
    1. Yamataka A, et al. A lack of intestinal pacemaker (c-kit) in aganglionic bowel of patients with Hirschsprung’s disease. J Pediatr Surg. 1995;30(3):441–444. doi: 10.1016/0022-3468(95)90051-9. - DOI - PubMed

Publication types

MeSH terms