. 2020 Sep 17;5(18):e124465.
doi: 10.1172/jci.insight.124465.

Granzyme A-producing T helper cells are critical for acute graft-versus-host disease

Affiliations

Granzyme A-producing T helper cells are critical for acute graft-versus-host disease

Sungtae Park et al. JCI Insight. .

Abstract

Acute graft-versus-host disease (aGVHD) can occur after hematopoietic cell transplant in patients undergoing treatment for hematological malignancies or inborn errors. Although CD4+ T helper (Th) cells play a major role in aGVHD, the mechanisms by which they contribute, particularly within the intestines, have remained elusive. We have identified a potentially novel subset of Th cells that accumulated in the intestines and produced the serine protease granzyme A (GrA). GrA+ Th cells were distinct from other Th lineages and exhibited a noncytolytic phenotype. In vitro, GrA+ Th cells differentiated in the presence of IL-4, IL-6, and IL-21 and were transcriptionally unique from cells cultured with either IL-4 or the IL-6/IL-21 combination alone. In vivo, both STAT3 and STAT6 were required for GrA+ Th cell differentiation and played roles in maintenance of the lineage identity. Importantly, GrA+ Th cells promoted aGVHD-associated morbidity and mortality and contributed to crypt destruction within intestines but were not required for the beneficial graft-versus-leukemia effect. Our data indicate that GrA+ Th cells represent a distinct Th subset and are critical mediators of aGVHD.

Keywords: Immunology; Inflammation; T cells; Th1 response.


Conflict of interest statement

Conflict of interest: The authors have declared that no conflict of interest exists.

Figures

Figure 1
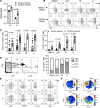
Figure 1. GrA+ Th cells are a hallmark of intestinal GVHD and represent a distinct Th subset.
Irradiated BALB/c mice received syngeneic (BALB/cBALB/c) or allogeneic (C57BL/6BALB/c) bone marrow and T cells. After transplant (day 10), small intestine (SI) and large intestine (LI) tissue were collected from 3 animals per group for RNA analysis (A), or spleen, liver, SI, and LI were harvested for cellular GrA analysis by flow cytometry (B). (C and D) The frequency of GrA+CD8+ T cells (CD3+CD4) or CD4+ T cells (CD3+CD4+) in each tissue from 5–16 syngeneic mice and 14–33 allogeneic mice. (D) Percentages of intestinal GrA+ Th cells. Left panel, representative plots of GrA and CD3 staining. Right panel, the frequency of CD4+ and CD8+ T cells within GrA+ cells from various organs. *P < 0.05 (Student’s t test) as compared with frequency of cells in spleen. (E) GrB and FOXP3 expression (unstimulated) and IL-17A and IFN-γ expression (stimulated) by intestinal Th cells from allogeneic mice. Cellular analysis is representative of 4 experiments with 3 mice per group and error bars represent standard deviation of the mean. (F) CyTOF analysis of intestinal Th cells, pooled from 10 mice, at day 10 after allogeneic transplant. t-Distributed stochastic neighbor embedding (t-SNE) dimensionality reduction plots represent expression data from GrA, IFN-γ, TNF, and IL-2 staining.
Figure 2
Figure 2. GrA+ Th cells are prevalent in the intestines and display a noncytolytic phenotype in a human PBMC-driven xenograft model of GVHD.
(A) Representative FACS plots depicting GrA expression by CD3-gated human CD4+ and CD4 (i.e., CD8+) T cells and quantitation of GrA+CD4+ and CD8+ T cells in each organ. (B) Representative FACS plots depicting human GrA, GrB, and perforin staining of gated CD3+CD4+ or CD3+CD8+ T cells. Error bars represent standard deviation of the mean. Human PBMC NRG mouse experiments represent 9 NRG mice that received PBMCs from 2 distinct donors. Statistical significance was determined by 1-way ANOVA with a Tukey’s posttest for multiple comparisons.
Figure 3
Figure 3. IL-4 and IL-6 signaling synergize in the induction of GrA+ Th cells.
(A) Naive Th cells were differentiated in the presence of the indicated cytokines (TLR2 = PAM3CSK4) and stained for intracellular GrA. Data represents a single screen with cells pooled from 3 mice. These data are representative of 3 individual screening experiments. Nil, no treatment. (B) Indicated Th cells from 3 individual mice were cultured with/without IL-6 (10 ng/mL) followed by stimulation and intracellular staining for cytokines and GrA. Representative contour plots are depicted (left panel), and the frequency of GrA+ cells is depicted in the right panel. (C) Cells from 3 mice were cultured with IL-4, anti–IFN-γ, and increasing doses of IL-6. On day 5 of culture mRNA was measured by real-time PCR. Statistical analysis was done by Student’s t test, and reported values are corrected for multiple comparisons. (D) Cells from 3 individual mice were cultured with IL-4, IL-4+IL-6, or IL-4+IL-6 and with IL-21 (100 ng/mL) added at day 3 of culture. On day 5 of culture, cells were harvested and stained for intracellular GrA and GrB (left panel), and frequencies of GrA+ and GrB+ cells were determined by flow cytometry (right panel). Statistical analysis was done by 2-way ANOVA with Holm-Šidák correction for multiple comparisons. (E) Indicated Th subsets were analyzed by CyTOF and displayed in a dot overlays plot. Cytokine screening assays were performed 4 times with pooled naive CD4+ T cells. Th polarization experiments were repeated 3–6 times. Error bars represent standard deviation of the mean. CyTOF analysis was performed twice with pooled naive CD4+ T cells isolated from multiple animals.
Figure 4
Figure 4. IL-6/21 alters the IL-4–induced transcriptional program and promotes Gzma production.
(A) Heatmap of statistically significant (FDR < 0.05; fold change > 2) gene expression of cells cultured under Th0, Th0+IL-6/21 (IL-6/21), Th0+IL-4 (IL-4), or Th0+IL-4+IL-6/21 (IL-4+IL-6/21) based on a 2-fold change cutoff. Data represent the means expression from cells isolated from 3 animals per condition. (B) Number of up- or downregulated genes as compared with Th0 cells. (C) Select genes from the subset of genes that are uniquely enriched in cells cultured with IL-4+IL-6/21. (D) Verification of Gzma expression via real-time PCR. (E) mRNA expression levels in cells isolated from C57BL/6 Stat3fl/fl Cd4-Cre (WT) and Stat3fl/fl Cd4-Cre+ mice and (F) WT and Stat6–/– mice (BALB/c) after culture with IL-4+IL-6/21. Experiments from E and F are representative of 2 individual experiments with cells isolated from 2–3 mice per experiment. Error bars represent standard deviation of the mean. Statistical significance was determined by Student’s t test.
Figure 5
Figure 5. STAT3- and STAT6-deficient Th cells differentially drive aGVHD.
Lethally irradiated BALB/c mice received C57BL/6-derived bone marrow and WT CD8+ T cells with CD4+ T cells from WT (n = 21), Stat3fl/fl CD4-Cre+ (Stat3–/–) (n = 19), or Stat6–/– mice (n = 12). Clinical scores (A) and colon length (B) of recipient mice harvested at day 9 after HCT. (C) Total viable CD4+ T cell numbers from the LI, SI, and liver. Data are pooled from 3 individual experiments where error bars represent standard deviation of the mean. n.s., not significant, P > 0.05 (1-way ANOVA with Tukey’s posttest for multiple comparisons).
Figure 6
Figure 6. STAT3 and STAT6 induce GrA+ Th cells’ differentiation and maintain lineage identity during GVHD.
T cells isolated from mice from Figure 5 were analyzed for intracellular expression of GrA. (A) Representative FACS plots of intracellular GrA and CD4 expression from CD3+ cells isolated from LI, SI, and liver. (B) Quantification of the frequency of GrA+CD4+ T cells from the LI, SI, and liver. (C) Representative FACS plots of GrA and IFN-γ from CD4+ T cells isolated from LI and stimulated with PMA and ionomycin. (D) Quantification of the frequency of GrA+CD4+ T cells expressing IFN-γ. Data are pooled from 3 individual experiments where error bars represent standard deviation of the mean. Statistical significance was determined by 1-way ANOVA with Tukey’s posttest for multiple comparisons.
Figure 7
Figure 7. Th-derived GrA contributes to immunopathology during aGVHD.
(A) BALB/c mice received syngeneic (Syn, n = 11) or C57BL/6 bone marrow with purified CD8+ and CD4+ T cells from WT or Gzma–/– C57BL/6 mice (WT CD4+/WT CD8+, n = 27; Gzma–/– CD4+/WT CD8+, n = 30; WT CD4+/Gzma–/– CD8+, n = 15). LI cells were harvested (at day 10 post-HCT) and assessed for GrA production by CD3+ cells by flow cytometry. Representative plots are gated on CD3+ cells (left panel), and the frequency of GrA+CD3+CD4+ T cells was quantified (right panel) based on the flow cytometry plots. Clinical scores and survival curves (B) from BALB/c recipient mice after HCT as per panel A. C3.SW-H2b/SnJ mice received bone marrow and T cells as per panel A. (C) Representative contour plots depict GrA+ T cells from the LI and the frequencies of GrA+CD4+ T cells in recipient mice isolated from the liver, SI, and LI. (D) Clinical scores and survival plot of C3.SW-H2b/SnJ that received WT (n = 14) or Gzma–/– CD4+ T cells (n = 14). Clinical score and survival plots represent pooled data across multiple experiments with mouse numbers indicated. Error bars represent standard deviation of the mean. *P < 0.05 by Student’s t test in B and D. Statistical significance in survival plots was performed by log-rank test (see Methods). One-way ANOVA with Tukey’s posttest was used to determine statistical significance in A and C.
Figure 8
Figure 8. Th cell–derived GrA is not required for the beneficial GVL effect of HCT.
Lethally irradiated BALB/c mice received 104 GFP+ MLL-AF9 leukemia cells, bone marrow, and T cells from syngeneic controls or allo-HCTs from C57BL/6 mice with WT T cells, Gzma–/– T cells, or Gzma–/– CD4+ T cells and WT CD8+ T cells. After transplant, mice were monitored for clinical score (A) and mortality (B). (C) At a predetermined clinical endpoint (or selected as controls if mice did not reach the clinical endpoint), mice were euthanized, and the frequency of GFP+ MLL-AF9 cells was quantified in the bone marrow by flow cytometry. The percentages of mice that succumbed to leukemia or GVHD (D) were determined based on clinical score and the frequency of GFP+ MLL-AF9 cells present in the bone marrow as per panels A and C. Error bars represent standard error of the mean in panel A from 12 mice per group and the standard deviation in panel C from the number of mice indicated. Statistical difference in survival plots was performed by log-rank test (see Methods) and for frequency of GFP+ cells by 2-way ANOVA with Holm-Šidák correction for multiple comparisons.
Figure 9
Figure 9. CD4+ T cell–derived GrA induces intestinal crypt damage.
(A) H&E staining of LI and liver tissue from BALB/c mice that received syngeneic (Syn) bone marrow and T cells or from C57BL/6 mice with WT CD8+ T cells and CD4+ T cells from WT or Gzma–/– mice at 9 days post-HCT. (B) Colon lengths from mice in panel A. Quantification of goblet cell loss (C), crypt loss (D), and liver portal inflammation (E). (F) FITC-dextran concentrations in serum after oral gavage of BALB/c recipients at day 9 after HCT. (G) Levels of LI-secreted cytokines that were significantly increased (P < 0.05) in WT recipients as compared with Syn controls after 24 hours of ex vivo culture. (H) Levels of serum cytokines that were significantly increased (P < 0.05) in WT recipients as compared with Syn controls. Error bars represent standard deviation of the mean of 4 syngeneic controls and 9 allo-HCT recipients. *P < 0.05 as compared with Syn controls. #P < 0.05 comparing WT Th and Gzma–/– Th recipient mice. n.s., not significant (all by 1-way ANOVA with Tukey’s posttest for multiple comparisons).

References

    1. Castilla-Llorente C, et al. Prognostic factors and outcomes of severe gastrointestinal GVHD after allogeneic hematopoietic cell transplantation. Bone Marrow Transplant. 2014;49(7):966–971. doi: 10.1038/bmt.2014.69. - DOI - PMC - PubMed
    1. Jamani K, et al. Prognosis of grade 3-4 acute GVHD continues to be dismal. Bone Marrow Transplant. 2013;48(10):1359–1361. doi: 10.1038/bmt.2013.59. - DOI - PubMed
    1. Carlson MJ, West ML, Coghill JM, Panoskaltsis-Mortari A, Blazar BR, Serody JS. In vitro-differentiated TH17 cells mediate lethal acute graft-versus-host disease with severe cutaneous and pulmonary pathologic manifestations. Blood. 2009;113(6):1365–1374. doi: 10.1182/blood-2008-06-162420. - DOI - PMC - PubMed
    1. Yi T, et al. Reciprocal differentiation and tissue-specific pathogenesis of Th1, Th2, and Th17 cells in graft-versus-host disease. Blood. 2009;114(14):3101–3112. doi: 10.1182/blood-2009-05-219402. - DOI - PMC - PubMed
    1. Yi T, et al. Absence of donor Th17 leads to augmented Th1 differentiation and exacerbated acute graft-versus-host disease. Blood. 2008;112(5):2101–2110. doi: 10.1182/blood-2007-12-126987. - DOI - PMC - PubMed

Publication types

MeSH terms