

Exposure assessment of adults living near unconventional oil and natural gas development and reported health symptoms in southwest Pennsylvania, USA
- PMID: 32810134
- PMCID: PMC7446921
- DOI: 10.1371/journal.pone.0237325
Exposure assessment of adults living near unconventional oil and natural gas development and reported health symptoms in southwest Pennsylvania, USA
Abstract
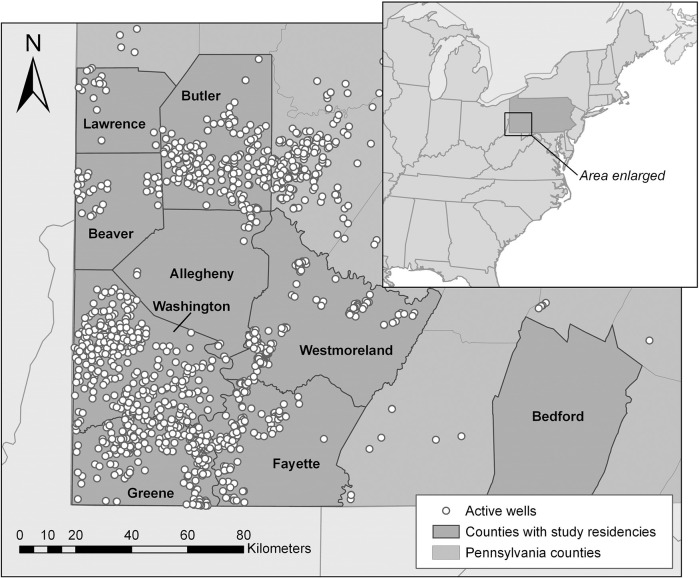
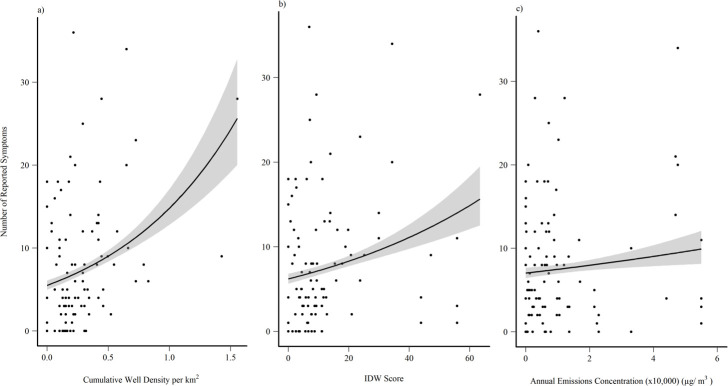
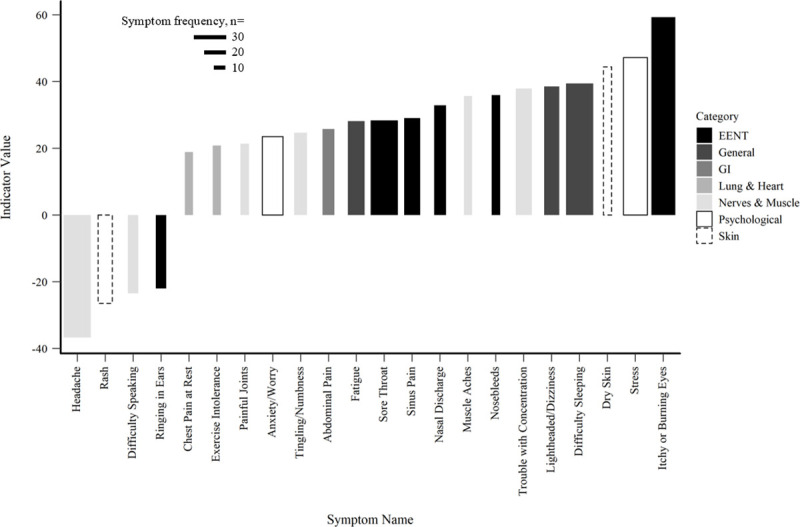
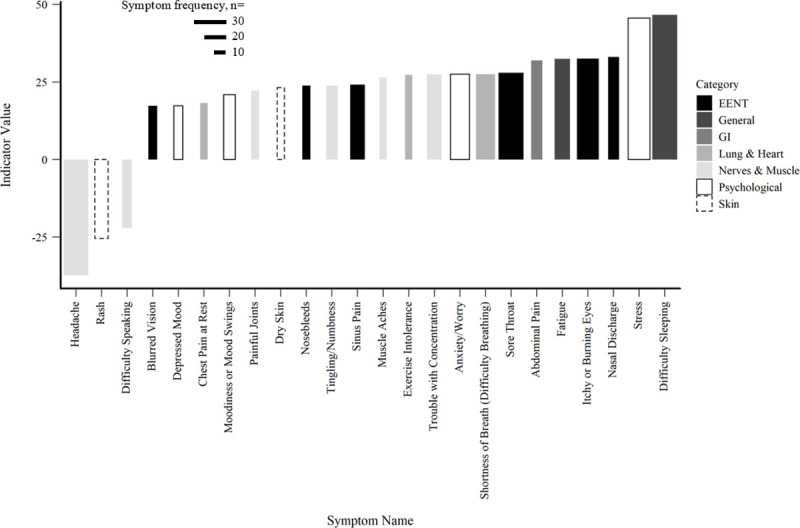
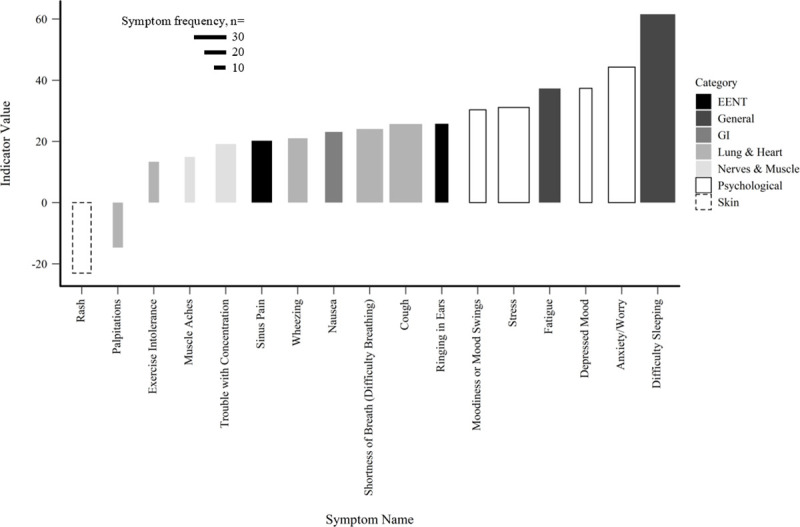
Recent research has shown relationships between health outcomes and residence proximity to unconventional oil and natural gas development (UOGD). The challenge of connecting health outcomes to environmental stressors requires ongoing research with new methodological approaches. We investigated UOGD density and well emissions and their association with symptom reporting by residents of southwest Pennsylvania. A retrospective analysis was conducted on 104 unique, de-identified health assessments completed from 2012-2017 by residents living in proximity to UOGD. A novel approach to comparing estimates of exposure was taken. Generalized linear modeling was used to ascertain the relationship between symptom counts and estimated UOGD exposure, while Threshold Indicator Taxa Analysis (TITAN) was used to identify associations between individual symptoms and estimated UOGD exposure. We used three estimates of exposure: cumulative well density (CWD), inverse distance weighting (IDW) of wells, and annual emission concentrations (AEC) from wells within 5 km of respondents' homes. Taking well emissions reported to the Pennsylvania Department of Environmental Protection, an air dispersion and screening model was used to estimate an emissions concentration at residences. When controlling for age, sex, and smoker status, each exposure estimate predicted total number of reported symptoms (CWD, p<0.001; IDW, p<0.001; AEC, p<0.05). Akaike information criterion values revealed that CWD was the better predictor of adverse health symptoms in our sample. Two groups of symptoms (i.e., eyes, ears, nose, throat; neurological and muscular) constituted 50% of reported symptoms across exposures, suggesting these groupings of symptoms may be more likely reported by respondents when UOGD intensity increases. Our results do not confirm that UOGD was the direct cause of the reported symptoms but raise concern about the growing number of wells around residential areas. Our approach presents a novel method of quantifying exposures and relating them to reported health symptoms.
Conflict of interest statement
The authors have declared that no competing interests exist.
Figures
Similar articles
-
The human health effects of unconventional oil and gas development (UOGD): A scoping review of epidemiologic studies.Can J Public Health. 2024 Jun;115(3):446-467. doi: 10.17269/s41997-024-00860-2. Epub 2024 Mar 8. Can J Public Health. 2024. PMID: 38457120 Free PMC article.
-
Human exposure to unconventional natural gas development: A public health demonstration of periodic high exposure to chemical mixtures in ambient air.J Environ Sci Health A Tox Hazard Subst Environ Eng. 2015;50(5):460-72. doi: 10.1080/10934529.2015.992663. J Environ Sci Health A Tox Hazard Subst Environ Eng. 2015. PMID: 25734822
-
Proximity to natural gas wells and reported health status: results of a household survey in Washington County, Pennsylvania.Environ Health Perspect. 2015 Jan;123(1):21-6. doi: 10.1289/ehp.1307732. Epub 2014 Sep 10. Environ Health Perspect. 2015. PMID: 25204871 Free PMC article.
-
Mortality and Morbidity Effects of Long-Term Exposure to Low-Level PM2.5, BC, NO2, and O3: An Analysis of European Cohorts in the ELAPSE Project.Res Rep Health Eff Inst. 2021 Sep;2021(208):1-127. Res Rep Health Eff Inst. 2021. PMID: 36106702 Free PMC article.
-
Critical evaluation of human health risks due to hydraulic fracturing in natural gas and petroleum production.Arch Toxicol. 2020 Apr;94(4):967-1016. doi: 10.1007/s00204-020-02758-7. Epub 2020 May 9. Arch Toxicol. 2020. PMID: 32385535 Free PMC article. Review.
Cited by
-
Impact of particulate matter and air pollution on ocular surface disease: A systematic review of preclinical and clinical evidence.Ocul Surf. 2025 Jan;35:100-116. doi: 10.1016/j.jtos.2024.12.003. Epub 2024 Dec 12. Ocul Surf. 2025. PMID: 39672270
-
The association of unconventional natural gas development with diagnosis and treatment of internalizing disorders among adolescents in Pennsylvania using electronic health records.Environ Res. 2022 Sep;212(Pt A):113167. doi: 10.1016/j.envres.2022.113167. Epub 2022 Mar 24. Environ Res. 2022. PMID: 35341757 Free PMC article.
-
Community Health Impacts From Natural Gas Pipeline Compressor Stations.Geohealth. 2023 Oct 31;7(11):e2023GH000874. doi: 10.1029/2023GH000874. eCollection 2023 Nov. Geohealth. 2023. PMID: 37915956 Free PMC article.
-
The human health effects of unconventional oil and gas development (UOGD): A scoping review of epidemiologic studies.Can J Public Health. 2024 Jun;115(3):446-467. doi: 10.17269/s41997-024-00860-2. Epub 2024 Mar 8. Can J Public Health. 2024. PMID: 38457120 Free PMC article.
-
Natural Gas Gathering and Transmission Pipelines and Social Vulnerability in the United States.Geohealth. 2021 Jun 1;5(6):e2021GH000442. doi: 10.1029/2021GH000442. eCollection 2021 Jun. Geohealth. 2021. PMID: 34189365 Free PMC article.
References
-
- Colborn T, Kwiatkowski C, Schultz K, Bachran M. Natural gas operations from a public health perspective. Human and ecological risk assessment: An International Journal. 2011. September 1;17(5):1039–56.
Publication types
MeSH terms
Substances
LinkOut - more resources
Full Text Sources
