. 2020 Aug 18;15(8):e0237789.
doi: 10.1371/journal.pone.0237789. eCollection 2020.

Effects of aquaporin-lipid molar ratio on the permeability of an aquaporin Z-phospholipid membrane system

Affiliations

Effects of aquaporin-lipid molar ratio on the permeability of an aquaporin Z-phospholipid membrane system

Hyunki Kim et al. PLoS One. .

Abstract

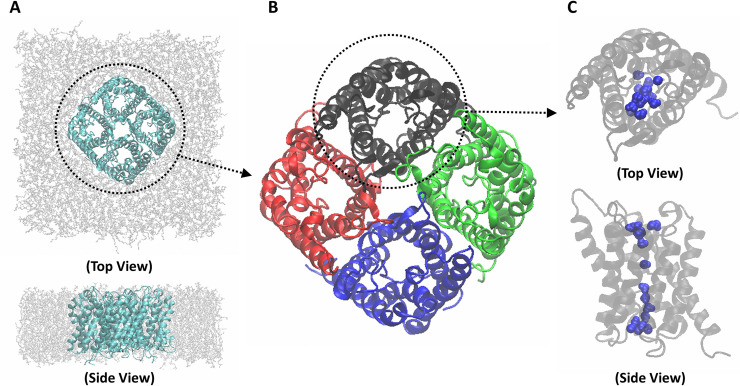
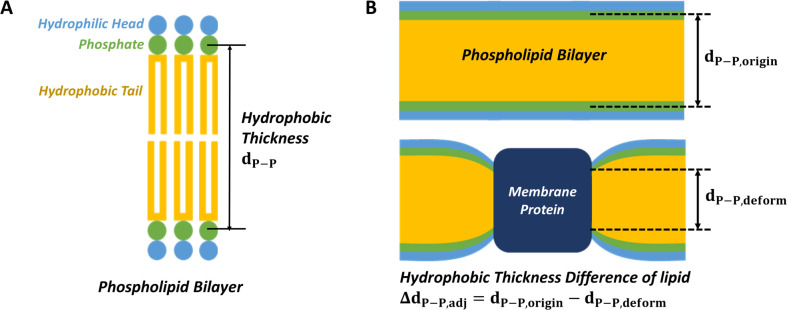
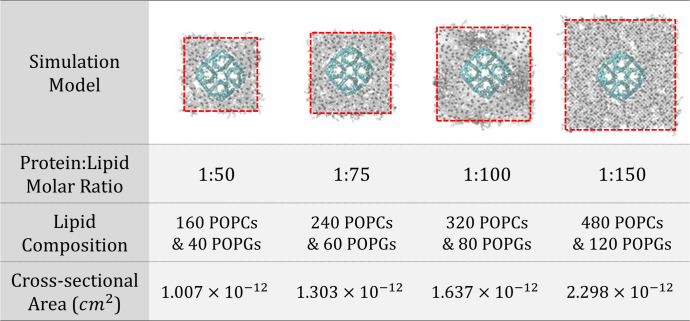
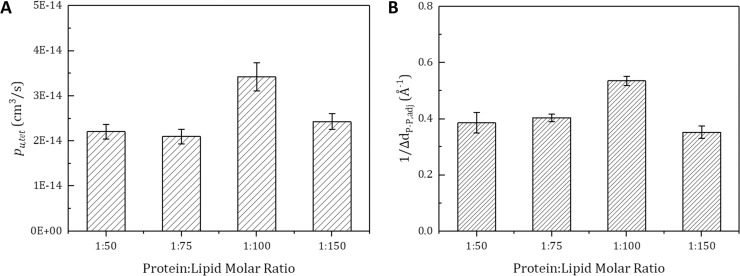
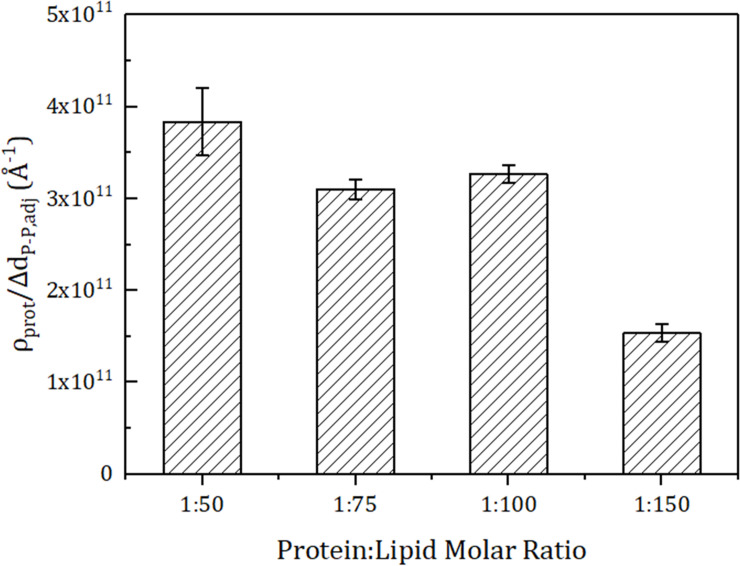
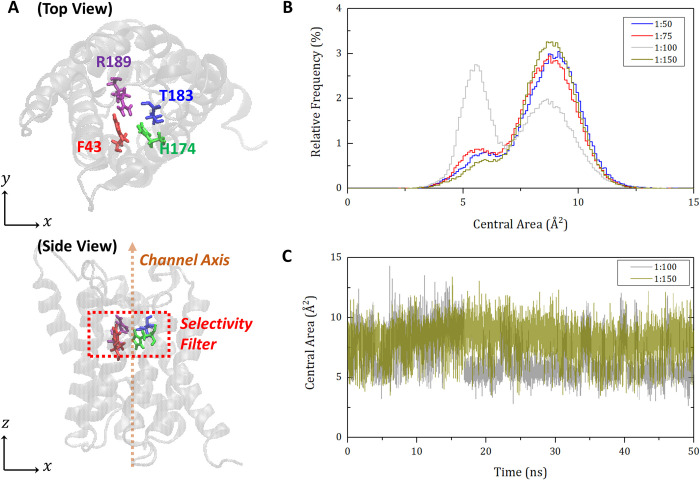
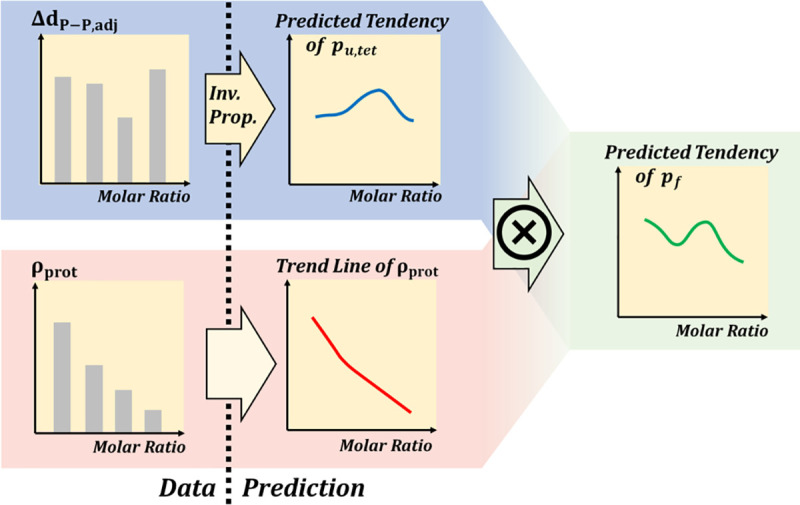
Aquaporins are water-permeable membrane-channel proteins found in biological cell membranes that selectively exclude ions and large molecules and have high water permeability, which makes them promising candidates for water desalination systems. To effectively apply the properties of aquaporins in the desalination process, many studies have been conducted on aquaporin-lipid membrane systems using phospholipids, which are the main component of cell membranes. Many parametric studies have evaluated the permeability of such systems with various aquaporin types and lipid compositions. In this study, we performed molecular dynamics simulations for four cases with different protein-lipid molar ratios (1:50, 1:75, 1:100, and 1:150) between aquaporin Z and the phospholipids, and we propose a possibility of the existence of optimal protein-lipid molar ratio to maximize water permeability. Elucidating these simulation results from a structural viewpoint suggests that there is a relationship between the permeability and changes in the hydrophobic thickness of the lipid membrane adjacent to the aquaporin as a structural parameter. The results of this study can help optimize the design of an aquaporin-lipid membrane by considering its molar ratio at an early stage of development.


Conflict of interest statement

The authors have declared that no competing interests exist.

Figures

Fig 1
Fig 1. Structural schematics of an aquaporin system.
(A) Aquaporin Z (AQPZ) unit tetramer (cyan) with phospholipid membrane (gray), in both top and side views. (B) Ribbon representation of a functional unit structure of AQPZ, the AQPZ tetramer in top view. The AQPZ tetramer consists of a combination of four identical monomers; each monomer is depicted in a different color. (C) Ribbon representation of an AQPZ monomer, in both top and side views. The AQPZ monomer consists of six long helixes and two short helixes, with a narrow space between the helixes that functions as a water channel. Water molecules in the channel are colored blue.
Fig 2
Fig 2. Schematics of a phospholipid bilayer and hydrophobic thickness difference of a phospholipid bilayer.
(A) A phospholipid consists of a hydrophilic head (light blue), phosphate (green), and hydrophobic tails (yellow). The thickness of the hydrophobic part is called the hydrophobic thickness. The hydrophobic thickness of the lipid is the same as the phosphorous atom-to-phosphorous atom distance (dP−P). (B) When a membrane protein (dark blue) is induced into a phospholipid bilayer, the hydrophobic thickness difference of the lipid, ΔdP−P,adj, is defined as the difference between the original hydrophobic thickness, dP−P,origin, and the hydrophobic thickness after deformation dP−P,deform.
Fig 3
Fig 3. Molecular dynamics simulation models.
Four models were constructed with different protein-lipid molar ratios (1:50, 1:75, 1:100, 1:150) between the proteins (cyan) and lipids (gray), and a periodic boundary condition in all directions (noted with red dashed lines). Water molecules and ions are not shown for clarity. The lipid component of the system consists of 1-palmitoyl-2-oleoyl-sn-glycero-3-phosphocholine (POPC) and 1-palmitoyl-2-oleoyl-sn-glycero-3-phosphoglycerol (POPG) in a ratio of 8:2. The cross-sectional area of the system which was proportional to the channel direction was calculated.
Fig 4
Fig 4. Schematics for calculating the osmotic permeability of aquaporin with the collective coordinate model [27].
(A) Schematics of aquaporin Z (AQPZ) and water molecules in the channel area. (B) Number of water molecules in the monomer channels. (C) Collective coordinates for each monomer channel of the AQPZ along 50 ns of the MD simulation. In (A)~(C), the four monomer channels are depicted with different colors (black, red, green, and blue). (D) Mean squared displacement (MSD) for the collective coordinates of the monomer channels of the AQPZ. Each collective coordinate of the four channels is divided into trajectories for the same time interval of 200 ps. Then the MSD is calculated by regarding 1,000 trajectories as 1D random walks performed 1,000 times. Linear regression (dashed line) is applied to derive the slope, which is equal to twice the diffusivity. The osmotic permeability is proportional to this diffusivity.
Fig 5
Fig 5. Comparison between calculated osmotic permeability of the unit tetramer (pu,tet) and predicted trend based on hydrophobic thickness difference.
(A) The pu,tet value for each protein-lipid molar ratio is calculated from a whole production simulation of four repetitive production simulations (50 ns each). (B) ΔdP−P,adj is defined as the difference between the original hydrophobic thickness and the hydrophobic thickness of the lipid membrane contiguous to the membrane protein. The ΔdP−P,adj value of each protein-lipid molar ratio is calculated by averaging four repetitive simulations (5 ns each). It was predicted that pu,tet would be inversely proportional to ΔdP−P,adj (pu,tet ∝ 1/ΔdP−P,adj) because a large amount of stress caused by a large ΔdP−P,adj value would hinder the aquaporin’s function. The error bars indicate standard errors. The Pearson correlation coefficient between pu,tet and 1/ΔdP−P,adj is 0.878, and the p-value is 0.00185 at the 5% significance level in a two-sided test.
Fig 6
Fig 6. Prediction of the tendency of osmotic permeability for an aquaporin-lipid tetramer system (pf).
The amount of aquaporin in the unit area (protein density, ρprot) is calculated with a unit area of 1 cm2 and is proportional to pf (pf = ρprotpu,tet). Therefore, pf is predicted from ΔdP−P,adj and ρprot (pf ∝ ρprot/ΔdP−P,adj). The predicted tendency of the pf is highest at the protein-lipid molar ratio of 1:50, and followed by 1:100, 1:75, and 1:150. The error bars indicate standard errors.
Fig 7
Fig 7. Schematic representation of the selectivity filter region of aquaporin and a relative frequency histogram of central area of selectivity filter.
(A) Illustration of the selectivity filter region of aquaporin Z monomer in both top and side views. Selectivity filter region of aquaporin Z is defined as the region surrounded by four residues of F43, H174, T183, and R189. (B) Relative frequency histogram of central area of selectivity filter region for four cases of protein-lipid molar ratio. In our study, the position of an atom closest to the center point of four residues of selectivity filter region was extracted for each residue, and the area formed by the four points in the plane perpendicular to the channel axis was defined as the central area. Then, the central area of aquaporin Z monomer was plotted as a relative density histogram from the simulation data of 50 ns repeated four times for four protein-lipid molar ratios. (C) Variation of the central area of selectivity filter in the time domain. Central area changes of a monomer in the case of protein-lipid molar ratio 1:100 and 1:150 are plotted over the time.
Fig 8
Fig 8. Schematic of the trend prediction of aquaporin permeability with a short production simulation of 5 ns.
Data such as ΔdP−P,adj and ρprot can be obtained by short production simulation and are required to predict pu,tet and pf, whose calculations using the collective coordinate model [27] need production simulation of more than 50 ns.

Similar articles

Cited by

References

    1. Subramani A, Badruzzaman M, Oppenheimer J, Jacangelo JG. Energy minimization strategies and renewable energy utilization for desalination: a review. Water Res. 2011;45(5):1907–1920. 10.1016/j.watres.2010.12.032 - DOI - PubMed
    1. Lutchmiah K, Verliefde ARD, Roest K, Rietveld LC, Cornelissen ER. Forward osmosis for application in wastewater treatment: a review. Water Res. 2014;58:179–197. 10.1016/j.watres.2014.03.045 - DOI - PubMed
    1. Jung JS, Preston GM, Smith BL, Guggino WB, Agre P. Molecular structure of the water channel through aquaporin CHIP. The hourglass model. J Biol Chem. 1994;269(20):14648–14654. - PubMed
    1. Tang D, Yoo YE, Kim D. Molecular dynamics simulations on water permeation through hourglass-shaped nanopores with varying pore geometry. Chem Phys. 2015;453:13–19.
    1. Agre P, Sasaki S, Chrispeels MJ, Aquaporins: a family of water channel proteins. Am J Physiol Renal Physiol. 1993;265(3):F461. - PubMed

Publication types

LinkOut - more resources