. 2020 Oct 1;27(4):574-589.e8.
doi: 10.1016/j.stem.2020.07.015. Epub 2020 Aug 17.

Intrinsic Endocardial Defects Contribute to Hypoplastic Left Heart Syndrome

Affiliations

Intrinsic Endocardial Defects Contribute to Hypoplastic Left Heart Syndrome

Yifei Miao et al. Cell Stem Cell. .

Abstract

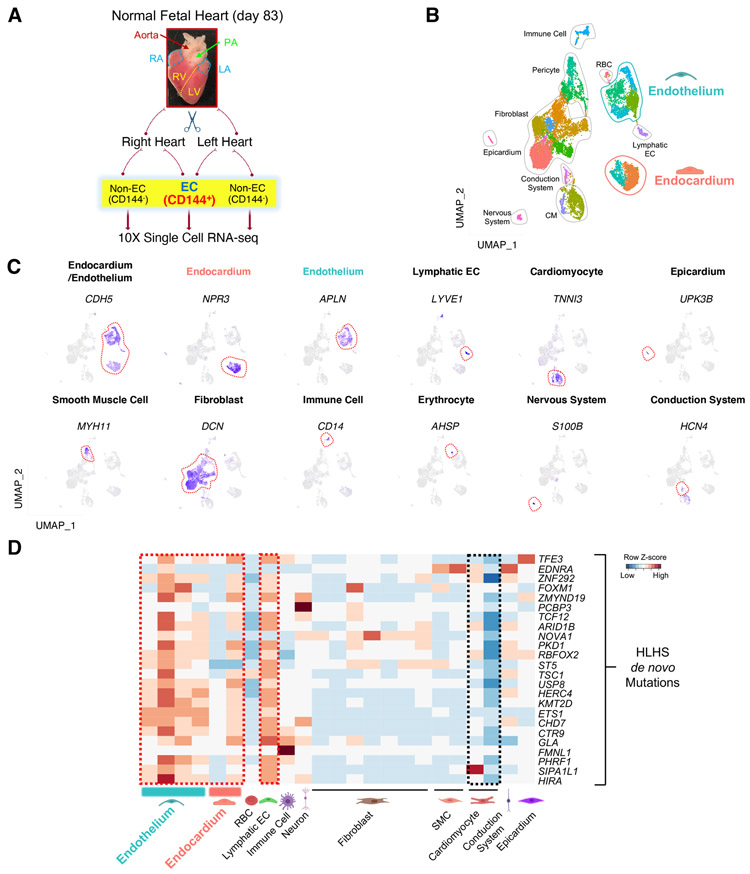
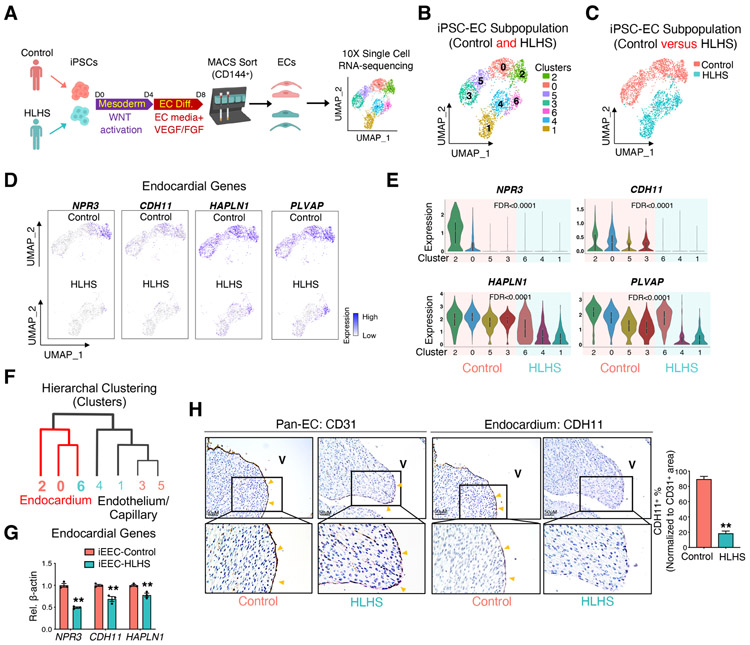
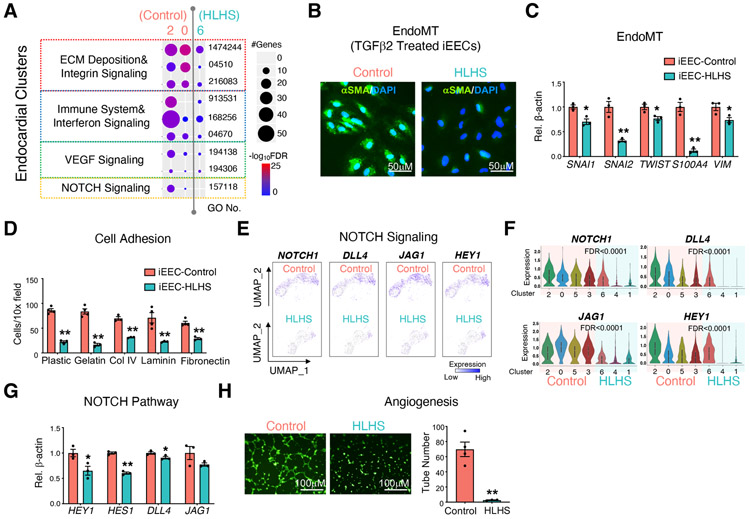
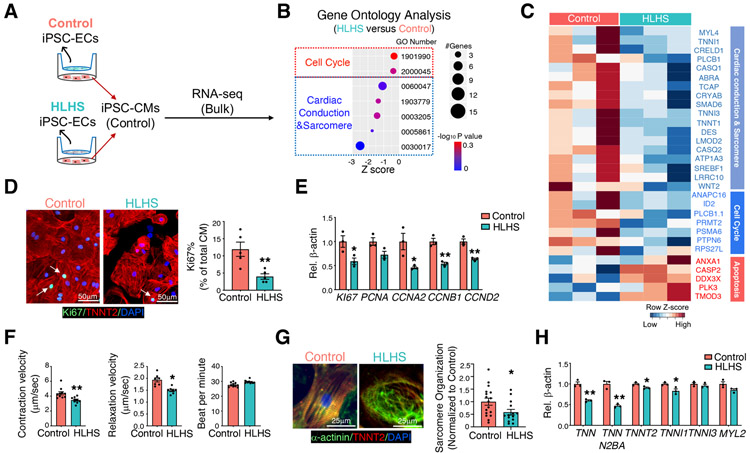
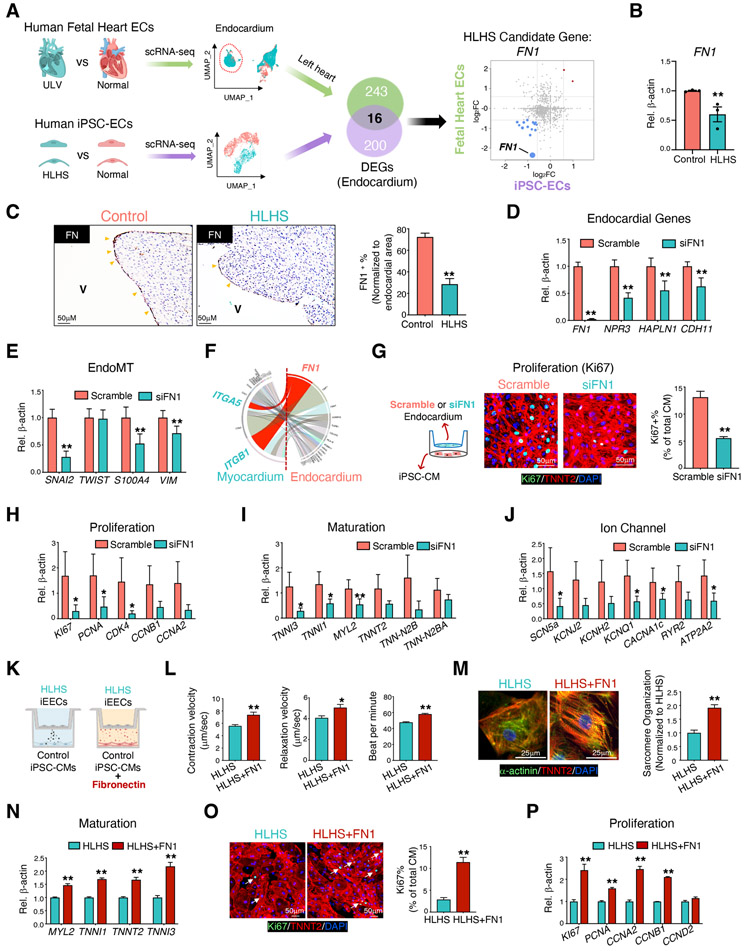
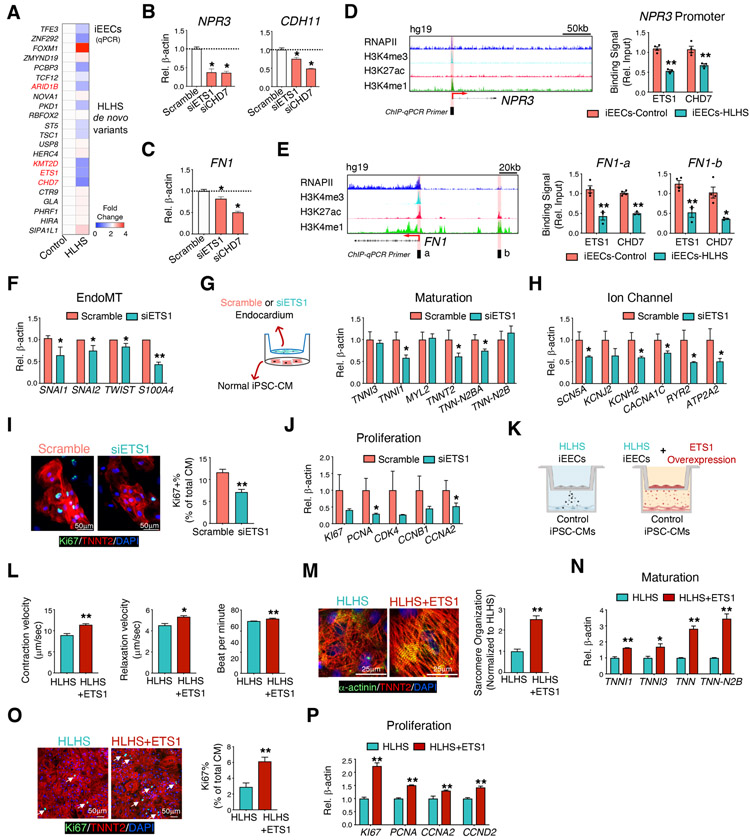
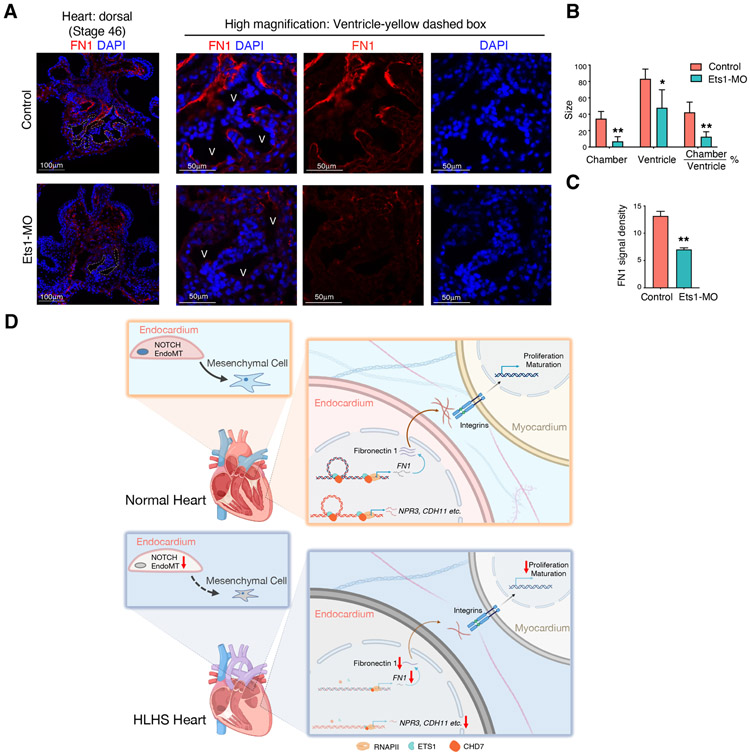
Hypoplastic left heart syndrome (HLHS) is a complex congenital heart disease characterized by abnormalities in the left ventricle, associated valves, and ascending aorta. Studies have shown intrinsic myocardial defects but do not sufficiently explain developmental defects in the endocardial-derived cardiac valve, septum, and vasculature. Here, we identify a developmentally impaired endocardial population in HLHS through single-cell RNA profiling of hiPSC-derived endocardium and human fetal heart tissue with an underdeveloped left ventricle. Intrinsic endocardial defects contribute to abnormal endothelial-to-mesenchymal transition, NOTCH signaling, and extracellular matrix organization, key factors in valve formation. Endocardial abnormalities cause reduced cardiomyocyte proliferation and maturation by disrupting fibronectin-integrin signaling, consistent with recently described de novo HLHS mutations associated with abnormal endocardial gene and fibronectin regulation. Together, these results reveal a critical role for endocardium in HLHS etiology and provide a rationale for considering endocardial function in regenerative strategies.

Keywords: ETS1; NOTCH; de novo mutation; endocardium; endothelial to mesenchymal transition; fibronectin; human heart tissue; hypoplastic left heart syndrome; induced pluripotent stem cells; single-cell RNA-seq.


Conflict of interest statement

Declaration of Interests The authors declare no competing interests.

Figures

Figure 1.
Figure 1.. HLHS de novo mutations (DNMs) were enriched in the endocardium and endothelium based on scRNA-seq analysis of human fetal heart.
(A) Schematic of the workflow for micro-dissection of normal human fetal heart and scRNA-seq. Endocardial/endothelial populations were enriched with a CD144 antibody and Magnetic-Activated Cell Sorting. PA: pulmonary artery; RA: right atrium; LA: left atrium; RV: right ventricle; LV: left ventricle. (B) UMAP projection of various cell types from day 83 normal human fetal heart. SMC: smooth muscle cell; RBC: red blood cell; CM: cardiomyocyte; EC: endothelial cell. (C) UMAP projection of represented genes for various cell types colored by represented genes’ expression level (purple indicates high expression level) in human fetal heart. (D) Cell type-specific RNA expression of HLHS DNM genes based on scRNA-seq from day 83 normal fetal heart. Row Z-score indicates RNA level. Red denotes high expression, blue minimal expression. See also Figure S1.
Figure 2.
Figure 2.. scRNA-seq of iPSC-ECs unraveled a developmentally impaired endocardial population in HLHS patients.
(A) Illustration of 10X Genomics scRNA-seq of iPSC-ECs from one healthy control and one HLHS patient. (B) UMAP projection of iPSC-ECs from both the control and HLHS patient. Each color defines one subpopulation based on the transcriptomic phenotype. (C) UMAP projection colored by cell origin. (D) UMAP plots of iPSC-ECs colored by expression levels of endocardial markers. Purple denotes high expression, white minimal expression. (E) Violin plot visualization of endocardial gene expression distribution across different subpopulations and normalized by cell number. False discover rate (FDR) indicated the significance of difference between control (cluster 2, 0, 5, and 3) vs HLHS (cluster 6, 4, and 1). (F) Hierarchal clustering analysis of EC clusters from scRNA-seq. Red lines: endocardial cluster branch. (G) Confirmation of endocardial genes expression changes between control (n=4) and HLHS (n=3) iEECs by quantitative PCR (qPCR). (H) Immunostaining of pan-EC (CD31) and endocardial (CDH11) proteins in fetal hearts from control (n=6) and HLHS (n=12) patients. In (G) and (H), data shown as the mean ± SEM. **p<0.01, control vs HLHS. See also Figure S2 and Table S1, S2, and S4.
Figure 3.
Figure 3.. iPSC-ECs and iEECs revealed functional defects in the HLHS endocardium.
(A) Functional enrichment in endocardial clusters from control (cluster 2 & 0) and HLHS (cluster 6) iPSC-EC scRNA-seq. −log10FDR indicates the significance of enrichment. GO: gene ontology. α smooth muscle actin (αSMA) staining (B) and EndoMT related gene expression (C) in iEECs from control and HLHS patients after 7 days treatment with TGFβ2 (10 ng/μl). DAPI: nucleus. (D) Adhesion assay of iEECs with different ECMs to coat the culture dish. UMAP (E) and violin plots (F) of the represented genes of the NOTCH pathway from scRNA-seq. FDR indicated the significance of difference between control (cluster 2, 0, 5, and 3) vs HLHS (cluster 6, 4, and 1). (G) Expression levels of NOTCH pathway related genes were measured by qPCR in control and HLHS patient iEECs. (H) Tube formation of control and HLHS iEECs after seeding for 6 hr. iEECs were stained with Calcein AM (green) before seeding. Pictures are under 10X magnification. In (C), (D), (G), (H), data shown as the mean ± SEM. *p<0.05, **p<0.01, control (n=4) vs HLHS (n=3).
Figure 4.
Figure 4.. HLHS iEECs impeded cardiomyocyte proliferation and maturation.
(A) Normal iPSC-CMs were co-cultured with iPSC-ECs from control or HLHS patients for 48 hr. (B) Transcriptomic profiling and functional enrichment analysis were performed on iPSC-CMs from (A) by bulk RNA-seq (n=3). −log10P indicates the significance of enrichment. Z-score defines the changing trend of enriched functions between HLHS vs control; z-score<0 means down-regulation in iPSC-CMs co-cocultured with HLHS iPSC-ECs. (C) Heatmap visualization of DEGs from GO terms in (B). (D) Immunostaining of Ki67 and TNNT2 in D15 iPSC-CMs co-cultured with control or HLHS iEECs for 48 hr. DAPI: nucleus; Green: Ki67 positive nucleus; Red: TNNT2 positive cardiomyocytes. (E) Gene expression related to proliferation in iPSC-CMs from (D). Contraction velocity (F), sarcomere organization (G), and maturation related gene expressions (H) in D30 iPSC-CMs co-cultured with control or HLHS iEECs. In (D-H), data shown as the mean ± SEM. *p<0.05, **p<0.01. See also Figure S3.
Figure 5.
Figure 5.. Endocardial homeostatic functions and endocardium-cardiomyocyte crosstalk is dependent on FN1, which is absent in HLHS.
(A) Illustration: Overlap of the DEGs from human fetal heart tissue and iPSC-ECs comparing control vs. patient. DEGs from human fetal heart tissue were determined based on the transcriptomic comparison of the endocardial subpopulation from healthy control vs. fetal heart with underdeveloped left ventricle using scRNA-seq analysis. Monte-Carlo simulation indicated the overlapping significance. (B) FN1 gene expression in iEECs from control (n=4) and HLHS patients (n=3). (C) Left panel: Immunostaining of FN1 proteins at endocardial layers in human hearts from control and HLHS patients. Yellow arrowheads indicated positive FN1 staining. V: ventricular chamber. Right panel: Quantification of FN1 positive endocardial cells in control (n=6) and HLHS (n=12) patients. Expression of genes related to the endocardium (D) and EndoMT pathways (E) in left heart endocardial cells with FN1 knock-down. (F) The interactions strength of each endocardium ligand and its cardiomyocyte receptor are displayed in the chord diagram based on day 83 normal human fetal heart scRNA-seq. A ligand-receptor relationship is marked by the color of the ligand (FN1 in red), and interaction strength is shown by the width of chords. Left half circle: Ligands expressed in endocardium; right half circle: receptors expressed in myocardium. (G) Immunofluorescence staining of Ki67 protein in normal iPSC-CMs after co-cultured with primary endocardium with or without FN1 knock-down. DAPI: nucleus; Green: Ki67 positive nucleus; Red: TNNT2 positive cardiomyocytes. Gene expression related to proliferation (H) and cardiac maturation (I) and ion channels (J) in iPSC-CMs from (G). (K) Illustration of iPSC-CM and iEEC co-culture experiments with supplementation of fibronectin (5 μg/ml, 48 hr) to the iPSC-CMs. Contraction velocity measurement (L) and sarcomere organization (M) on D30 iPSC-CMs from (K). (O) Ki67 positive iPSC-CMs on D15 iPSC-CMs from (K). DAPI: nucleus; Green: Ki67 positive nucleus; Red: TNNT2 positive cardiomyocytes. qPCR quantification of gene expressions related to myocardial maturation (N) and proliferation (P). (D-F), n=3. Data shown as the mean ± SEM. *p<0.05, **p<0.01, control vs HLHS, scramble vs siFN1, or HLHS vs HLHS + fibronectin. See also Figures S4, S5 and Table S3.
Figure 6.
Figure 6.. HLHS DNMs altered endocardial and myocardial functions through transcriptional regulation of endocardial genes and FN1.
(A) qPCR detection of HLHS DNM genes in iEECs from control (n=3) and HLHS patients (n=3). Red denotes high expression, blue minimal expression. Genes not shown mean non-detectable in iEECs. Genes highlighted by red are transcription factors or chromatin modifiers. qPCR validation of the endocardial gene expression (B) and FN1 (C) in primary human fetal endocardial cells after ETS1 or CHD7 knock-down, respectively. (D) Left: RNAPII and histone marker ChIP-seq tracks of the NPR3 gene in HUVECs from the ENCODE. The black box and red shade indicate the designated location of primers for ChIP-qPCR. The red arrow indicates the transcriptional start site (TSS) and direction of transcription. Right: ChIP-qPCR of ETS1 or CHD7 binding to the NPR3 promoter region in control and HLHS iEECs. (E) Left: Histone ChIP-seq tracks of the FN1 gene in HUVECs from the ENCODE. Right: ChIP-qPCR for ETS1 or CHD7 to the FN1 promoter (a) and enhancer (b) regions. *p<0.05, **p<0.01, control (n=4) vs HLHS (n=3). Data are represented as mean ± SEM. (F) EndoMT-related gene expression in endocardial cells after ETS1 knock-down. (G) iPSC-CMs were co-cultured with isolated fetal left heart endocardial cells with or without ETS1 knock-down. Expression of genes related to cardiomyocyte maturation (G) and ion channel (H) in iPSC-CMs were examined by qPCR. (I) Immunostaining of Ki67 (green) and TNNT2 (red) in iPSC-CMs from (G). DAPI: nucleus. (J) qPCR for proliferative genes in iPSC-CMs from (G). (K) Illustration of control iPSC-CM and iEEC co-culture experiments with ETS1 overexpression (5 multiplicity of infection-MOI, 48 hr) in HLHS iEECs (HLHS+ETS1). Contraction velocity measurement (L) and sarcomere organization (M) on day 30 iPSC-CMs from (K). (O) Ki67 positive iPSC-CMs on day 15 iPSC-CMs from (K). DAPI: nucleus; Green: Ki67 positive nucleus; Red: TNNT2 positive cardiomyocytes. qPCR quantification of gene expressions related to myocardial maturation (N) and proliferation (P). n=3 patients in each treatment group. Data shown as the mean ± SEM. *p<0.05, **p<0.01, scramble vs. siRNA knockdown or HLHS vs. HLHS+ETS1. See also Figure S6.
Figure 7.
Figure 7.. Knock-down of ETS1 in vivo caused FN1 reduction in the endocardium and led to abnormal heart development.
(A) Staining of FN1 in control and Ets1 morphant Xenopus hearts. White dashed lines outline the chamber of the Xenopus ventricle. Yellow dashed box area was further zoomed in to visualize endocardial FN1 expression. V: ventricle. (B) Quantification of the absolute sizes of the heart chamber, ventricle, and the relative chamber size. The ventricle size measured the entire area in the cross-section of heart ventricle, and the chamber size measured the area of the inner cavity inside the ventricle. (C) FN1 fluorescence signal intensity within the endocardium. control=4; Ets1-MO=6. Data shown as the mean ± SEM. *p<0.05, **p<0.01, control vs Ets1-MO. (D) Schematic illustration of the endocardial and myocardial defects in HLHS. In HLHS endocardial cells, ETS1 and CHD7 expression levels were significantly reduced compared to healthy controls. This directly led to the decreased expression and secretion of fibronectin, which further disrupted the fibronectin-integrin interaction with cardiomyocytes. Impaired integrin activation in cardiomyocytes resulted in decreased cell maturation and proliferation, which may contribute to the underdevelopment of the left ventricle. Additionally, decreased ETS1 and CHD7 also led to the suppression of downstream endocardial gene expression such as NPR3 and CDH11. The impaired endocardium showed aberrant endothelial to mesenchymal transition as well as NOTCH signaling pathway, which are critical to cardiac valve development.

References

    1. Ahmed RE, Anzai T, Chanthra N, and Uosaki H (2020). A Brief Review of Current Maturation Methods for Human Induced Pluripotent Stem Cells-Derived Cardiomyocytes. Front Cell Dev Biol 8, 178. - PMC - PubMed
    1. Ashburner M, Ball CA, Blake JA, Botstein D, Butler H, Cherry JM, Davis AP, Dolinski K, Dwight SS, Eppig JT, et al. (2000). Gene ontology: tool for the unification of biology. The Gene Ontology Consortium. Nat Genet 25, 25–29. - PMC - PubMed
    1. Bao X, Bhute VJ, Han T, Qian T, Lian X, and Palecek SP (2017). Human pluripotent stem cell-derived epicardial progenitors can differentiate to endocardial-like endothelial cells. Bioeng Transl Med 2, 191–201. - PMC - PubMed
    1. Boselli F, Freund JB, and Vermot J (2015). Blood flow mechanics in cardiovascular development. Cell Mol Life Sci 72, 2545–2559. - PMC - PubMed
    1. Botto LD, Correa A, and Erickson JD (2001). Racial and temporal variations in the prevalence of heart defects. Pediatrics 107, E32. - PubMed

Publication types