. 2020 Sep 17;182(6):1401-1418.e18.
doi: 10.1016/j.cell.2020.08.002. Epub 2020 Aug 5.

Elevated Calprotectin and Abnormal Myeloid Cell Subsets Discriminate Severe from Mild COVID-19

Affiliations

Elevated Calprotectin and Abnormal Myeloid Cell Subsets Discriminate Severe from Mild COVID-19

Aymeric Silvin et al. Cell. .

Abstract

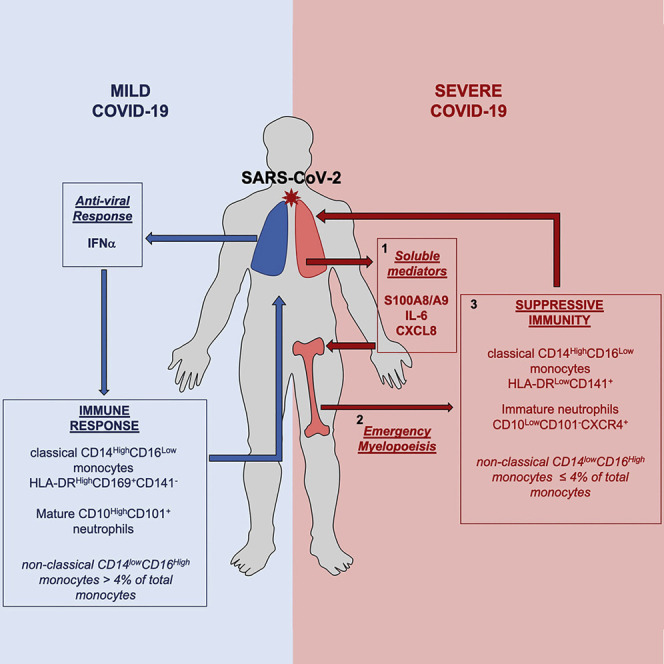
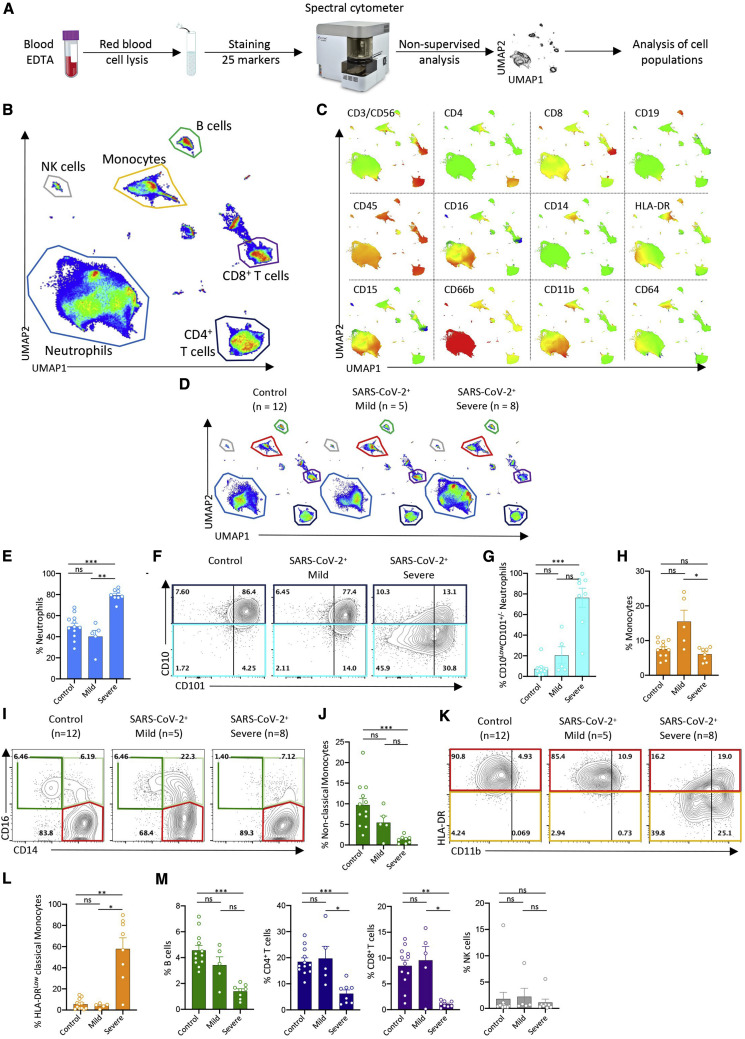
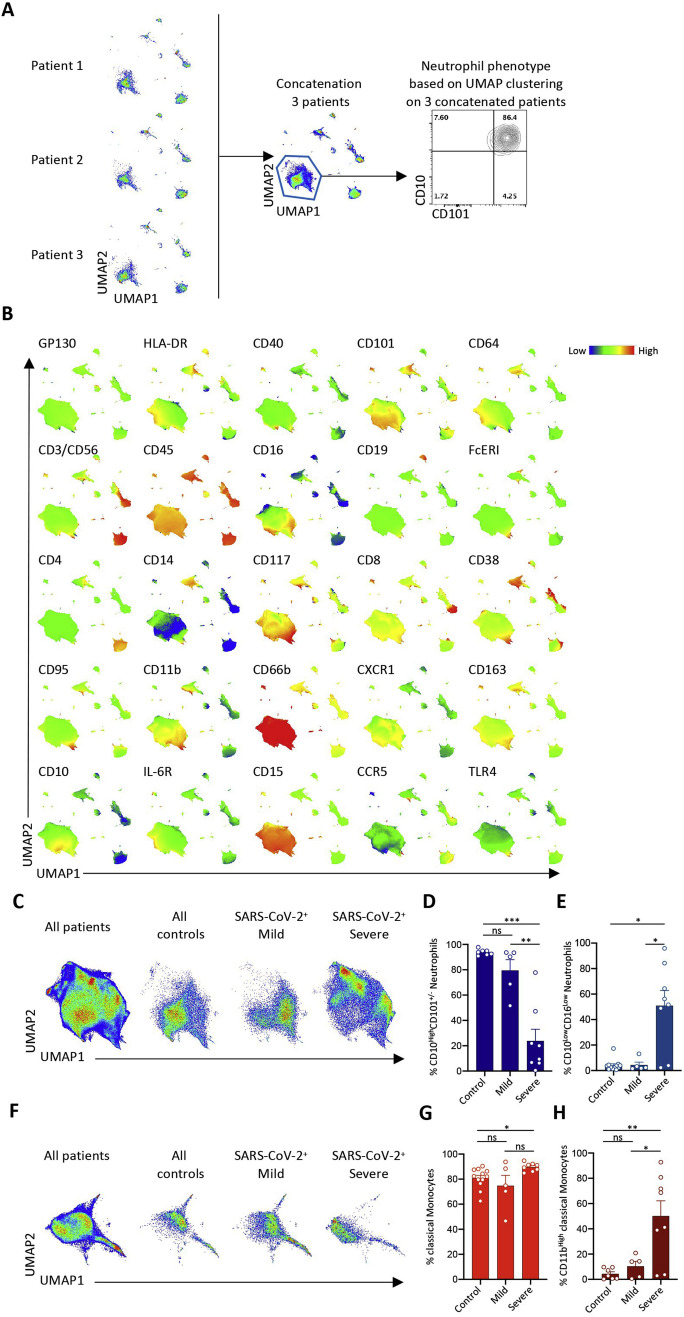
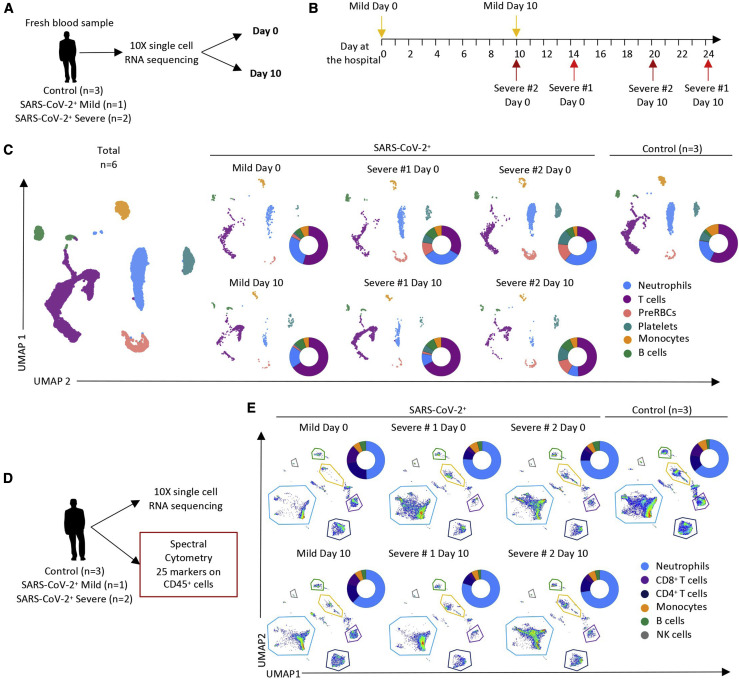
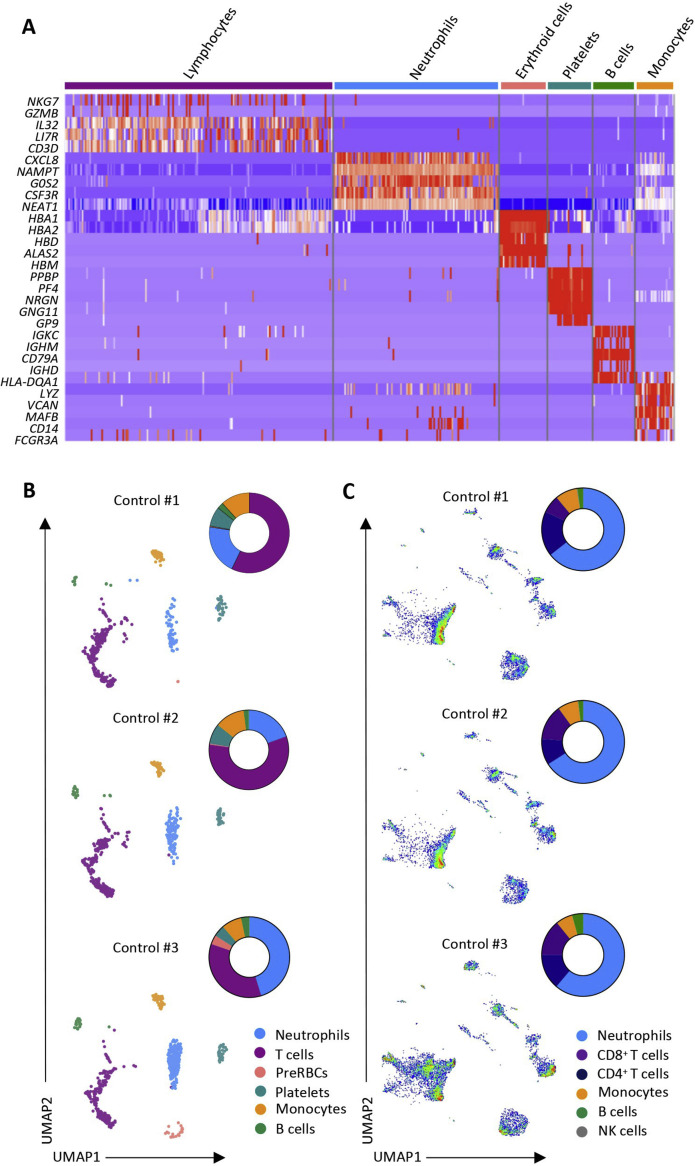
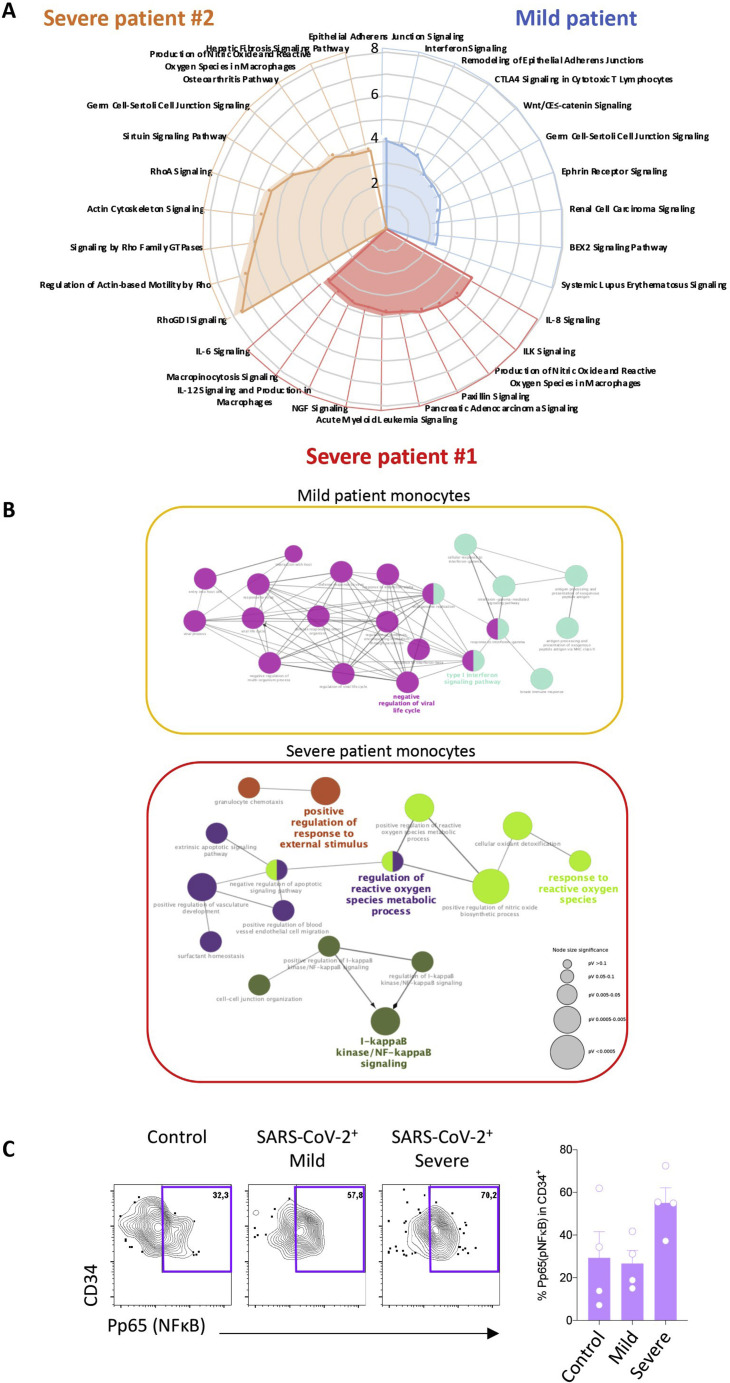
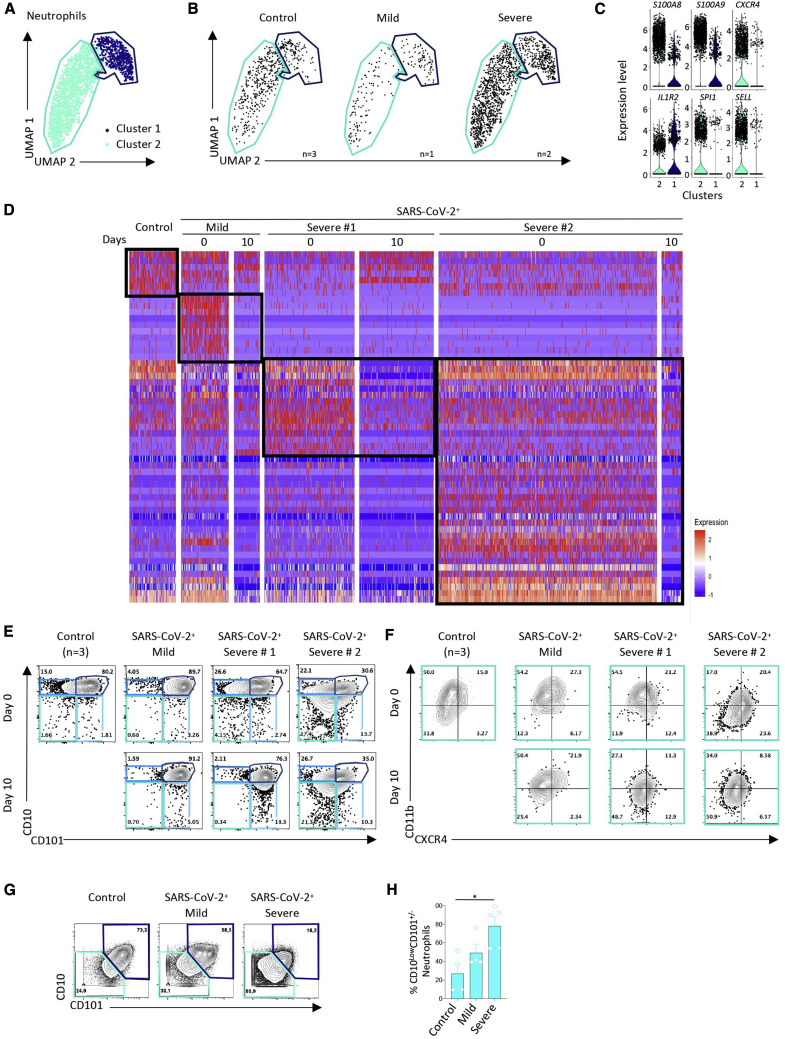
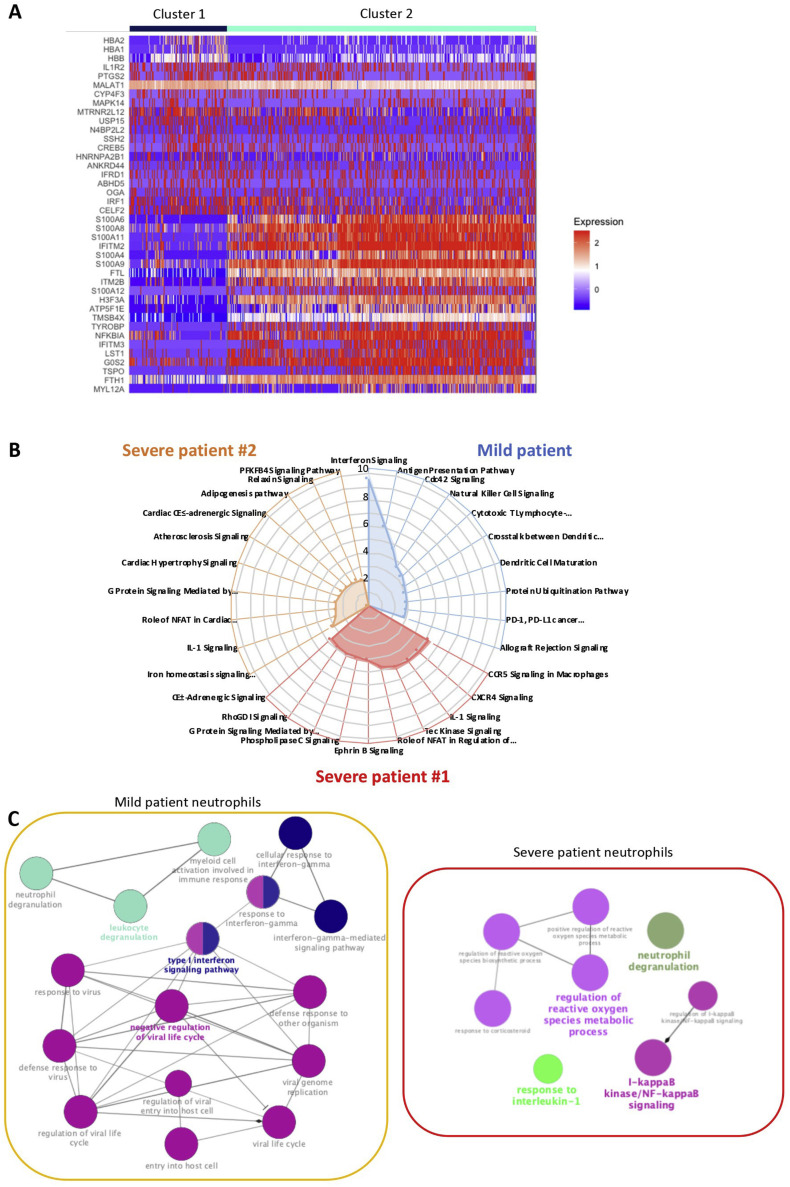
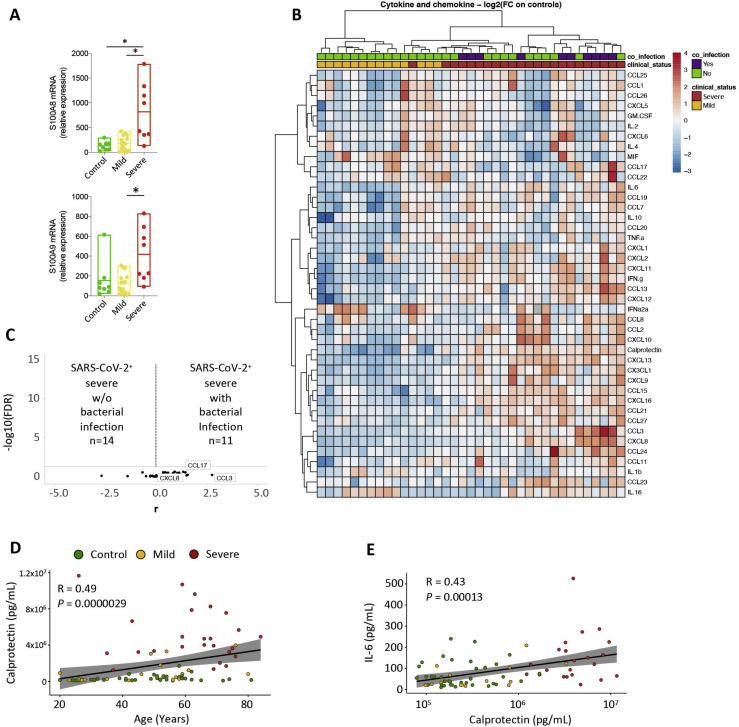
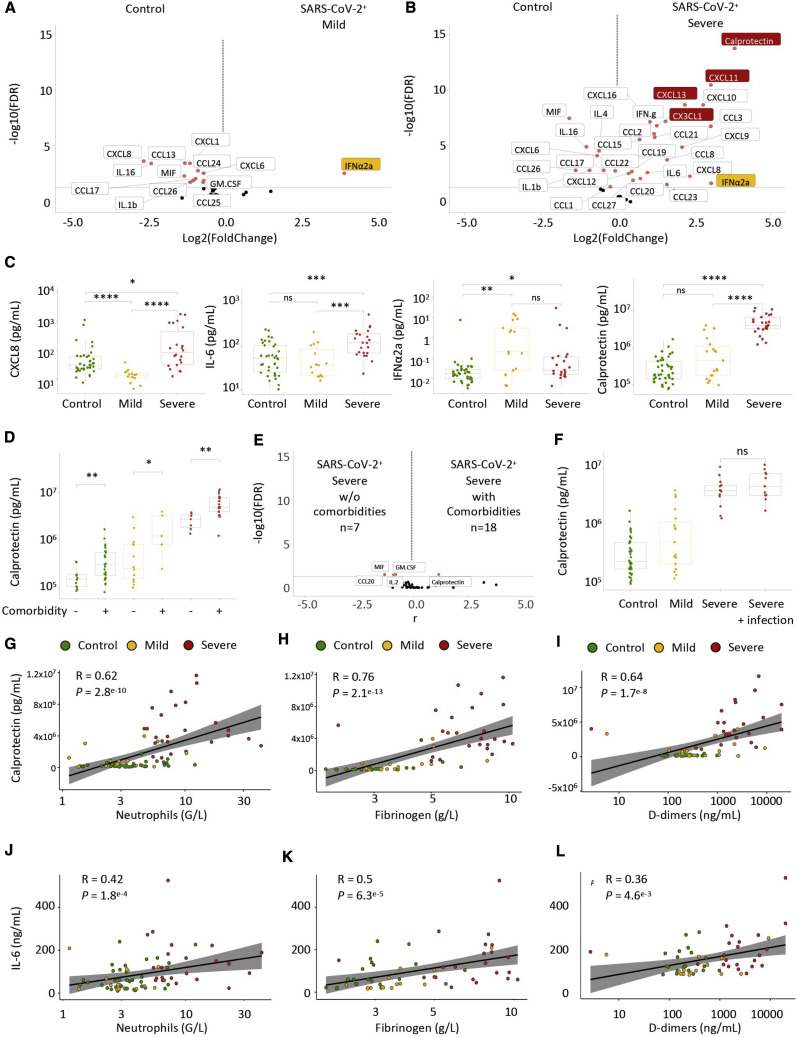
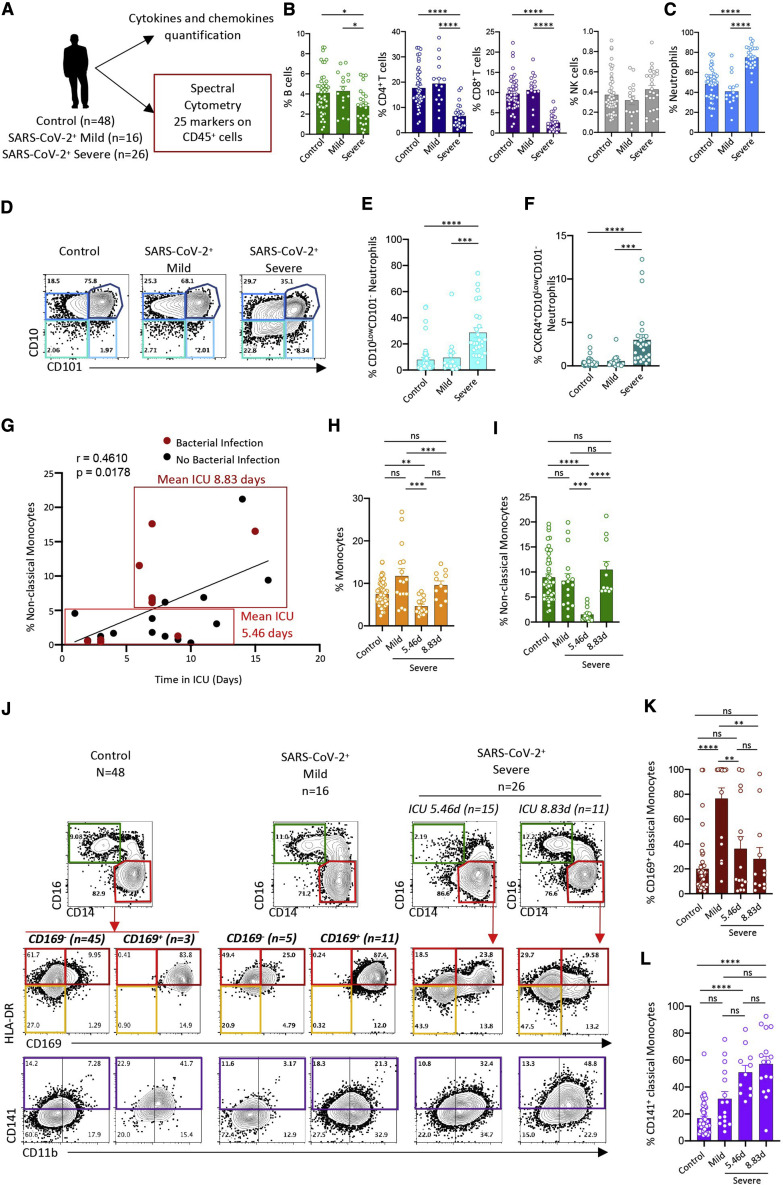
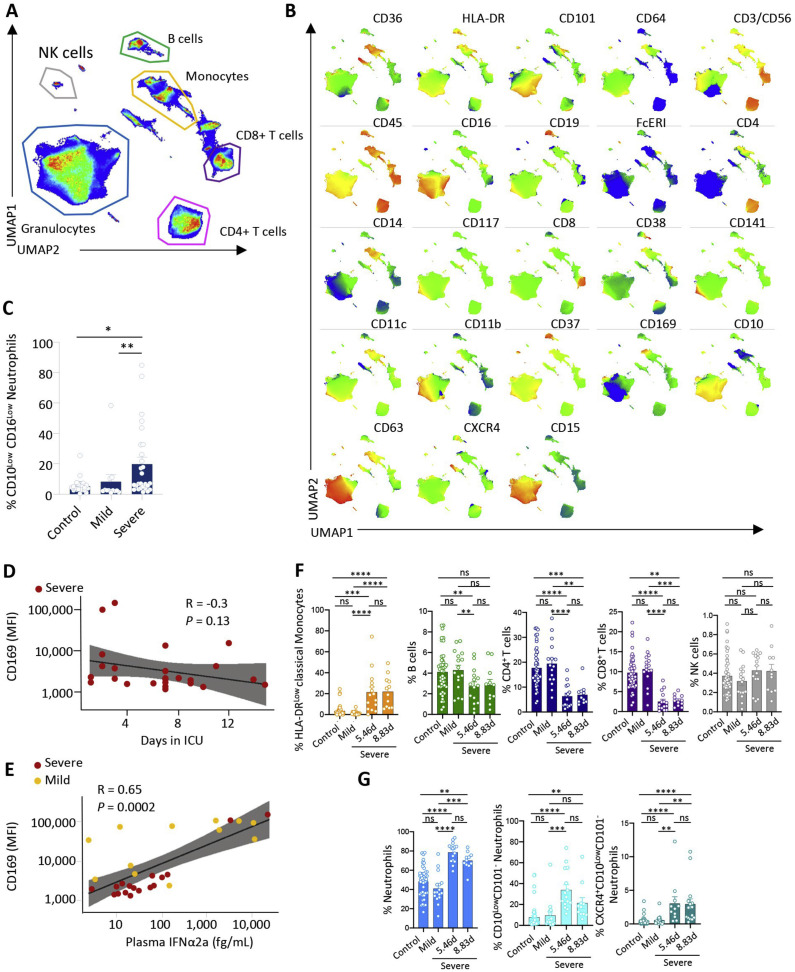
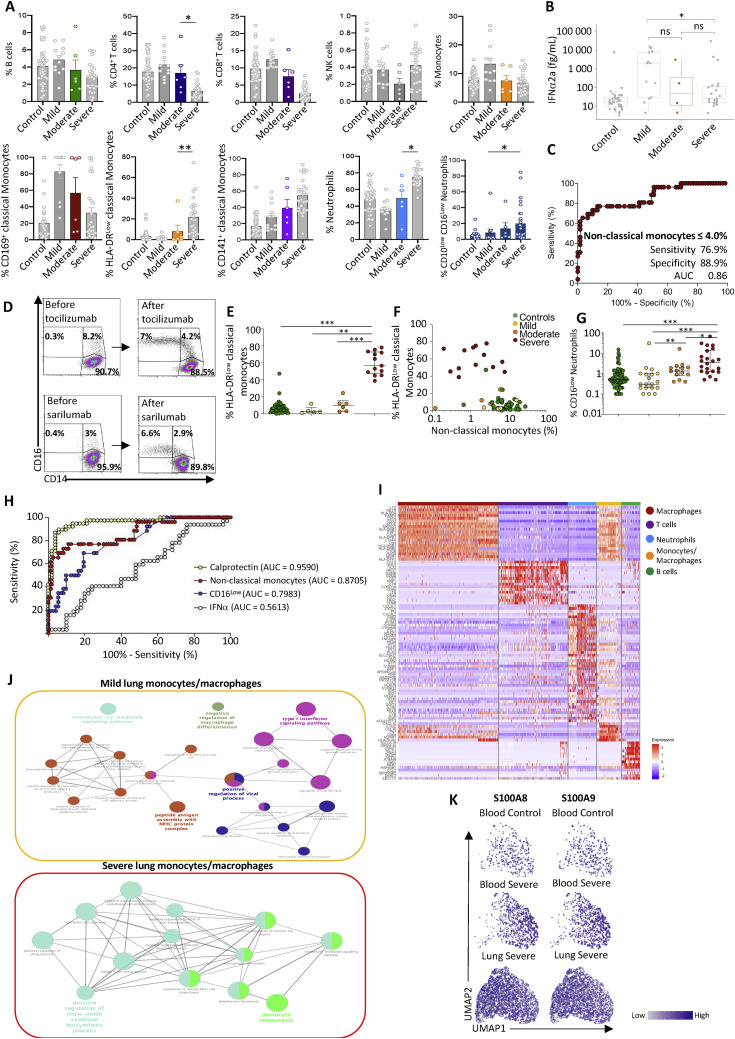
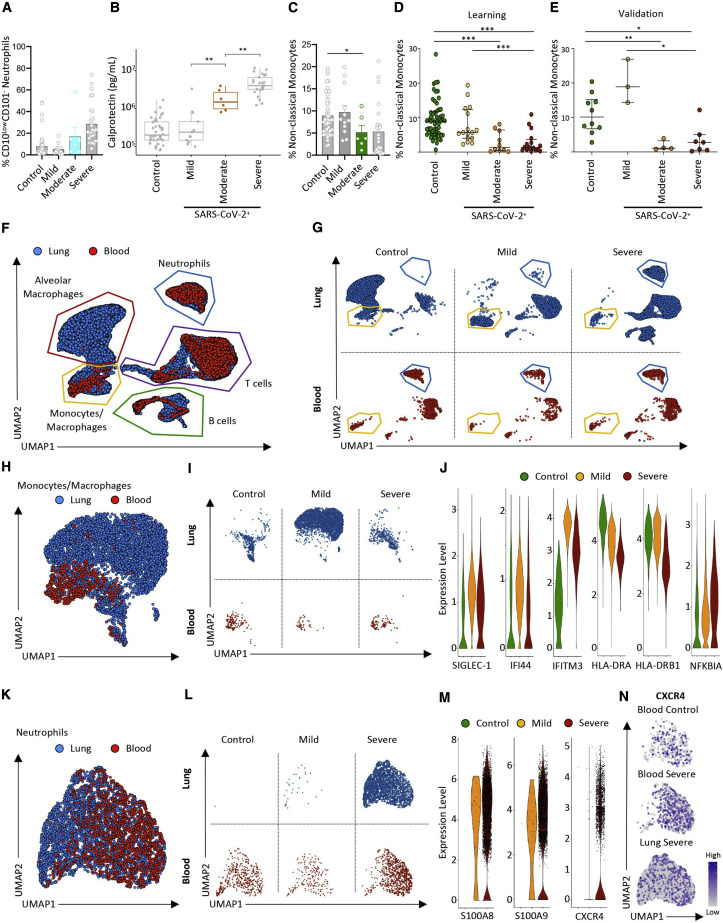
Blood myeloid cells are known to be dysregulated in coronavirus disease 2019 (COVID-19), caused by SARS-CoV-2. It is unknown whether the innate myeloid response differs with disease severity and whether markers of innate immunity discriminate high-risk patients. Thus, we performed high-dimensional flow cytometry and single-cell RNA sequencing of COVID-19 patient peripheral blood cells and detected disappearance of non-classical CD14LowCD16High monocytes, accumulation of HLA-DRLow classical monocytes (Human Leukocyte Antigen - DR isotype), and release of massive amounts of calprotectin (S100A8/S100A9) in severe cases. Immature CD10LowCD101-CXCR4+/- neutrophils with an immunosuppressive profile accumulated in the blood and lungs, suggesting emergency myelopoiesis. Finally, we show that calprotectin plasma level and a routine flow cytometry assay detecting decreased frequencies of non-classical monocytes could discriminate patients who develop a severe form of COVID-19, suggesting a predictive value that deserves prospective evaluation.

Keywords: COVID-19; S100A8; S100A9; SARS-CoV-2; calprotectin; emergency myelopoiesis; monocyte subsets; neutrophils; type I interferon.


Conflict of interest statement

Declaration of Interests A. Silvin, N.C., M.F., E. Solary, and F. Ginhoux are inventors of patent EP 20305624.7, “Methods for detecting and treating COVID patients requiring intensive care,” submitted on June 9, 2020 under Gustave Roussy.

Figures

None
Graphical abstract
Figure 1
Figure 1
Spectral Flow Analysis of Peripheral Blood Cells in a Learning Cohort of Controls and COVID-19 Patients (A) Peripheral blood sample collection pipeline. (B) Non-supervised UMAP analysis of data from 25 patients (controls, 12; mild, 5; critical, 8). (C) Cell surface marker expression in the UMAP analysis shown in (B). (D) Non-supervised UMAP analysis of patient blood samples in the control, mild, and severe groups. (E) Percentage of neutrophils among total cells in each individual sample in the indicated patient groups. (F) Partition of neutrophil subsets, based on CD101 and CD10 expression, in each patient group (data pooled per group). (G) Percentage of CD10LowCD101+/− neutrophils among total neutrophils as in (E). (H) Percentage of monocytes among total cells as in (E). (I) Partition of monocyte subsets in each individual sample in patient groups, based on CD14 and CD16 expression (left panels) or CD11b and HLA-DR expression (right panels). (J) Fractions of non-classical monocytes among total monocytes as in (E). (K) CD11b and HLA-DR expression on classical monocytes in each patient group (data pooled per group). (L) Percentage of HLA-DRlow classical monocytes among classical monocytes as in (E). (M) Percentage of B, CD4+ T, CD8+ T, and NK cells among total cells as in (E). Kruskal-Wallis test, p < 0.05, ∗∗p < 0.01, ∗∗∗p < 0.001; ns, non-significant.
Figure S1
Figure S1
Spectral Flow Analysis of Peripheral Blood Cells in a Learning Cohort of Controls and COVID-19 Patients, Related to Figure 1 and Table S2 A. Representative example of data pooling of individual UMAP profiles obtained from 3 patients of the same group. Here, neutrophil subsets are identified based on CD10 and CD101 expression across cells from patients 1, 2 and 3, allowing the analysis of cell subset repartition within the group; B. Cell surface marker expression identifying cell populations on UMAP analysis generated by data pooling from all the tested samples; C. UMAP profile from pooled data on neutrophils in all patients or indicated group of patients; D-E. Percentage of CD10High (D) or CD16Low neutrophils (E) among total neutrophils in all individuals of indicated groups; F. UMAP profile from pooled data on monocytes in all patients or indicated group of patients; G-H. Percentage of CD14+ (G) or CD11bHigh (H) monocytes among total monocytes in all individuals of indicated groups; Kruskal-Wallis test, p < 0.05; ∗∗p < 0.01; ∗∗∗p < 0.001; ns, non-significant.
Figure 2
Figure 2
scRNA-Seq of Peripheral Blood Cells in SARS-CoV-Negative and SARS-CoV-Positive Patients (A) Two blood samples were collected 10 days apart from 3 COVID-19 patients. Blood was also collected once from 3 outpatient controls whose SARS-CoV-2 RT-PCR was negative. Individual cell mRNAs were sequenced using Chromium 10X technology. (B) Timeline of sample collection in the three patients (further details in Table S4). (C) UMAP analysis of the 9 sequenced samples showing repartition of the indicated cell populations. Patient samples were analyzed individually at days 0 and 10; for control patient individual analyses, see Figure S2. (D) Spectral flow cytometry analysis of surface marker expression performed on the same samples. (E) UMAP analysis of cell populations detected by spectral flow cytometry data in each patient at day 0 and at day 10 and in controls (for individual analyses, see Figure S2).
Figure S2
Figure S2
Single-Cell Analysis of Peripheral Blood Cells, Related to Figure 2 and Tables S3 and S4 A. Heatmap of gene expression used to identify cell populations in scRNaseq experiments; B-C. Individual UMAP analysis of each control sample analyzed by scRNaseq (B) and spectral flow cytometry (C).
Figure 3
Figure 3
Single-Cell Analysis of Monocytes by scRNA-Seq, Spectral Flow Cytometry, and Mass Cytometry (A) UMAP profile of monocytes in the samples described in Figure 2A and violin plots of gene expression in three statistically defined clusters. (B) Heatmap of differentially expressed genes (DEGs; logFC ± 0.25; false discovery rate (FDR) < 0.05) in total monocytes; columns labeled “0” identify DEGs generated by comparing each patient sample at day 0 with the pool of the three controls and the two other patient samples at day 0. Columns labeled “10” identify the expression of these genes in each patient sample at day 10 compared with day 0. Genes are shown in Table S4. (C–E) Spectral flow analysis of pooled controls and each individual patient sample at day 0 and day 10 of monocyte subset partition in samples analyzed by scRNA-seq (C), CD11b and CD141 expression among classical monocytes (D), and CD169 and HLA-DR expression among classical monocytes (E). (F–I) Mass cytometry analysis of monocyte subsets in 4 patients within each group (pooled data) (F), non-classical monocyte fraction among total monocytes in each individual sample within the 3 groups (G), p65/NF-κB expression in HLA-DRlow classical monocyte subset as in (F) (H), and fraction of p65/NF-κBhighHLA-DRlow classical monocytes among classical monocytes as in (G) (I). Kruskal-Wallis test, p < 0.05.
Figure S3
Figure S3
Monocyte Analysis by scRNA-Seq, Spectral Flow Cytometry, and Mass Cytometry, Related to Figure 3 and Tables S3, S4, and S5 A. Pathway analysis generated by comparing DEGs in monocytes of each SARS-CoV-2 positive patient to the same population in the three control patients considered together using IPA software (mild patient in blue, severe #1 in red, severe # 2 in orange); B. The same DEGs were used to perform a gene ontology network analysis using clueGO software, considering the two severe patients together; C. Combined (left panel) and individual (right panel) mass cytometry analysis of p65/NF-κB expression in circulating CD34+ cells in each group. Kruskal-Wallis test, non-significant.
Figure 4
Figure 4
Single-Cell Analysis of Neutrophils by scRNA-Seq, Spectral Flow Cytometry, and Mass Cytometry (A) UMAP profile of neutrophils in the 9 samples analyzed as described in Figure 2A. (B) UMAP profile of neutrophils within the 3 controls and the mild and the two severe cases with the cluster gates overlaid. (C) Violin plots of expression of the indicated genes in two statistically defined neutrophil clusters. (D) Heatmap of DEGs in total neutrophils generated as described in Figure 3B. (E and F) Spectral flow analysis of neutrophil subsets in pooled controls and each individual patient sample at day 0 and day 10, based on CD10 and CD101 expression (E) and CXCR4 and CD11b expression among CD10LowCD101 neutrophils (F) in the indicated samples (pooled controls). (G and H) Mass cytometry analysis of neutrophil subsets in 4 patients within each group (pooled data) as in Figures 3F–3I, based on CD10 and CD101 expression (G) and the fraction of CD10LowCD101 neutrophils among total neutrophils in each sample within the 3 groups (H). Kruskal-Wallis test, p < 0.05.
Figure S4
Figure S4
Neutrophil Analysis by scRNA-Seq, Spectral Flow Cytometry, and Mass Cytometry, Related to Figure 4 and Tables S3, S4, and S5 A. Heatmap of the top 20 DEGs defining two neutrophil clusters. B. Pathway analysis generated by comparing DEGs in neutrophils of each SARS-CoV-2 patient to the same population in the three control patients considered together using IPA software (mild patient in blue, severe #1 in red, severe # 2 in orange); C. The same DEGs identified in neutrophils were used to perform a gene ontology network analysis using clueGO software, considering the two severe patients together.
Figure S5
Figure S5
Calprotectin Is the Most Abundant Immune Mediator/Immune Protein Detected in the Plasma of Patients with Severe COVID-19, Related to Figure 5 and Tables S5 and S6 A. RT-qPCR analysis of S100A8 and S100A9 gene expression in the three groups of patients, using HPRT as a control gene; B. Heatmap of cytokines, chemokines, IFNα2a and calprotectin plasma levels in 37 COVID-19 patients compared to 40 controls. SARS-CoV-2-positive patients included 14 mild and 23 severe patients. Associated bacterial infection at sample collection is indicated in purple. The heatmap shows z score-normalized concentrations, each column represents one patient and each row one protein; the color gradient from blue to red indicates increasing concentrations. Rows and columns are clustered using correlation distance and average linkage; C. Volcano-plot representation of cytokine levels in severe SARS-CoV-2 patients with (n = 11) or without (n = 14) bacterial infection at the time of sample collection; D. Spearman correlation between calprotectin concentration and age showing control patients in green, mild in orange and severe in red; E. Spearman correlation between IL-6 and calprotectin concentrations (color code as in D).
Figure 5
Figure 5
Calprotectin Is the Most Abundant Immune Mediator Detected in the Plasma of Patients with Severe COVID-19 Shown are plasma levels of calprotectin (S100A8/S100A9), interferon alpha (IFNα2a), and 40 cytokines and chemokines in blood samples collected from 84 patients (controls, 40; mild disease, 18; moderate or severe disease, 25). (A) Volcano plot of cytokine levels in patients with mild COVID-19 compared with controls; IFNα2a is shown in orange. (B) Volcano plot of cytokine levels in patients with severe COVID-19 compared with control patients; IFNα2a is shown in orange. Calprotectin, CXCL11, CXCL13, and CX3CL1, shown in red, are most significantly associated with the severe forms. (C) Circulating levels of CXCL8, IFNα2a, calprotectin, and IL-6 in individual samples in each group. (D) Effect of comorbidities (Table S6) on calprotectin plasma levels in each group. (E) Volcano plot of cytokine levels in patients with severe disease with and without comorbidities. (F) Effect of bacterial infection on calprotectin plasma levels in each group. (G–I) Spearman correlations between calprotectin plasma levels and neutrophil count (G), fibrinogen (H), and D dimers (I). (J–L) Spearman correlations between IL-6 plasma levels and neutrophil count (J), fibrinogen (K), and D dimers (L). Wilcoxon rank-sum test, p < 0.05, ∗∗p < 0.01, ∗∗∗p < 0.001, ∗∗∗∗p < 0.0001.
Figure 6
Figure 6
Validation of the Severe COVID-19 Innate Immune Signature (A) Spectral flow pipeline. (B) Fraction of B cells, CD4+ T cells, CD8+ T cells, and NK cells among total cells in individual samples (circles) in each group. (C) Fraction of neutrophils in individual samples in each group. (D) Neutrophil subsets identified by CD101 and CD10 expression in each group (pooled data). (E) Fraction of CD10LowCD101 neutrophils among total neutrophils in individual samples within each group. (F) Fraction of CXCR4+ neutrophils among CD10LowCD101 neutrophils as in (E). (G) Spearman correlation of time spent in the ICU and non-classical monocyte fraction among total monocytes. Patients with a bacterial infection are shown as red dots. Mean time spent in the ICU was 5.46 days for patients with a low (≤5%) and 8.83 days in those with a high (>5%) CD14lowCD16High monocyte fraction. (H) Fraction of classical monocytes among white blood cells in each individual sample in each group. (I) Fraction of non-classical monocytes among total monocytes as in (H). (J) Monocyte subset partition in each group (pooled data), with the severe group split in two groups based on mean time spent in the ICU. Top panels: monocyte subsets identified by CD14 and CD16 expression. Bottom panels: HLA-DR and CD169 or CD11b and CD141 expression in the classical monocyte subset. (K) Fraction of monocytes expressing CD169 among classical monocytes as in (H). (L) Fraction of monocytes expressing CD141 among classical monocytes as in (H). Kruskal-Wallis test, p < 0.05, ∗∗p < 0.01, ∗∗∗p < 0.001.
Figure S6
Figure S6
Validation of the Innate Immune Signature of Severe COVID-19, Related to Figure 6 and Table S6 A-B Non-supervised UMAP representation generated by pooling data from all the patient samples; cell identification (A) surface marker expression (B); C. Bar plots representing the percentage of CD10LowCD16Low neutrophils among all neutrophils in individual patients from each group in the validation cohort (n = 90). D. Spearman correlation between CD169 (SIGLEC-1) mean fluorescence intensity (MFI) and days spent by severe patients in ICU. E. Spearman correlation between CD169 (SIGLEC-1) mean fluorescence intensity (MFI) and plasma IFNα concentration; yellow, mild COVID-19 patients; red, severe COVID-19 patients. F.G. Bar plots representing the percentage of HLA-DRLow classical monocytes, B cells, CD4+ and CD8+ T cells and NK cells (F) and neutrophils among CD45+ cells, CD10LowCD101- neutrophils among all neutrophils and CD10LowCXCR4+ neutrophils among CD10LowCD101- neutrophils (G) in individual patients from each group in the validation cohort (n = 90). Kruskal-Wallis test, p < 0.05, ∗∗p < 0.01, ∗∗∗p < 0.001; ns, non-significant.
Figure S7
Figure S7
Changes in Innate Immune Cell Phenotype Are Detected in Patients with Moderate COVID-19, Related to Figure 7 and Tables S6 and S7 A. Bar plots representing the percentage of B cells, CD4+ T cells, CD8+ T cells, NK cells, total monocytes, CD169+, HLA-DRLow and CD141+ classical monocyte subsets, total neutrophils among CD45+ cells, and CD10LowCD101- and CD10LowCD16Low neutrophil subset among all neutrophils in individual patients from each group, with the moderate category (6 patients) highlighted. B. Plasma concentration of IFNα in moderate COVID-19 patients compared to the three other groups. C. ROC analysis showing performance of a diagnostic test using percentage of non-classical monocytes among total monocytes to distinguish controls and mild COVID patients from moderate and severe COVID patients; D. Monocyte subset analysis in the peripheral blood of 2 severe patients, before (left panels) and after (right panels) treatment with the indicated anti-IL-6 antibodies; E. Percentage of HLA-DRlow classical monocytes among classical monocytes in a cohort of 22 patients and 17 controls grouped into 4 clinical categories; F. Correlation between the percentage of HLA-DRlow classical monocytes and non-classical monocytes; G. Percentage of CD16low neutrophils among neutrophils in control and COVID-19 patients of the learning cohort described in Figure 7. H. ROC curves evaluating the discriminating significance of calprotectin plasma level (yellow), nonclassical monocyte fraction (red), CD16low circulating neutrophils (blue) and IFNα2a plasma level (white) between controls/mild patients and moderate/severe patients. AUC, Area Under the Curve; Mann Whitney test; I. Heatmap of blood and bronchoalveolar lavage fluid scRNaseq cells integrated defining the 5 regions of cell populations; J. Pathway analysis (Cytoscape and ClueGo) of DEGs expressed at a higher level in bronchoalveolar monocytes/macrophages from mild versus severe patients. K. UMAP analysis of neutrophils with S100A8 (left panel) and S100A9 (right panel) gene expression level projection (low expression = gray dots; high expression = dark blue dots). Kruskal-Wallis test, p < 0.05; ∗∗p < 0.01; ∗∗∗p < 0.001.
Figure 7
Figure 7
Low-Dimensional Flow Analysis of Non-classical Monocyte Subsets in COVID-19 (A) Fraction of CD10LcowCD101 neutrophils among total neutrophils in individual samples within each group, separating moderate and severe COVID-19. (B) Calprotectin plasma levels in patients with moderate disease (orange dots) compared with patients of the three other groups. (C) Fraction of non-classical monocytes among total monocytes in patients with moderate disease (green bar plot) compared with patients of the three other three groups. (D and E) Fraction of non-classical monocytes among total monocytes in a learning cohort of 98 patients (controls, n = 56; mild, n = 16; moderate, n = 10; severe, n = 16) (D) and a validation cohort of 24 patients (controls, n = 10; mild n = 3; moderate, n = 4; severe, n = 7) (E). Mann-Whitney test, p < 0.05, ∗∗p < 0.01, ∗∗∗p < 0.001. (F–M) Integration of scRNA-seq data from blood and lung (BALF) cells of COVID-19 patients. Blood samples are described in Tables S3 and S4. Lung data are from Liao et al. (2020) (controls, n = 3; mild, n = 3; severe, n = 6). (F) UMAP analysis of integrated scRNA-seq from blood and lung samples. (G) UMAP analysis of blood and lung samples in each patient category. (H) UMAP analysis of integrated scRNA-seq data of monocytes/macrophages from blood and lungs. (I) UMAP analysis of blood and lung monocytes/macrophages in each patient group. (J) Violin plot of gene expression in lung monocytes/macrophages of control patients and patients with mild and severe disease. (K) UMAP analysis of integrated scRNA-seq data of neutrophils from blood and lung samples. (L) UMAP analysis of blood and lung neutrophils in each patient group. (M) Violin plot of gene expression in lung neutrophils of control patients and patients with mild and severe COVID-19. (N) UMAP analysis of neutrophils with CXCR4 gene expression level projection (low expression, gray dots; high expression, dark blue dots).

References

    1. Aarts C.E.M., Hiemstra I.H., Béguin E.P., Hoogendijk A.J., Bouchmal S., van Houdt M., Tool A.T.J., Mul E., Jansen M.H., Janssen H. Activated neutrophils exert myeloid-derived suppressor cell activity damaging T cells beyond repair. Blood Adv. 2019;3:3562–3574. - PMC - PubMed
    1. Al-Qahtani A.A., Lyroni K., Aznaourova M., Tseliou M., Al-Anazi M.R., Al-Ahdal M.N., Alkahtani S., Sourvinos G., Tsatsanis C. Middle east respiratory syndrome corona virus spike glycoprotein suppresses macrophage responses via DPP4-mediated induction of IRAK-M and PPARγ. Oncotarget. 2017;8:9053–9066. - PMC - PubMed
    1. Austermann J., Friesenhagen J., Fassl S.K., Petersen B., Ortkras T., Burgmann J., Barczyk-Kahlert K., Faist E., Zedler S., Pirr S. Alarmins MRP8 and MRP14 induce stress tolerance in phagocytes under sterile inflammatory conditions. Cell Rep. 2014;9:2112–2123. - PubMed
    1. Basiorka A.A., McGraw K.L., Eksioglu E.A., Chen X., Johnson J., Zhang L., Zhang Q., Irvine B.A., Cluzeau T., Sallman D.A. The NLRP3 inflammasome functions as a driver of the myelodysplastic syndrome phenotype. Blood. 2016;128:2960–2975. - PMC - PubMed
    1. Becht E., McInnes L., Healy J., Dutertre C.A., Kwok I.W.H., Ng L.G., Ginhoux F., Newell E.W. Dimensionality reduction for visualizing single-cell data using UMAP. Nat. Biotechnol. 2018;37:38–44. - PubMed

Substances