

A pathoconnectome of early neurodegeneration: Network changes in retinal degeneration
- PMID: 32810483
- PMCID: PMC7554222
- DOI: 10.1016/j.exer.2020.108196
A pathoconnectome of early neurodegeneration: Network changes in retinal degeneration
Abstract
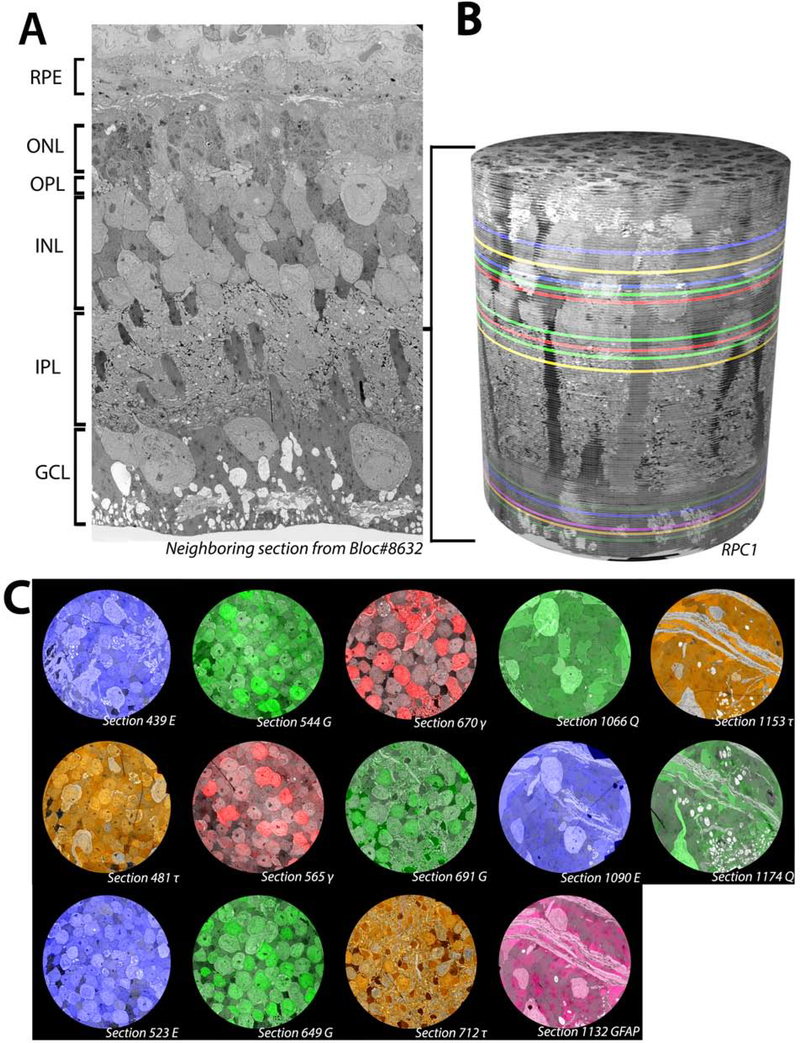
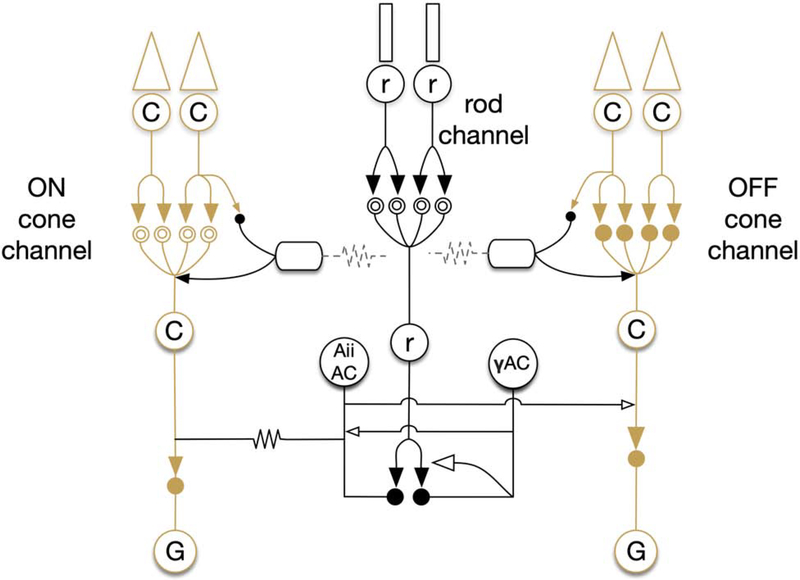
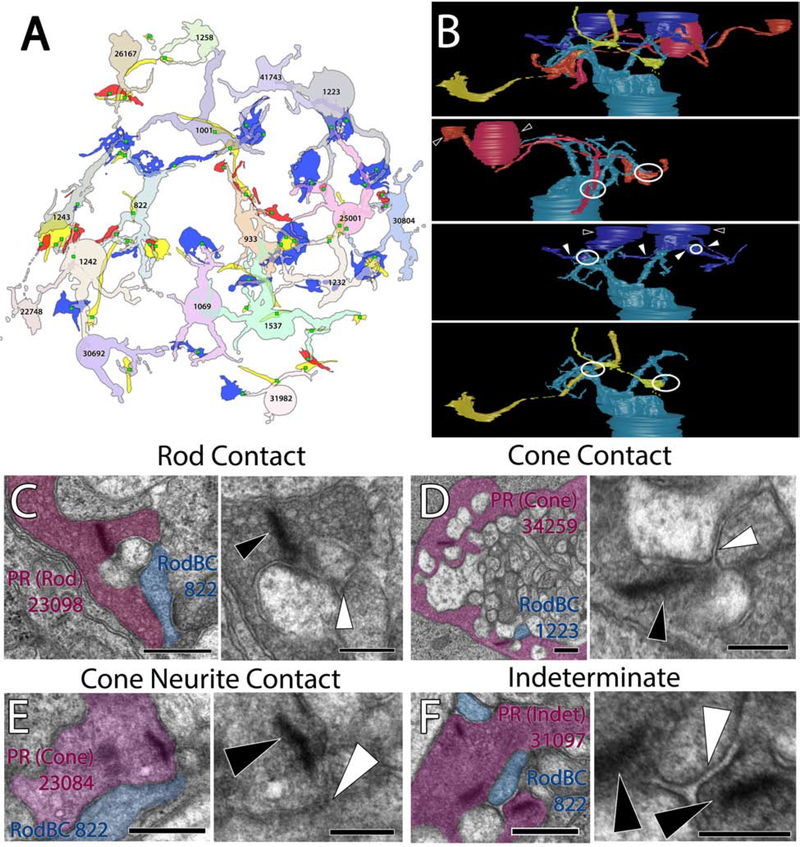
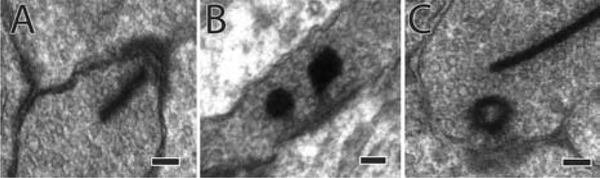
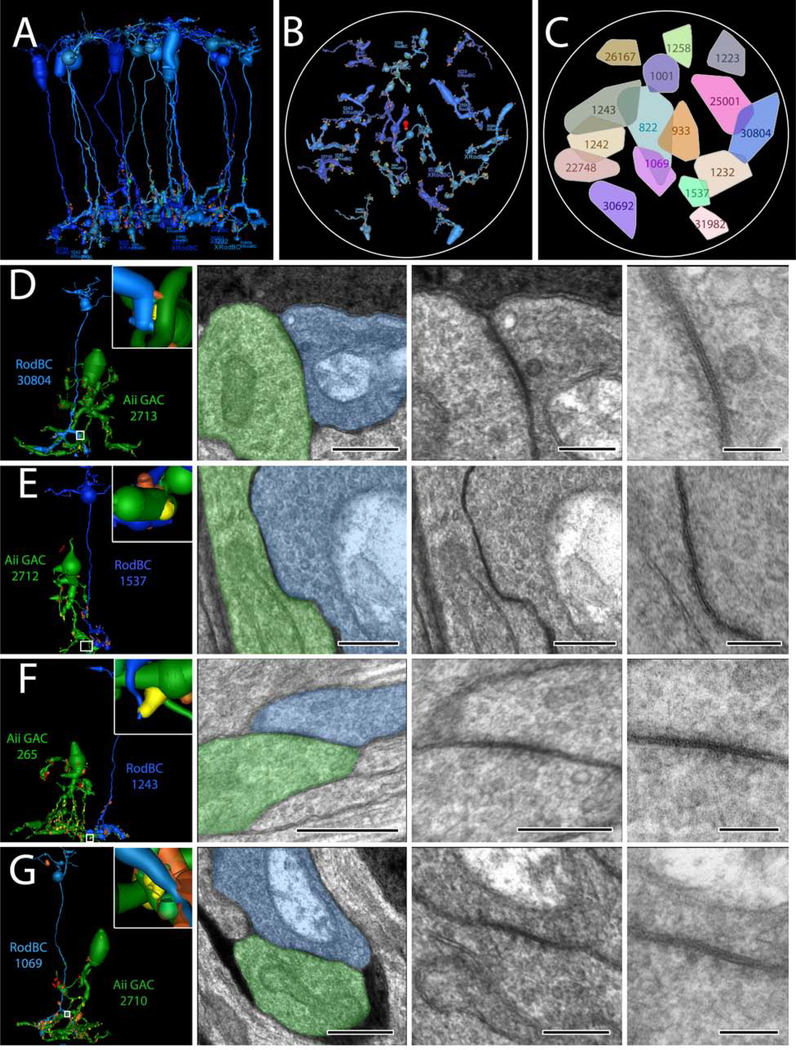
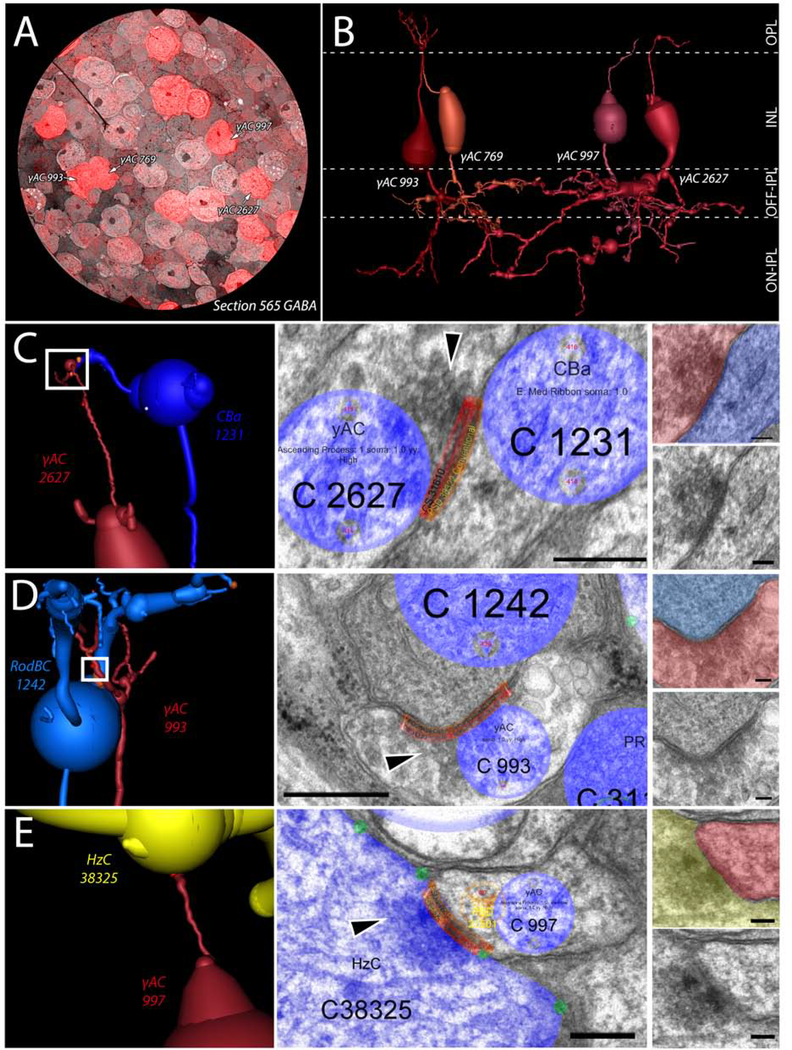
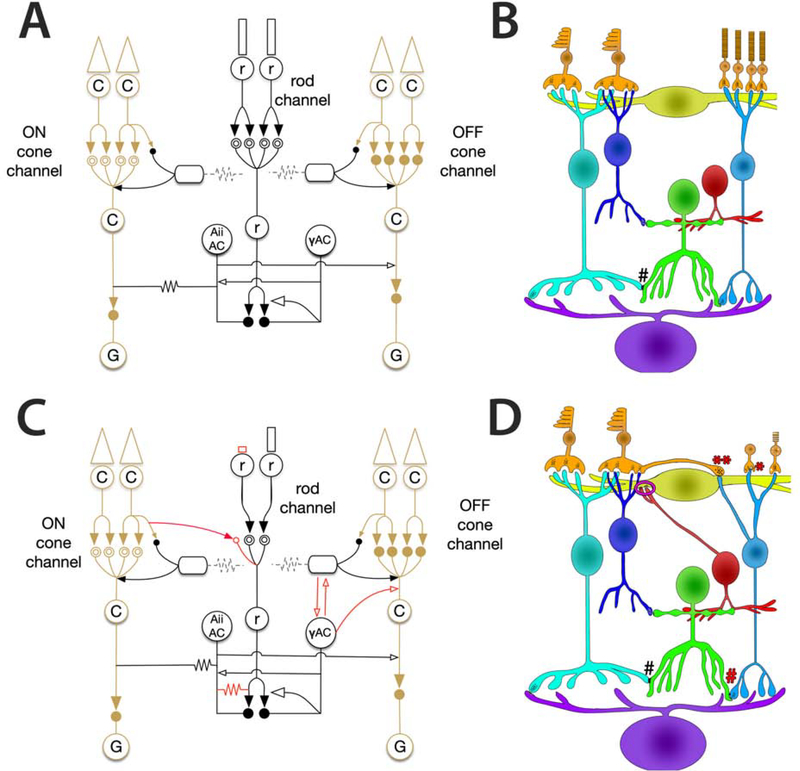
Connectomics has demonstrated that synaptic networks and their topologies are precise and directly correlate with physiology and behavior. The next extension of connectomics is pathoconnectomics: to map neural network synaptology and circuit topologies corrupted by neurological disease in order to identify robust targets for therapeutics. In this report, we characterize a pathoconnectome of early retinal degeneration. This pathoconnectome was generated using serial section transmission electron microscopy to achieve an ultrastructural connectome with 2.18nm/px resolution for accurate identification of all chemical and gap junctional synapses. We observe aberrant connectivity in the rod-network pathway and novel synaptic connections deriving from neurite sprouting. These observations reveal principles of neuron responses to the loss of network components and can be extended to other neurodegenerative diseases.
Keywords: Abnormal ribbon morphology; Connectomics; GABAergic amacrine cells; Neurodegeneration; Pathoconnectomics; Retinal degeneration; Retinitis pigmentosa; Rod pathway.
Copyright © 2020 The Authors. Published by Elsevier Ltd.. All rights reserved.
Figures
Similar articles
-
Aberrant activity in retinal degeneration impairs central visual processing and relies on Cx36-containing gap junctions.Exp Eye Res. 2016 Sep;150:81-9. doi: 10.1016/j.exer.2015.05.013. Epub 2015 May 22. Exp Eye Res. 2016. PMID: 26005040 Free PMC article.
-
Retinal Pathoconnectomics: A Window into Neurodegeneration.Adv Exp Med Biol. 2023;1415:297-301. doi: 10.1007/978-3-031-27681-1_43. Adv Exp Med Biol. 2023. PMID: 37440048 Free PMC article.
-
Model-based comparison of current flow in rod bipolar cells of healthy and early-stage degenerated retina.Exp Eye Res. 2021 Jun;207:108554. doi: 10.1016/j.exer.2021.108554. Epub 2021 Mar 30. Exp Eye Res. 2021. PMID: 33794197 Free PMC article.
-
Retinal connectomics: towards complete, accurate networks.Prog Retin Eye Res. 2013 Nov;37:141-62. doi: 10.1016/j.preteyeres.2013.08.002. Epub 2013 Sep 7. Prog Retin Eye Res. 2013. PMID: 24016532 Free PMC article. Review.
-
Why study rod cell death in retinal degenerations and how?Doc Ophthalmol. 2003 Jan;106(1):25-9. doi: 10.1023/a:1022423724376. Doc Ophthalmol. 2003. PMID: 12675482 Review.
Cited by
-
The Pupillary Light Reflex as a Biomarker of Concussion.Life (Basel). 2021 Oct 18;11(10):1104. doi: 10.3390/life11101104. Life (Basel). 2021. PMID: 34685475 Free PMC article.
-
Cellular and molecular alterations in neurons and glial cells in inherited retinal degeneration.Front Neuroanat. 2022 Sep 26;16:984052. doi: 10.3389/fnana.2022.984052. eCollection 2022. Front Neuroanat. 2022. PMID: 36225228 Free PMC article. Review.
-
Sustained Extracellular Electrical Stimulation Modulates the Permeability of Gap Junctions in rd1 Mouse Retina with Photoreceptor Degeneration.Int J Mol Sci. 2024 Jan 28;25(3):1616. doi: 10.3390/ijms25031616. Int J Mol Sci. 2024. PMID: 38338908 Free PMC article.
-
Generative network modeling reveals quantitative definitions of bilateral symmetry exhibited by a whole insect brain connectome.Elife. 2023 Mar 28;12:e83739. doi: 10.7554/eLife.83739. Elife. 2023. PMID: 36976249 Free PMC article.
-
A synthetic opsin restores vision in patients with severe retinal degeneration.Mol Ther. 2025 May 7;33(5):2279-2290. doi: 10.1016/j.ymthe.2025.03.031. Epub 2025 Mar 21. Mol Ther. 2025. PMID: 40121528
References
-
- Adly MA, Spiwoks-Becker I and Vollrath L, 1999. Ultrastructural changes of photoreceptor synaptic ribbons in relation to time of day and illumination. Invest Ophthalmol Vis Sci. 40 (10), 2165–72. - PubMed
Publication types
MeSH terms
Grants and funding
LinkOut - more resources
Full Text Sources
Miscellaneous
