Secreted cystatins decrease proliferation and enhance apoptosis of human leukemic cells
- PMID: 32810913
- PMCID: PMC7530398
- DOI: 10.1002/2211-5463.12958
Secreted cystatins decrease proliferation and enhance apoptosis of human leukemic cells
Abstract
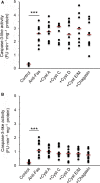
Cysteine proteases are implicated in proteolysis events favoring cancer cell growth, spread, and death by apoptosis. Herein, we have studied whether the net growth and survival of the leukemic cell lines Jurkat, U937, and HL-60 are affected by external addition of five proteins acting as natural cysteine protease inhibitors. None of the cystatins examined (A, C, D, and E/M) or chagasin showed consistent effects on Fas-induced apoptosis when evaluated at 1 µm. In contrast, when the intrinsic apoptosis pathway was activated by hydrogen peroxide, addition of cystatin D augmented caspase-3-like activity within all three cell lines. Flow cytometric analysis of U937 cells also showed increased numbers of annexin V-positive cells when hydrogen peroxide was used to initiate apoptosis and cells were cultured in the presence of cystatin D or C. Moreover, stimulation of hydrogen peroxide-induced apoptotic U937 cells with either cystatin C or D resulted in a dose-dependent decrease in the number of cells. Cell viability was also decreased when U937 cells were cultured in the presence of cystatin C or D (1-9 µm) only, demonstrating that these cystatins can reduce cell proliferation by themselves in addition to enhancing apoptosis induced by oxidative stress. These effects on U937 cells were paralleled by internalization of cystatins C and D, indicating these effects are caused by downregulation of intracellular proteolysis. External addition of cystatins C and D to HL-60 and Jurkat cells demonstrated similar degrees of cystatin D uptake and decreased viability as for U937 cells, indicating that these effects are general for leukemic cells.
Keywords: caspase-3; cystatin C; cystatin D; cysteine peptidase; cysteine protease; protease inhibitor.
© 2020 The Authors. Published by FEBS Press and John Wiley & Sons Ltd.
Conflict of interest statement
The authors declare no conflict of interest.
Figures


Similar articles
-
Cystatins--Extra- and intracellular cysteine protease inhibitors: High-level secretion and uptake of cystatin C in human neuroblastoma cells.Biochimie. 2010 Nov;92(11):1625-34. doi: 10.1016/j.biochi.2010.08.011. Epub 2010 Aug 25. Biochimie. 2010. PMID: 20800088
-
Down-regulation of human extracellular cysteine protease inhibitors by the secreted staphylococcal cysteine proteases, staphopain A and B.Biol Chem. 2007 Apr;388(4):437-46. doi: 10.1515/BC.2007.042. Biol Chem. 2007. PMID: 17391065
-
Enhanced cystatin C and lysosomal protease expression following 6-hydroxydopamine exposure.Neurotoxicology. 2006 Mar;27(2):260-76. doi: 10.1016/j.neuro.2005.11.011. Epub 2006 Jan 18. Neurotoxicology. 2006. PMID: 16414118
-
Review: The future of cystatin engineering.Plant Sci. 2016 May;246:119-127. doi: 10.1016/j.plantsci.2016.02.016. Epub 2016 Feb 27. Plant Sci. 2016. PMID: 26993242 Review.
-
Towards novel anti-cancer strategies based on cystatin function.Cancer Lett. 2006 Apr 28;235(2):159-76. doi: 10.1016/j.canlet.2005.04.001. Cancer Lett. 2006. PMID: 15893421 Review.
Cited by
-
Cystatin M/E (Cystatin 6): A Janus-Faced Cysteine Protease Inhibitor with Both Tumor-Suppressing and Tumor-Promoting Functions.Cancers (Basel). 2021 Apr 14;13(8):1877. doi: 10.3390/cancers13081877. Cancers (Basel). 2021. PMID: 33919854 Free PMC article. Review.
-
A novel coumarin derivative DBH2 inhibits proliferation and induces apoptosis of chronic myeloid leukemia cells.Genes Dis. 2022 Sep 8;10(2):596-607. doi: 10.1016/j.gendis.2022.08.021. eCollection 2023 Mar. Genes Dis. 2022. PMID: 37223541 Free PMC article.
-
The causal relationship between circulating inflammatory proteins, gut microbiotas, immune cells and leukemia: a bidirectional Mendelian randomization study.Discov Oncol. 2025 Jun 19;16(1):1157. doi: 10.1007/s12672-025-02863-y. Discov Oncol. 2025. PMID: 40537729 Free PMC article.
-
Externally added cystatin C reduces growth of A375 melanoma cells by increasing cell cycle time.FEBS Open Bio. 2021 Jun;11(6):1645-1658. doi: 10.1002/2211-5463.13162. Epub 2021 May 2. FEBS Open Bio. 2021. PMID: 33837649 Free PMC article.
-
Proteomic and microbiota analyses of the oral cavity during psychological stress.PLoS One. 2022 May 25;17(5):e0268155. doi: 10.1371/journal.pone.0268155. eCollection 2022. PLoS One. 2022. PMID: 35613108 Free PMC article.
References
-
- Lah TT, Duran Alonso MB and Van Noorden CJ (2006) Antiprotease therapy in cancer: hot or not? Expert Opin Biol Ther 6, 257–279. - PubMed
-
- Jiborn T, Abrahamson M, Gadaleanu V, Lundwall A and Bjartell A (2006) Aberrant expression of cystatin C in prostate cancer is associated with neuroendocrine differentiation. BJU Int 98, 189–196. - PubMed
-
- Hanahan D and Weinberg RA (2011) Hallmarks of cancer: the next generation. Cell 144, 646–674. - PubMed
-
- Stoka V, Turk B, Schendel S, Kim TH, Cirman T, Snipas SJ, Ellerby LM, Bredesen D, Freeze H, Abrahamson M et al (2001) Lysosomal protease pathways to apoptosis. Cleavage of bid, not pro‐caspases, is the most likely route. J Biol Chem 276, 3149–3157. - PubMed
-
- Cirman T, Oresic K, Mazovec GD, Turk V, Reed JC, Myers RM, Salvesen GS and Turk B (2004) Selective disruption of lysosomes in HeLa cells triggers apoptosis mediated by cleavage of Bid by multiple papain‐like lysosomal cathepsins. J Biol Chem 279, 3578–3587. - PubMed
Publication types
MeSH terms
Substances
LinkOut - more resources
Full Text Sources
Medical
Research Materials
Miscellaneous

