Review
. 2020 Oct:37:101674.
doi: 10.1016/j.redox.2020.101674. Epub 2020 Aug 6.

Mitochondrial electron transport chain: Oxidative phosphorylation, oxidant production, and methods of measurement

Affiliations
Review

Mitochondrial electron transport chain: Oxidative phosphorylation, oxidant production, and methods of measurement

Deirdre Nolfi-Donegan et al. Redox Biol. 2020 Oct.

Abstract

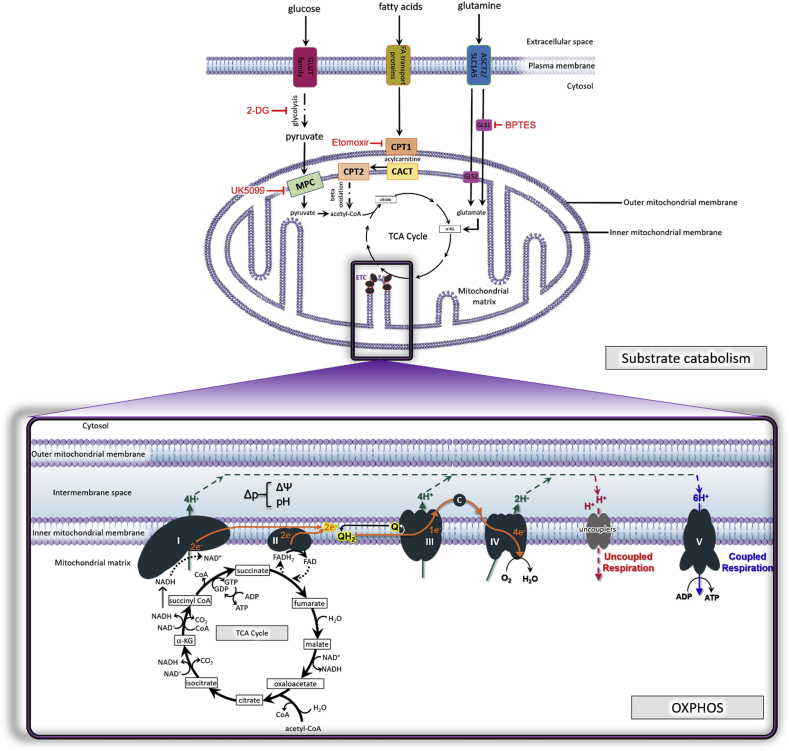
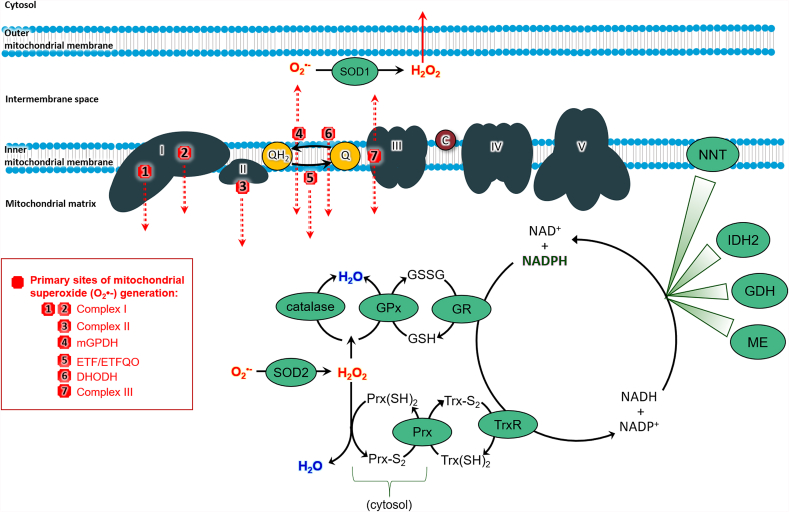
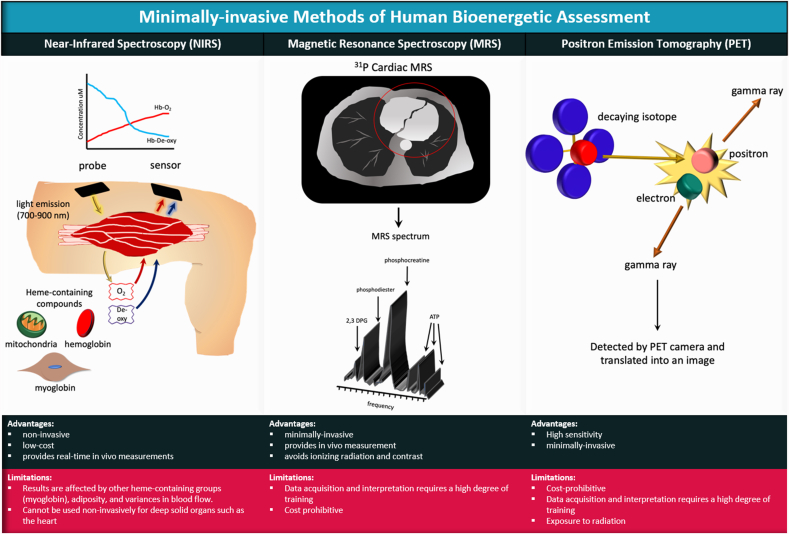
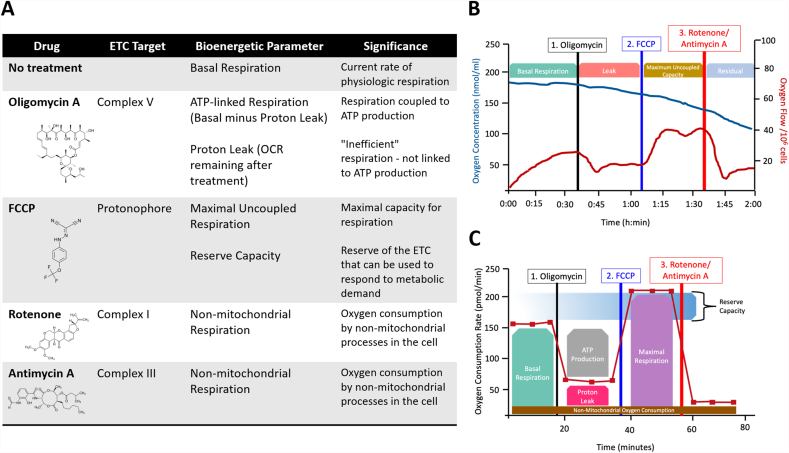
The mitochondrial electron transport chain utilizes a series of electron transfer reactions to generate cellular ATP through oxidative phosphorylation. A consequence of electron transfer is the generation of reactive oxygen species (ROS), which contributes to both homeostatic signaling as well as oxidative stress during pathology. In this graphical review we provide an overview of oxidative phosphorylation and its inter-relationship with ROS production by the electron transport chain. We also outline traditional and novel translational methodology for assessing mitochondrial energetics in health and disease.

Keywords: Electron transport chain; Mitochondria; Mitochondrial reactive oxygen species; Oxidative phosphorylation.


Conflict of interest statement

None.

Figures

Fig. 1
Fig. 1
(A) Substrate supply for mitochondrial respiration. Glucose, fatty acids, and amino acids (glutamine shown here) undergo catabolism to feed into the tricarboxylic acid cycle (TCA cycle), which generates substrates for the electron transport chain (ETC). Glucose is metabolized by glycolysis. Red inhibitory signs denote pharmacologic agents utilized to inhibit specific sources of substrate in order to delineate substrate supply to the ETC, particularly in in vitro respirometric assays as outlined in the text. 2-deoxy-d-glucose (2-DG) inhibits glycolysis. Etomoxir inhibits fatty acid entry into the mitochondria through carnitine palmitoyltransferase 1 (CPT1). Bis-2-(5-phenylacetamido-1,3,4-thiadiazol-2-yl)-ethyl sulfide (BPTES) inhibits glutaminase (GLS) to inhibit glutamine metabolism to glutamate. 2-Cyano-3-(1-phenyl-1H-indol-3-yl)-2-propenoic acid (UK5099) inhibits the mitochondrial pyruvate carrier (MPC) to prevent pyruvate entry into the organelle. Within the mitochondrial matrix, acetyl-CoA is produced from pyruvate or from the beta-oxidation of fatty acids and serves as a point of entry to the TCA cycle. Citrate synthase converts acetyl-CoA and oxaloacetate to citrate. Citrate is converted to isocitrate by aconitase, and isocitrate is in turn oxidized into α-ketoglutarate, which reduces NAD+ to NADH. Next, α-ketoglutarate which is derived from the hydrolysis of extracellular amino acid glutamine to glutamate via the glutaminase (GLS) I and II pathways, enters the TCA cycle. α-ketoglutarate undergoes oxidative decarboxylation with NAD+ and CoA-SH (CoA not attached to an acyl group) to irreversibly form succinyl-CoA, NADH, CO2 and H+. The succinyl-CoA is then hydrolyzed to form succinate, CoA-SH and energy in the form of GTP. Succinate is oxidized to fumarate by Complex II/succinate dehydrogenase while converting FAD to FADH2. Hydration of fumarate by fumarase results in the formation of l-malate that then becomes oxidized to form oxaloacetate, NADH and H+. At this point the cycle is complete and the aldol condensation of oxaloacetate with acetyl CoA and water can restart the TCA cycle. Throughout the TCA cycle, the reduction of NAD+ to NADH is coupled to the release of CO2. (B) Mitochondrial oxidative phosphorylation (OXPHOS). The mitochondrial electron transport chain (ETC) consists of five protein complexes integrated into the inner mitochondrial membrane. The TCA cycle in the mitochondrial matrix supplies NADH and FADH2 to the ETC, each of which donates a pair of electrons to the ETC via Complexes I and II respectively. The transfer of electrons from Complex I to the Q cycle results in a net pumping of 4 protons across the inner membrane into the intermembrane space (IMS). Of note, Complex II does not span the inner membrane and does not participate in proton translocation. The electrons from either Complex I (2 electrons) or Complex II (2 electrons one at a time) are donated to ubiquinone (Q) which is reduced to ubiquinol (QH2). Ubiquinol is oxidized by Complex III allowing one electron at a time to continue the journey through cytochrome c (c). For every electron transferred to cytochrome c, 2 protons (H+) are pumped into the IMS, resulting in 4H+ pumped into the IMS for every electron pair moved through the cycle. Cytochrome c transports electrons to Complex IV where molecular oxygen acts as a terminal electron acceptor and is reduced to water. The reduction of one molecule of O2 requires 4 electrons. The reduction of O2 to H2O results in the pumping of 4 protons to the IMS, but 2 protons are consumed in the process, netting a total of 2 H+ pumped into the IMS at Complex IV. The movement of protons from the mitochondrial matrix into the intermembrane space in response to electron transfer creates a protonmotive force (Δp), which is the proton concentration (pH) combined with the electrochemical proton gradient known as the mitochondrial membrane potential (ΔΨ). The membrane potential is dissipated by the re-entry of H+ back into the matrix through Complex V, which is coupled to the production of ATP from ADP. In contrast, uncoupled respiration due to proton leak is facilitated by adenine nucleotide translocase (ANT) and uncoupling proteins (UCP) and dissipates membrane potential at the expense of ATP production. Abbreviations: protonmotive force, Δp; oxaloacetic acid, OAA, alpha-ketoglutarate, α-KG; carbon dioxide, CO2; reduced flavin adenine dinucleotide reduced FADH2; glutaminase, GLS; carnitine palmityl transferase, CPT; carnitine-acylcarnitine translocase, CACT; mitochondrial pyruvate carrier, MPT. (For interpretation of the references to colour in this figure legend, the reader is referred to the Web version of this article.)
Fig. 2
Fig. 2
Sites of mitochondrial ROS production and antioxidant systems. Seven major ETC sites of ROS generation are shown here, with red lines indicating on which side of the membrane the ROS are formed. Superoxide (O2•–) is the primary ROS generated by the ETC. O2 is dismutated to H2O2 by MnSOD in the matrix and Cu/Zn SOD in the intermembrane space. Also within the matrix is the glutathione peroxidase (GPx)/glutathione reductase (GR) system and catalase, found in liver and cardiac tissues. The peroxiredoxin (Prx)/thioredoxin (TrxR) system overlaps between the cytosol and the matrix. NADPH/NADP + renews these antioxidant systems with its reducing potential. Matrix enzymes (malic enzyme (ME), glutamate dehydrogenase (GDH), and isocitrate dehydrogenase (IDH2)) and the inner membrane-associated nicotinamide nucleotide transhydrogenase (NNT) regenerate the pool of NADPH. Abbreviations: mitochondrial glycerol-3-phosphate dehydrogenase, mGPDH; dihydroorotate dehydrogenase, DHODH, electron transfer flavoprotein oxidoreductase, ETFQO; superoxide, O2•-; hydrogen peroxide, H2O2; water, H2O; glutathione, GSH; glutathione disulfide, GSSG; glutathione peroxidase, GPx; GR; thioredoxin reductase,TR; reduced thioredoxin, Trx (SH)2; oxidized thioredoxin Trx-S2; peroxiredoxin, Prx; reduced peroxiredoxin, Prx (SH)2; oxidized peroxiredoxin, Prx-S2; malic enzyme, ME; glutamate dehydrogenase, GDH; NADP+-dependent isocitrate dehydrogenase, IDH2, and nicotinamide nucleotide transhydrogenase, NNT. (For interpretation of the references to colour in this figure legend, the reader is referred to the Web version of this article.)
Fig. 3
Fig. 3
Minimally-invasive methods of human bioenergetic assessment. Near Infrared Spectroscopy (NIRS) operates on the principle that near-infrared light (700–900 nm) penetrates tissue with little scatter and is absorbed by heme-containing groups (e.g., hemoglobin, myoglobin, and the heme-containing prosthetic groups within the mitochondrial electron chain complexes) in an oxygen-dependent manner. Measurement of changes in absorbance can be used to reflect changes in tissue oxygenation and mitochondrial oxidative capacity. Magnetic Resonance Spectroscopy (MRS) utilizes magnetic resonant-visible isotopes (eg, 1H, 31P and 13C), with each resonating at characteristic frequencies within a magnetic field. The distinct resonance of known isotopes creates a signature for identification of compounds within living tissues. MRS can distinguish products of glycolysis, creatine metabolism, choline metabolism, and amino acid metabolism. Positron Emission Tomography (PET) utilizes a radioactive isotope tracer such as glucose analogue 18-fluorodeoxyglucose ([18F]FDG) or other radio-labeled metabolites (acetate, choline, methionine or glutamine). The tracer is administered intravenously and becomes trapped within metabolically active cells. The nucleus of the isotope emits positrons as it decays. The positrons make contact with electrons to generate high-energy photons (gamma rays) that are detected by the PET camera and translated into an electrical signal to produce an image. The image that is produced is dependent on the metabolism of the cells/tissues that take up the isotope.
Fig. 4
Fig. 4
Respirometric methods of bioenergetic assessment. Panel (A) shows the common pharmacologic modulators of the respiratory chain utilized to generate a bioenergetic profile (along with their chemical structures), the target of these modulators, the bioenergetic parameter measured in their presence, and the significance of each parameter. (B) A typical bioenergetic profile generated in the Oroboros system showing oxygen concentration in the chamber over time (blue trace) and the calculated oxygen flux (red trace). (C) A typical bioenergetic profile generated by the Seahorse XF analyzer in which oxygen consumption rate (OCR) over time is shown. (For interpretation of the references to colour in this figure legend, the reader is referred to the Web version of this article.)
Fig. 5
Fig. 5
Changes in platelet bioenergetics in human disease. The bioenergetic profiles of platelets reflect alterations that occur at a systemic level during human disease states. Bioenergetic profiles have been measured in platelets isolated from patients with a wide array of diagnosed diseases. This figure demonstrates published platelet bioenergetic alterations in neurologic disease including Alzheimer's disease [53] and bipolar disorder [54], metabolic changes including type II diabetes [55] and advanced age [45], cardiopulmonary diseases including pulmonary hypertension [50,56] and asthma [47,57], sickle cell disease as a hematologic disease [44], and infectious disease such as sepsis [58].

References

    1. P S. Powerhouse of the cell. Sci. Am. 1957;197(1):131–140.
    1. Jensen P.K. Antimycin-insensitive oxidation of succinate and reduced nicotinamide-adenine dinucleotide in electron-transport particles. II. Steroid effects. Biochim. Biophys. Acta. 1966;122(2):167–174. - PubMed
    1. Ventura-Clapier R. Bioenergetics of the failing heart. Biochim. Biophys. Acta. 2011;1813(7):1360–1372. - PubMed
    1. Widlansky M.E., Gutterman D.D. Regulation of endothelial function by mitochondrial reactive oxygen species. Antioxidants Redox Signal. 2011;15(6):1517–1530. - PMC - PubMed
    1. Stryer L. fourth ed. W.H. Freeman; New York: 1995. Biochemistry; p. 1064. xxxiv.

Publication types

LinkOut - more resources