. 2020 Aug 18;11(8):654.
doi: 10.1038/s41419-020-02886-z.

MICAL2 is essential for myogenic lineage commitment

Affiliations

MICAL2 is essential for myogenic lineage commitment

Nefele Giarratana et al. Cell Death Dis. .

Abstract

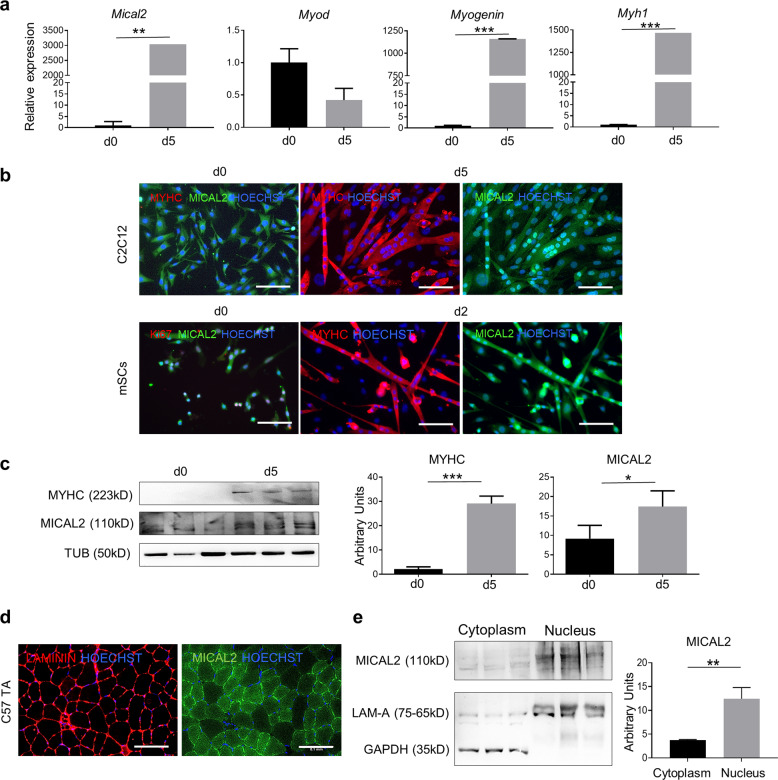
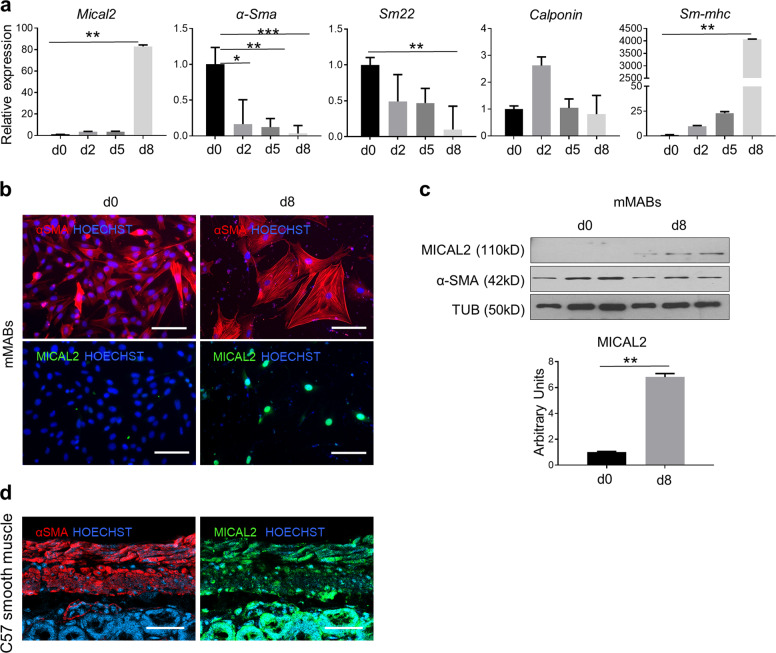
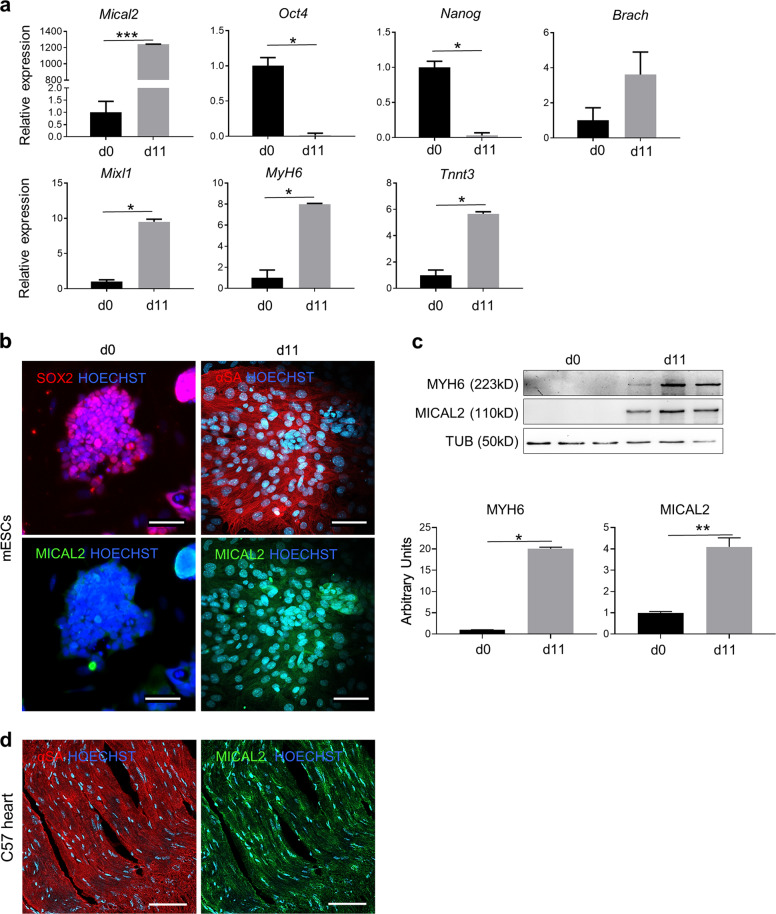
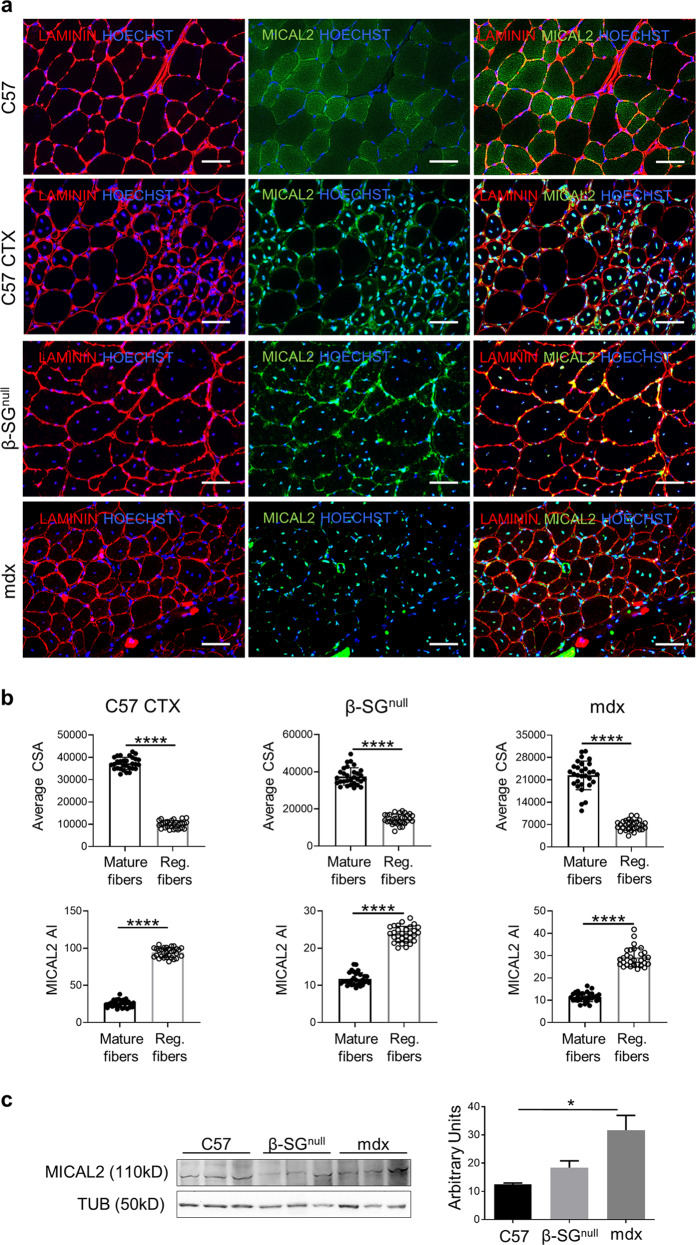
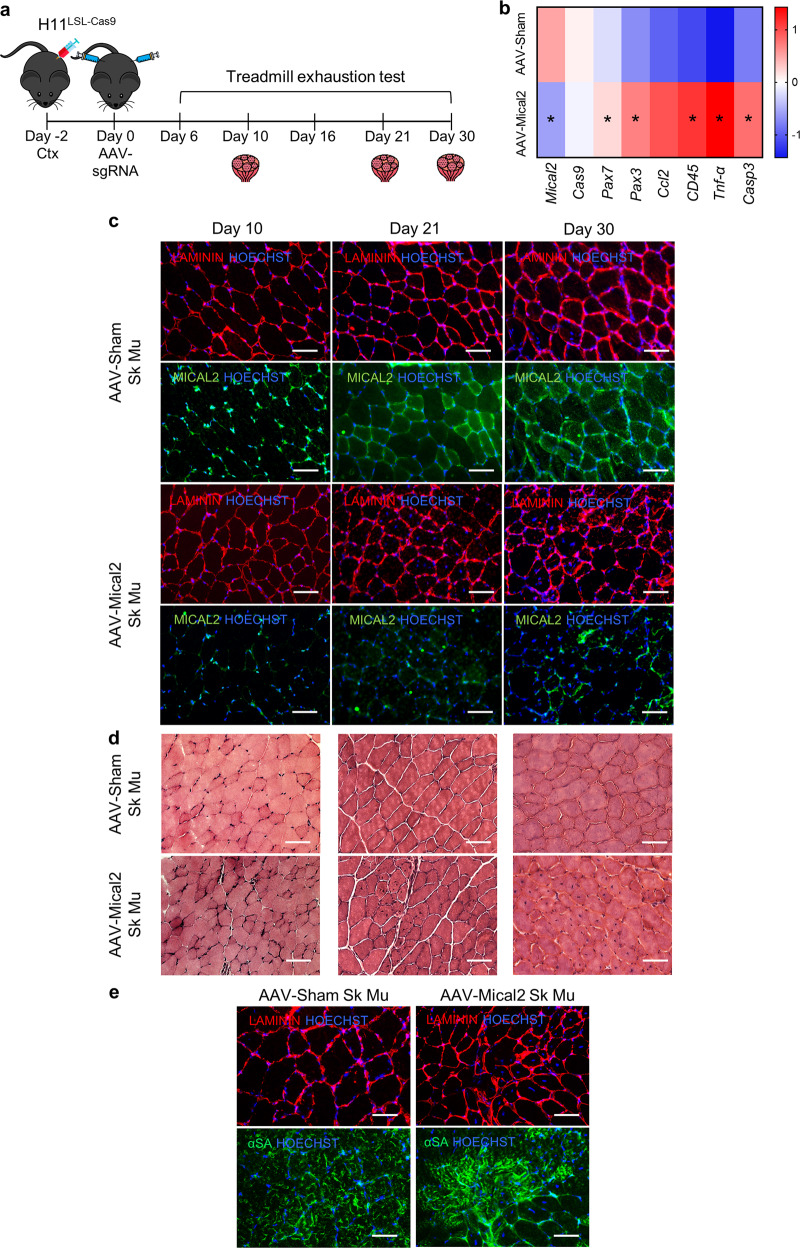
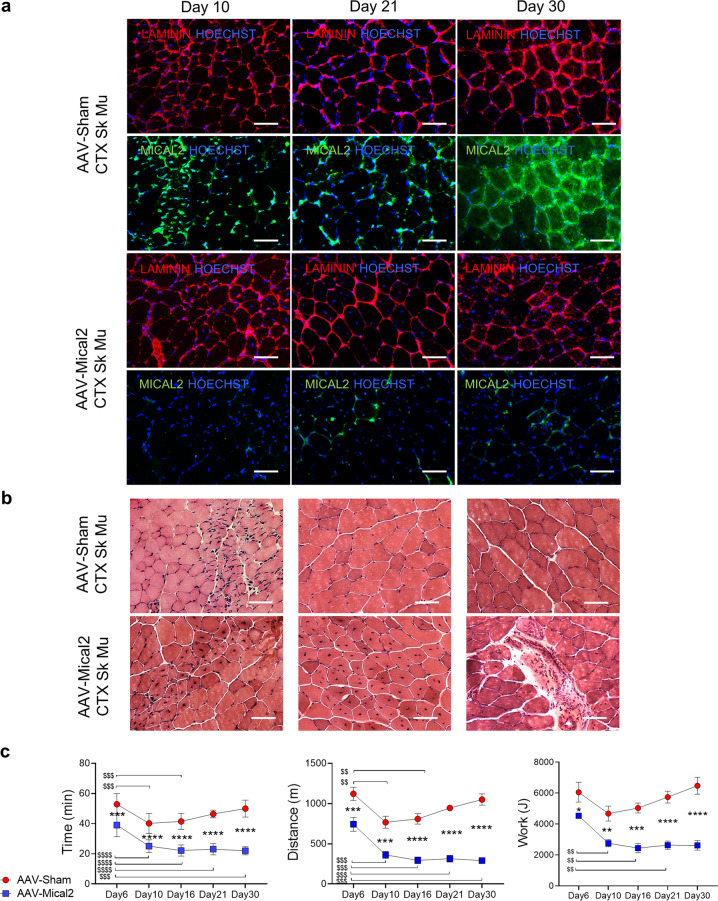
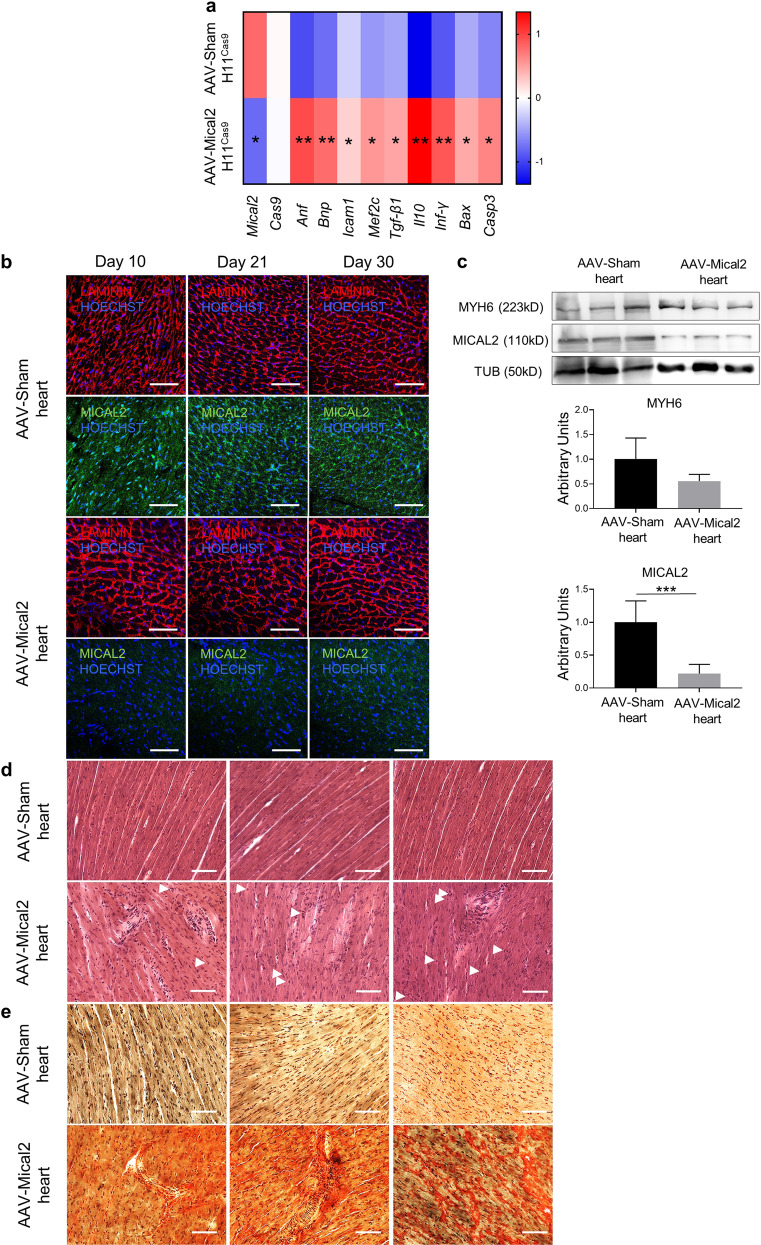
Contractile myofiber units are mainly composed of thick myosin and thin actin (F-actin) filaments. F-Actin interacts with Microtubule Associated Monooxygenase, Calponin And LIM Domain Containing 2 (MICAL2). Indeed, MICAL2 modifies actin subunits and promotes actin filament turnover by severing them and preventing repolymerization. In this study, we found that MICAL2 increases during myogenic differentiation of adult and pluripotent stem cells (PSCs) towards skeletal, smooth and cardiac muscle cells and localizes in the nucleus of acute and chronic regenerating muscle fibers. In vivo delivery of Cas9-Mical2 guide RNA complexes results in muscle actin defects and demonstrates that MICAL2 is essential for skeletal muscle homeostasis and functionality. Conversely, MICAL2 upregulation shows a positive impact on skeletal and cardiac muscle commitments. Taken together these data demonstrate that modulations of MICAL2 have an impact on muscle filament dynamics and its fine-tuned balance is essential for the regeneration of muscle tissues.


Conflict of interest statement

The authors declare that they have no conflict of interest.

Figures

Fig. 1
Fig. 1. MICAL2 increases in C2C12 and mSCs differentiated myotubes.
a qRT-PCR showing the relative expression of MyoD, Myogenin, MyH1 and Mical2 at day0 and day5 of C2C12 cell differentiation. b IF assay for MyHC (red) and MICAL2 (green) at day 0 and day 5 (C2C12) or day 2 (mSC) of skeletal muscle differentiation. Nuclei stained with HOECHST (blue). Scale bars 200 μm. c WB for MyHC and MICAL2 proteins on proliferating (day 0) and differentiating (day 5) C2C12 cells. The relative quantification is on the right. d IF analysis for MICAL2 (green) and LAMININ (red) localization on TA cross-sections of C57/Bl6 (C57). Scale bars 100 μm. N = 3. e WB for MICAL2 cytoplasmic and nuclear protein fractions on C57/Bl6 (C57) GN. The relative quantification is on the right. * = p < 0.05; ** = p < 0.01; *** = p < 0.001 by two-tailed t test. See also Figs. S1–S3.
Fig. 2
Fig. 2. MICAL2 characterization in mMABs smooth muscle differentiation.
a qRT-PCR showing the relative expression of α-Sma, Sm22, Calponin, SM-MyHC, and Mical2 at day 0, day 2, day 5 and day 8 of smooth muscle differentiation. b IF assay for α-Smooth Muscle Actin (α-SMA; red) and MICAL2 (green). Nuclei stained with HOECHST (blue). Scale bars 50 μm. c WB and relative quantification for MICAL2 and α-SMA, on proliferating (day 0) and differentiating (day 8) mMABs. N = 3. d IF analysis for α-SMA (red) and MICAL2 (green) localization on gastrointestinal tract cross-sections of C57/Bl6 (C57). Scale bars 50 μm. N = 3. * = p < 0.05; ** = p < 0.01; *** = p < 0.001 one-way ANOVA test and two-tailed t test.
Fig. 3
Fig. 3. MICAL2 characterization in mESCs differentiated to cardiomyocyte-like cells.
a qRT-PCR showing the relative expression of pluripotency markers Oct4, Nanog, mesoderm and progenitor markers Brach, MixL1, cardiac differentiation markers MyH6 and TnnT3, and Mical2 in proliferating mESCs (day 0) and in beating cardiomyocyte-like cells (day 11). b IF assay in mESCs at d0 for SOX2 (red) and MICAL2 (green) and day 11 of cardiac differentiation for α-SA (red) and MICAL2 (green). Nuclei stained with HOECHST (blue). Scale bars 200 μm. c WB and relative quantification for MyH6 and MICAL2 on proliferating (day 0) and differentiating (day 11) mESCs. N = 3. d IF analysis for α-SA (red) and MICAL2 (green) localization on heart cross-sections of C57/Bl6 (C57). Scale bars 100 μm. * = p < 0.05; ** = p < 0.01 by two-tailed t test. See also Figs. S4, S5.
Fig. 4
Fig. 4. MICAL2 characterization in muscle fibers.
a Upper panels show IF analysis for LAMININ (red) and MICAL2 (green) localization on TA cross-sections of uninjured control C57/Bl6 (C57), acute regeneration of C57/Bl6 after cardiotoxin injection (C57 CTX), chronic regeneration of β-SGnull and mdx dystrophic models. Nuclei stained with HOECHST (blue). Magnification 20x. Scale bars 50 μm. b Upper panels show average CSA between mature and regenerating fibers of C57 CTX, β-SGnull and mdx dystrophic models. Lower panels show MICAL2 fluorescence intensity calculated as absolute intensity (MICAL2 AI) in mature and central nucleated regenerating fibers of C57 CTX, β-SGnull and mdx dystrophic models. N = 5. c WB and relative quantification for MICAL2 on gastrocnemius of uninjured control C57/Bl6 (C57) and chronic regeneration of β-SGnull and mdx dystrophic models. N = 3. * = p < 0.05; **** = p < 0.0001 by one-way ANOVA test.
Fig. 5
Fig. 5. In vivo MICAL2 CRISPR/Cas9 system induces skeletal muscle degeneration/regeneration, inflammation and fibrosis.
a Timeline illustrating the experiment setup. At day -2, H11LSL-Cas9 underwent skeletal muscle damage by CTX injections on the right hind limb (TA, GC and Q). At day 0, CRISPR/Cas9 system activation via AAV-Cre with either Sham sgRNA or Mical2 sgRNA in both hind limbs (TA, GC and Q). At day 6, 10, 16, 21 and 30 treadmill exhaustion tests were performed and at day 10, 21 and 30 mice were sacrificed for molecular and histological analyses. b Heat map representing qRT-PCR Z-score of Mical2 and Cas9 for the system activation, Pax7, Pax3 and Ccl2 for skeletal muscle regeneration and remodeling and CD45, Tnf-α and cleaved Casp3 (Casp3) for inflammation and apoptosis. c IF analysis illustrates at day 10, day 21 and day 30 LAMININ (red) and MICAL2 (green) localization on left TA cross-sections of AAV-Sham H11Cas9 mice compared to AAV-Mical2 H11Cas9 mice. Nuclei stained with HOECHST (blue). Scale bars 50 μm. d The effect of MICAL2 CRISPR/Cas9 is shown by H&E staining on left TA cross-sections of AAV-Sham H11Cas9 mice compared to AAV-Mical2 H11Cas9 mice, along time points of 10, 21 and 30 days. Scale bars 50 μm. e IF analysis of LAMININ (red) and alpha-SARCOMERIC ACTININ (α-SA; green) in AAV-Mical2 muscles showed actin filament disorganization compared to controls at day 30 from infection. Scale bars 50 μm. N = 6. * = p < 0.05 by two-tailed t test. See also Fig. S6.
Fig. 6
Fig. 6. In vivo MICAL2 CRISPR/Cas9 system restrains regeneration in injured skeletal muscle and impairs muscle functionality.
a IF analysis illustrates at day 10, day 21 and day 30 LAMININ (red) and MICAL2 (green) localization on right TA cross-sections of AAV-Sham H11Cas9 mice compared to AAV-Mical2 H11Cas9 mice, regenerating after CTX injections. Nuclei stained with HOECHST (blue). Scale bars 50 μm. b The effect of MICAL2 CRISPR/Cas9 is shown by H&E staining on regenerating right TA cross-sections of AAV-Sham H11Cas9 mice compared to AAV-Mical2 H11Cas9 mice, along time points of 10, 21 and 30 days. Scale bars 50 μm. c Treadmill exhaustion test of AAV-Sham H11Cas9 mice compared to AAV-Mical2 H11Cas9 mice along time, from the CRISPR/Cas9 activation up to one month follow up. From left to right, graphs of Time of run (min), Distance (m) and Work (J) at day 6, day 10, day 16, day 21 and day30. N = 6. *** = p < 0.001; **** = p < 0.0001intergroups by t test. $$ = p < 0.01; $$$ = p < 0.001; $$$$ = p < 0.0001 intragroup by two-tailed t test. See also Fig. S6.
Fig. 7
Fig. 7. In vivo MICAL2 CRISPR/Cas9 system induces cardiac muscle remodeling, inflammation, fibrosis and apoptosis.
a Heat map representing qRT-PCR Z-score of Mical2 and Cas9 for the system activation, Anf and Bnp for cardiac stress, Mef2c, Tgf-β and Il10 for cardiac remodeling and fibrosis, Icam1 and Ifn-γ for cardiac inflammation and Bax and cleaved Casp3 (Casp3) apoptosis. b IF analysis illustrates at day 10, day 21 and day 30 LAMININ (red) and MICAL2 (green) localization on heart cross-sections of AAV-Sham H11Cas9 mice compared to AAV-Mical2 H11Cas9 mice. Nuclei stained with HOECHST (blue). Scale bars 100 μm. c WB for MYH6 and MICAL2 proteins on hearts of AAV-Sham H11Cas9 mice compared to AAV-Mical2 H11Cas9 mice. The relative quantification is below. N = 3. d The effect of MICAL2 CRISPR/Cas9 is shown by H&E staining on heart cross-sections of AAV-Sham H11Cas9 mice compared to AAV-Mical2 H11Cas9 mice, along time points of 10, 21 and 30 days. Scale bars 50 μm. e Collagen deposition and fibrosis (red) due to the effect of Mical2 CRISPR/Cas9 are shown by Picro-Sirius red staining on heart cross-sections of AAV-Sham H11Cas9 mice compared to AAV-Mical2 H11Cas9 mice, along time points of 10, 21 and 30 days. Scale bars 50 μm. N = 6. * = p < 0.05; ** = p < 0.01; *** = p < 0.001 by two-tailed t test.

References

    1. Costamagna D, Costelli P, Sampaolesi M, Penna F. Role of inflammation in muscle homeostasis and myogenesis. Mediators Inflamm. 2015;2015:805172. - PMC - PubMed
    1. Mauro A. Satellite cell of skeletal muscle fibers. J. Biophys. Biochem. Cytol. 1961;9:493–495. - PMC - PubMed
    1. Zammit PS. Function of the myogenic regulatory factors Myf5, MyoD, Myogenin and MRF4 in skeletal muscle, satellite cells and regenerative myogenesis. Semin Cell Dev. Biol. 2017;72:19–32. - PubMed
    1. Camps J, et al. Interstitial cell remodeling promotes aberrant adipogenesis in dystrophic muscles. Cell Rep. 2020;31:107597. - PubMed
    1. Charge SB, Rudnicki MA. Cellular and molecular regulation of muscle regeneration. Physiol. Rev. 2004;84:209–238. - PubMed

Publication types