. 2021 Jul;42(7):1124-1138.
doi: 10.1038/s41401-020-0497-0. Epub 2020 Aug 18.

Betulinic acid hydroxamate prevents colonic inflammation and fibrosis in murine models of inflammatory bowel disease

Affiliations

Betulinic acid hydroxamate prevents colonic inflammation and fibrosis in murine models of inflammatory bowel disease

María E Prados et al. Acta Pharmacol Sin. 2021 Jul.

Abstract

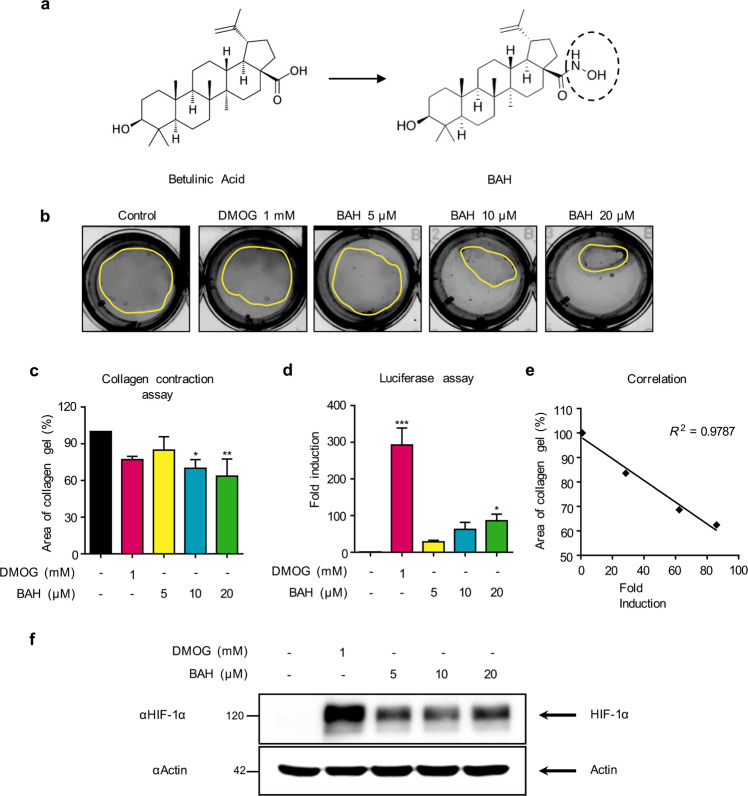
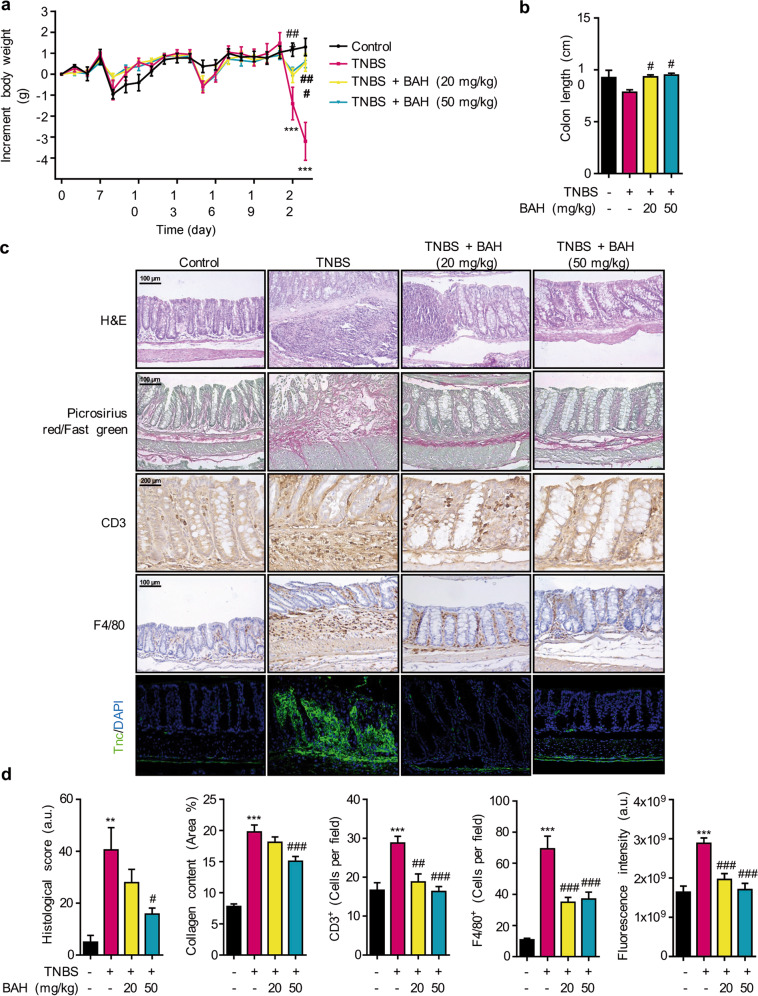
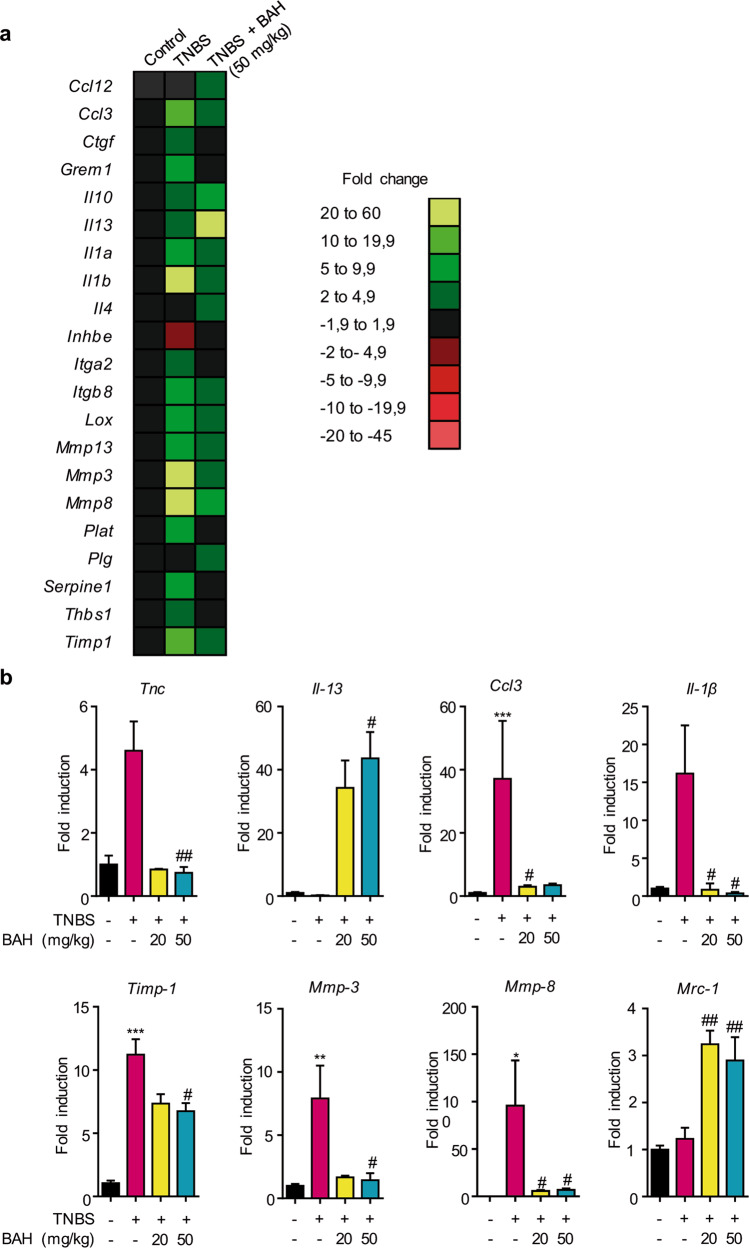
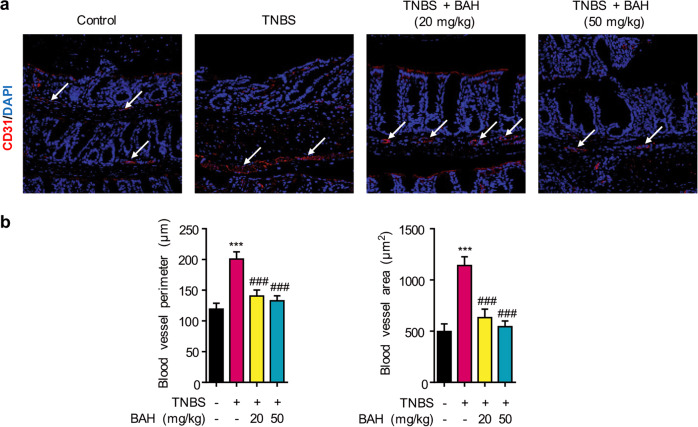
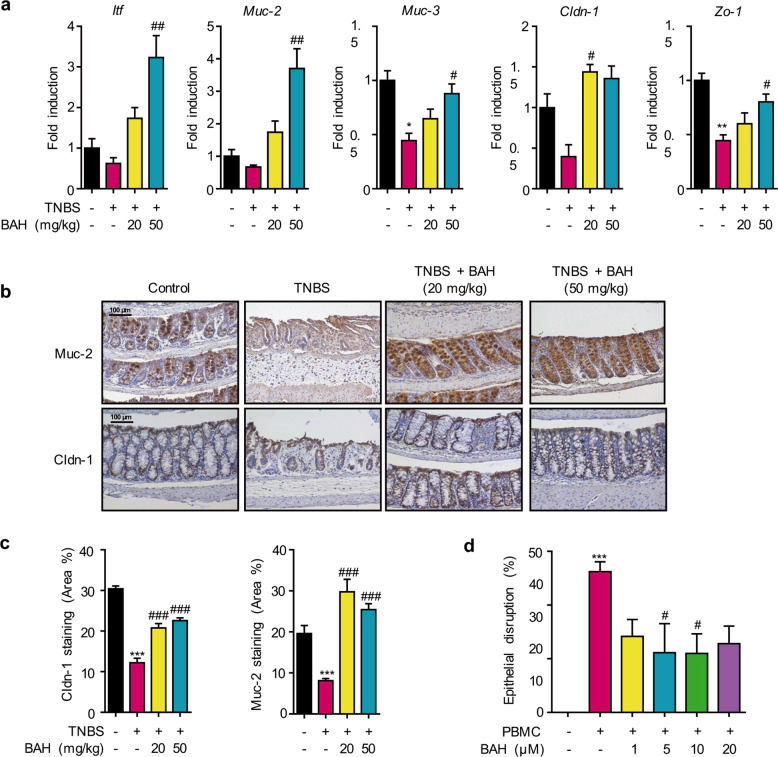
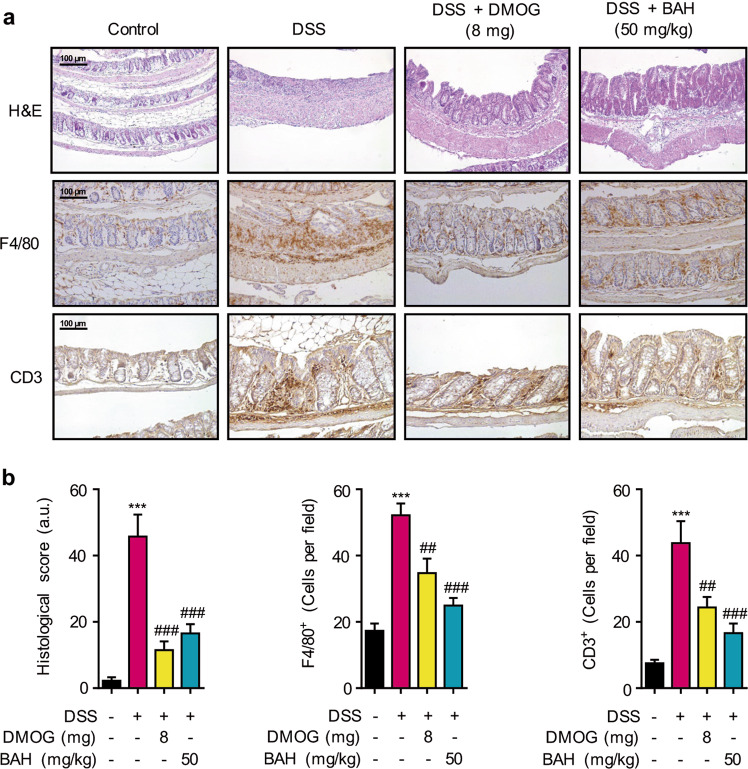
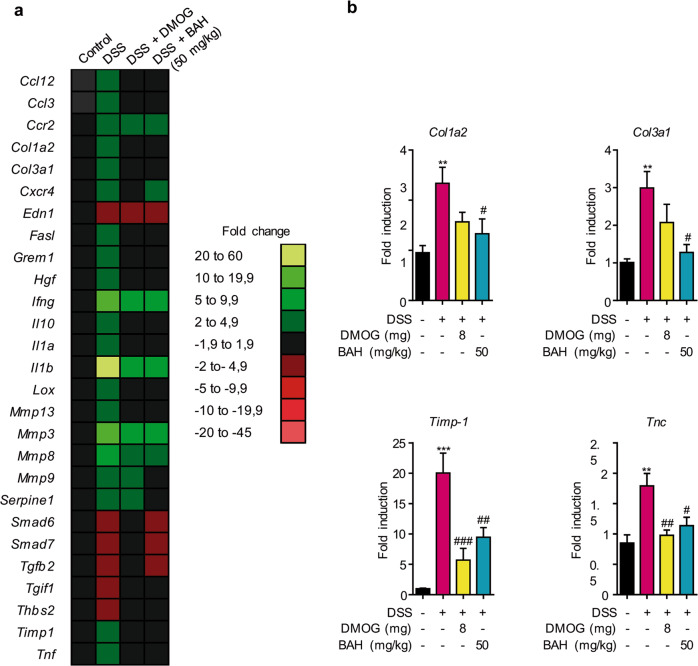
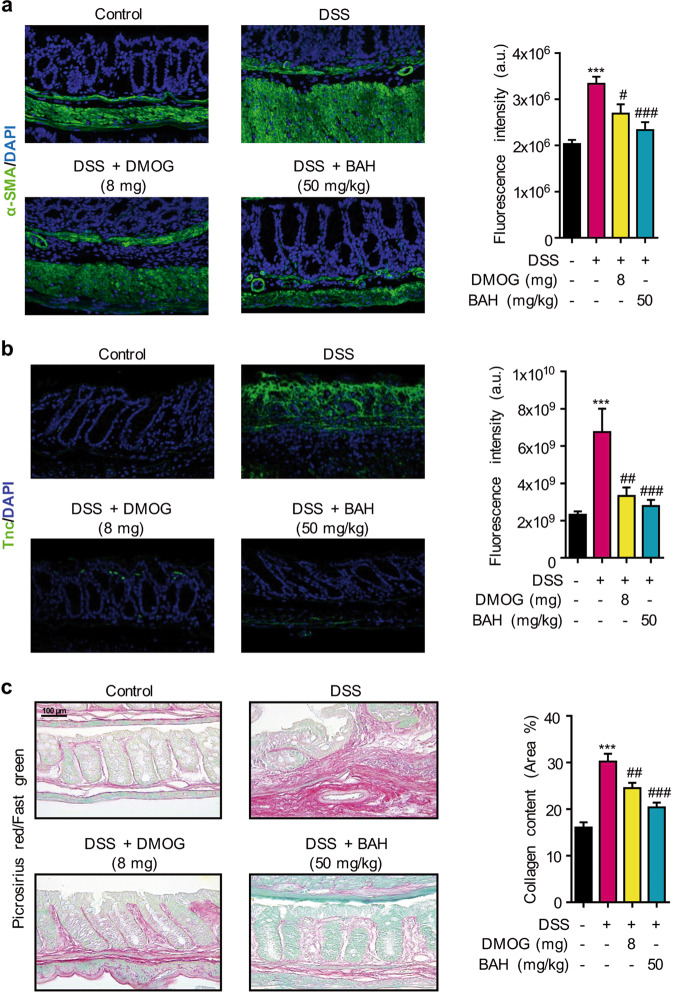
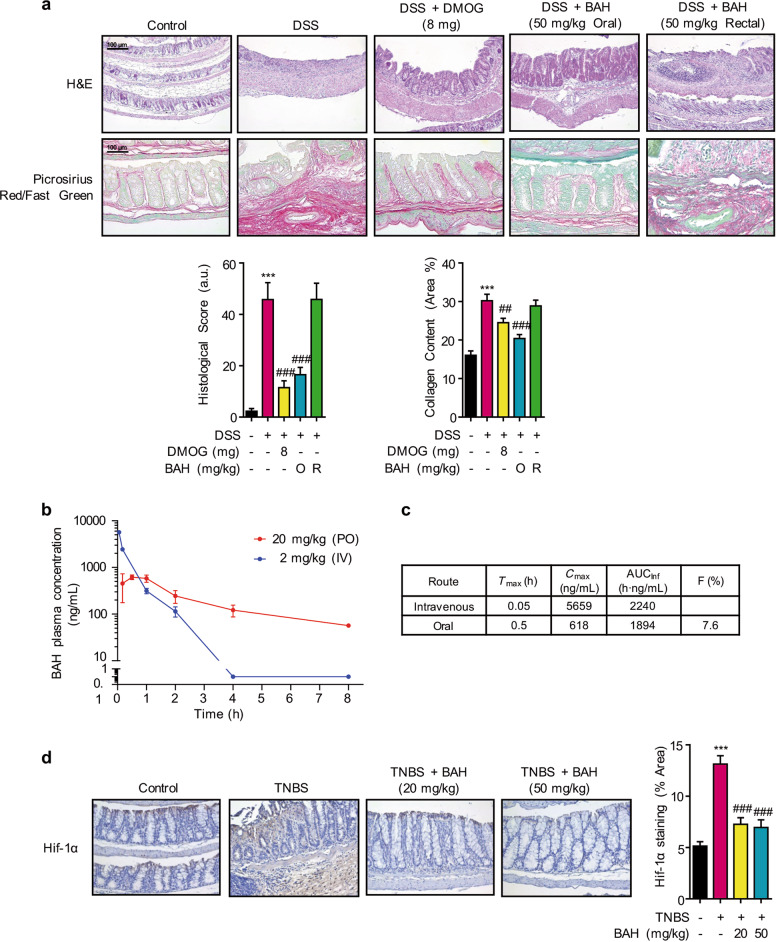
Intestinal fibrosis is a common complication of inflammatory bowel disease (IBD) and is defined as an excessive accumulation of scar tissue in the intestinal wall. Intestinal fibrosis occurs in both forms of IBD: ulcerative colitis and Crohn's disease. Small-molecule inhibitors targeting hypoxia-inducing factor (HIF) prolyl-hydroxylases are promising for the development of novel antifibrotic therapies in IBD. Herein, we evaluated the therapeutic efficacy of hydroxamate of betulinic acid (BHA), a hypoxia mimetic derivative of betulinic acid, against IBD in vitro and in vivo. We showed that BAH (5-20 μM) dose-dependently enhanced collagen gel contraction and activated the HIF pathway in NIH-3T3 fibroblasts; BAH treatment also prevented the loss of trans-epithelial electrical resistance induced by proinflammatory cytokines in Caco-2 cells. In two different murine models (TNBS- and DSS-induced IBD) that cause colon fibrosis, oral administration of BAH (20, 50 mg/kg·d, for 17 days) prevented colon inflammation and fibrosis, as detected using immunohistochemistry and qPCR assays. BAH-treated animals showed a significant reduction of fibrotic markers (Tnc, Col1a2, Col3a1, Timp-1, α-SMA) and inflammatory markers (F4/80+, CD3+, Il-1β, Ccl3) in colon tissue, as well as an improvement in epithelial barrier integrity and wound healing. BHA displayed promising oral bioavailability, no significant activity against a panel of 68 potential pharmacological targets and was devoid of genotoxicity and cardiotoxicity. Taken together, our results provide evidence that oral administration of BAH can alleviate colon inflammation and colitis-associated fibrosis, identifying the enhancement of colon barrier integrity as a possible mechanism of action, and providing a solid rationale for additional clinical studies.

Keywords: DSS; TNBS; betulinic acid hydroxamate; colon inflammation; fibrosis; hypoxia-inducible factor; inflammatory bowel disease; prolyl hydroxylases.


Conflict of interest statement

MEP, AGM, and JDUB are employees of Emerald Health Biotechnology. EM is a member of the Scientific Advisory Boards of Emerald Health Biotechnology. None of the authors have conflicts of interest. GA, AM, and EM have submitted a PCT with the publication number WO2018/069086A.

Figures

Fig. 1
Fig. 1. Effect of BAH on collagen gel contraction and HIF activity.
a Chemical structures of betulinic acid and BAH. b Images of contracted gel matrices in response to 12 h of BAH exposure. c Gel surface area quantified in terms of total pixel number using ImageJ. d NIH-3T3 fibroblasts stably transfected with a luciferase-HRE (NIH3T3-EPO-luc) were stimulated with the indicated concentrations of BAH or DMOG. e Correlation between HIF activity induced by BAH and collagen gel contraction. f HIF-1α protein expression in NIH-3T3-Epo-luc cells after 6 h of treatment with BAH and DMOG. Values are expressed as the mean ± SD. *P < 0.05 and ** P < 0.01 versus control group; significance was determined by one-way ANOVA followed by Dunnett’s post hoc test.
Fig. 2
Fig. 2. BAH attenuates clinical severity, fibrosis and inflammatory-related biomarkers in the TNBS model.
a BAH significantly ameliorated the decrease in body weight induced by TNBS. Significance was determined by two-way ANOVA followed by Tukey’s post hoc test. b Colon length was measured at the time of sacrifice and was compared between groups. Significance was determined by one-way ANOVA followed by Dunnett’s post hoc test. Panel c depicts histological sections stained with H&E or picrosirius red/fast green as well as images from immunohistochemistry experiments performed on macrophages (F4/80) or lymphocyte T (CD3) and from TNC immunofluorescence. Representative images are shown at the indicated magnification. d Quantification of different markers from panel c. All results are shown as the mean ± SEM (n = 4–10 animals per group), and significance was determined by one-way ANOVA followed by Tukey’s post hoc test, with the exception of the histological score (Dunnett’s test). **P < 0.01 and ***P < 0.001 for TNBS + vehicle vs control + vehicle; #P < 0.05, ##P < 0.01, and ###P < 0.001 for TNBS + BAH vs TNBS + vehicle.
Fig. 3
Fig. 3. BAH treatment normalized the expression of genes associated with fibrosis in the TNBS model.
a RNA from colon tissue was used to determine the expression of genes involved in fibrosis by PCR array. Heat maps showed the significantly upregulated (green) or downregulated (red) genes in TNBS + vehicle or TNBS + BAH compared with control + vehicle. b The mRNA expression of fibrosis-related genes (Tnc, Il-13, Timp-1, Il-1β, Ccl3, Mmp-3, Mmp-8, and Mrc-1) was quantified by qPCR and normalized to the levels of Gapdh. Data represent the mean ± SEM, and significance was determined by one-way ANOVA followed by Dunnett’s post hoc test. The results are expressed as the mean ± SEM (n = 3–7 animals per group) *P < 0.05, **P < 0.01, and ***P < 0.001 for TNBS + vehicle vs control + vehicle; #P < 0.05, and ##P < 0.01 for TNBS + BAH vs TNBS + vehicle.
Fig. 4
Fig. 4. Increase in blood vessel density and area were prevented by BAH treatment.
a Representative confocal microscopy images (original magnification ×20) of vessels marked with CD31 (white arrows). b The quantification of the perimeter and area is shown as the mean ± SEM (n = 4 animals per group), and significance was determined by one-way ANOVA followed by Tukey’s post hoc test. ***P < 0.001 for TNBS + vehicle vs control + vehicle; ###P < 0.001 TNBS + BAH vs TNBS + vehicle.
Fig. 5
Fig. 5. BAH enhances intestinal epithelial barrier integrity.
a A panel of genes related to epithelial barrier integrity was significantly increased in mice treated with the compound BAH. The quantification is shown as the mean ± SEM (n = 3–8 animals per group), and significance was determined by one-way ANOVA, which was followed by Dunnett’s post hoc test. b Images show immunostaining of colon sections for the mucin-specific marker Muc-2 and the tight junction protein Claudin-1 at an original magnification of 20×; their quantification (c) is shown as the mean ± SEM (n = 4 animals per group), and significance was determined by one-way ANOVA followed by Tukey’s post hoc test. *P < 0.05, **P < 0.01, and ***P < 0.001 for TNBS + vehicle vs control + vehicle; #P < 0.05, ##P < 0.01, and ###P < 0.001 for TNBS + BAH vs TNBS + vehicle. d BAH treatment protected against epithelial disruption promoted by PBMCs in the Caco-2 cell line. Data represent the mean ± SD (n = 5). ***P < 0.001 for PBMC-treated cells vs control; #P < 0.05 for BAH-treated cells vs PBMC-treated cells (one-way ANOVA followed by Tukey’s post hoc test).
Fig. 6
Fig. 6. BAH significantly reduces inflammation and preserves epithelial structure in the colon of DSS animals.
a Representative images of H&E staining and macrophage (F4/80) and lymphocyte (CD3) infiltration in colon sections [original magnification (×20)]. b BAH and DMOG treatments improved the histological score and the number of inflammatory cells present in colon tissues. Quantification is shown as the mean ± SEM (n = 4–7 animals per group), and significance was determined by one-way ANOVA followed by Tukey’s post hoc test. ***P < 0.001 for DSS + vehicle vs control + vehicle; ##P < 0.01, and ###P < 0.001 for DSS + BAH or DSS + DMOG vs DSS + vehicle.
Fig. 7
Fig. 7. BAH treatment normalized the expression of genes associated with fibrosis in the DSS model.
a RNA from colon tissue was used to determine the expression of genes involved in fibrosis by PCR array. Heat maps showed the significantly upregulated (green) or downregulated (red) genes in DSS + vehicle, DSS + BAH or DSS + DMOG compared with control + vehicle. b The mRNA expression of fibrosis-related genes (Col1a2, Col3a1, Timp-1, and Tnc) was quantified by qPCR and normalized to levels of Gapdh. Data represent the mean ± SEM, and significance was determined by one-way ANOVA followed by Tukey’s post hoc test. **P < 0.01, and ***P < 0.001 for DSS + vehicle vs control + vehicle; #P < 0.05, ##P < 0.01, and ###P < 0.001 for DSS + BAH or DSS + DMOG vs DSS + vehicle.
Fig. 8
Fig. 8. BAH prevents colon fibrosis in the DSS model.
a Representative confocal microscopy images of smooth muscle cells (α-SMA, green fluorescence) in colon sections and their quantification. b Immunofluorescence labeling of TNC (green fluorescence) in the control, DSS + vehicle, DSS + DMOG and DSS + BAH groups is shown. c Representative images of Picrosirius Red/Fast Green staining (left panel). Comparison of the collagen content among the experimental groups (right panel). The original magnification of all images is ×20. The quantification is shown as the mean ± SEM (n = 6–8 animals per group), and significance was determined by one-way ANOVA followed by Tukey’s post hoc test. ***P < 0.001 for DSS + vehicle vs control + vehicle; #P < 0.05, ##P < 0.01, and ###P < 0.001 for DSS + BAH or DSS + DMOG vs DSS + vehicle.
Fig. 9
Fig. 9. BAH exerts its functions systemically but not intrarectally.
a BAH improved the histological score and collagen content when administered by oral gavage but not when administered rectally (original magnification ×20). The quantification is shown as the mean ± SEM (n = 6–8 animals per group), and significance was determined by one-way ANOVA followed by Tukey’s post hoc test. ***P < 0.001 for DSS + vehicle vs control + vehicle; ##P < 0.01, and ###P < 0.001 for DSS + BAH or DSS + DMOG vs DSS + vehicle. b Mean plasma concentration-time profile and main pharmacokinetic parameters (c) of BAH after PO (20 mg/kg) and IV (2 mg/kg) administration in mice. The results are expressed as the mean ± SD (n = 3 animals per group). d BAH treatment normalized the expression of Hif-1α protein in colon during TNBS insult (original magnification ×20). Data represent the mean ± SEM, and significance was determined by one-way ANOVA followed by the Tukeyʼs post-hoc test. Results are expressed as mean ± SEM (n = 4 animals per group). ***P < 0.001 TNBS + Vehicle vs Control + Vehicle; ###P < 0.001 TNBS + BAH vs TNBS + Vehicle.

References

    1. Liverani E, Scaioli E, Digby RJ, Bellanova M, Belluzzi A. How to predict clinical relapse in inflammatory bowel disease patients. World J Gastroenterol. 2016;22:1017–33. - PMC - PubMed
    1. Rieder F, Fiocchi C, Rogler G. Mechanisms, management, and treatment of fibrosis in patients with inflammatory bowel diseases. Gastroenterology. 2017;152:340–50 e346. - PMC - PubMed
    1. Koutroubakis IE, Ramos-Rivers C, Regueiro M, Koutroumpakis E, Click B, Schoen RE, et al. Persistent or recurrent anemia is associated with severe and disabling inflammatory bowel disease. Clin Gastroenterol Hepatol. 2015;13:1760–6. - PMC - PubMed
    1. Lawrance IC, Maxwell L, Doe W. Inflammation location, but not type, determines the increase in TGF-beta1 and IGF-1 expression and collagen deposition in IBD intestine. Inflamm Bowel Dis. 2001;7:16–26. - PubMed
    1. Silverstein MD, Loftus EV, Sandborn WJ, Tremaine WJ, Feagan BG, Nietert PJ, et al. Clinical course and costs of care for Crohn’s disease: Markov model analysis of a population-based cohort. Gastroenterology. 1999;117:49–57. - PubMed

MeSH terms