

The influence of internal models on feedback-related brain activity
- PMID: 32812148
- PMCID: PMC7497542
- DOI: 10.3758/s13415-020-00820-6
The influence of internal models on feedback-related brain activity
Abstract
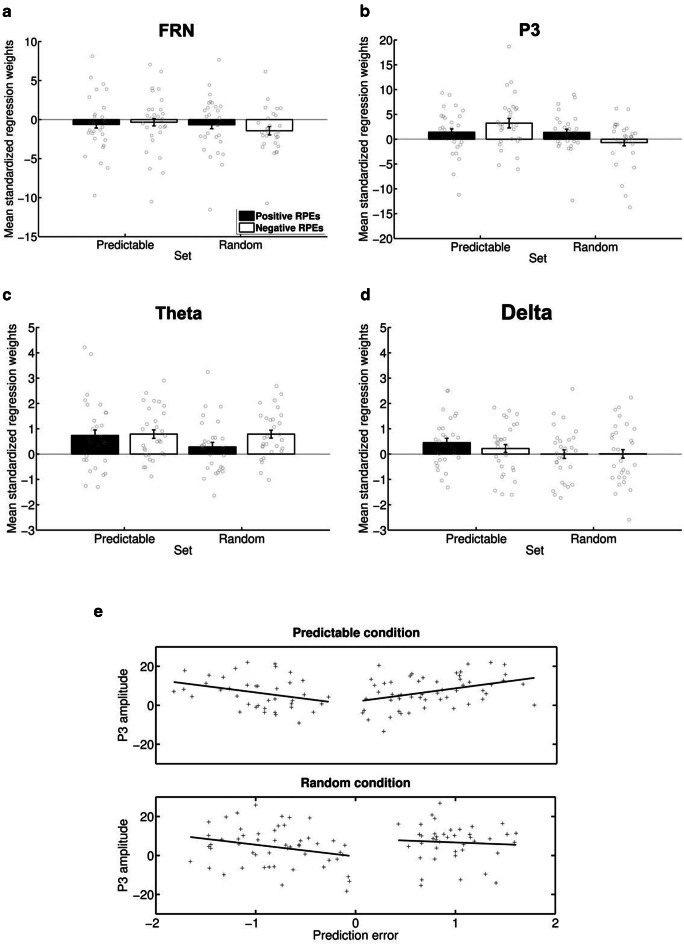
Decision making relies on the interplay between two distinct learning mechanisms, namely habitual model-free learning and goal-directed model-based learning. Recent literature suggests that this interplay is significantly shaped by the environmental structure as represented by an internal model. We employed a modified two-stage but one-decision Markov decision task to investigate how two internal models differing in the predictability of stage transitions influence the neural correlates of feedback processing. Our results demonstrate that fronto-central theta and the feedback-related negativity (FRN), two correlates of reward prediction errors in the medial frontal cortex, are independent of the internal representations of the environmental structure. In contrast, centro-parietal delta and the P3, two correlates possibly reflecting feedback evaluation in working memory, were highly susceptible to the underlying internal model. Model-based analyses of single-trial activity showed a comparable pattern, indicating that while the computation of unsigned reward prediction errors is represented by theta and the FRN irrespective of the internal models, the P3 adapts to the internal representation of an environment. Our findings further substantiate the assumption that the feedback-locked components under investigation reflect distinct mechanisms of feedback processing and that different internal models selectively influence these mechanisms.
Keywords: Event-related potentials; Feedback processing; Model-based learning; Model-free learning; Reinforcement learning; Time-frequency analysis.
Figures


Similar articles
-
Stress effects on learning and feedback-related neural activity depend on feedback delay.Psychophysiology. 2020 Feb;57(2):e13471. doi: 10.1111/psyp.13471. Epub 2019 Sep 3. Psychophysiology. 2020. PMID: 31976590
-
Time-frequency theta and delta measures index separable components of feedback processing in a gambling task.Psychophysiology. 2015 May;52(5):626-37. doi: 10.1111/psyp.12390. Epub 2015 Jan 12. Psychophysiology. 2015. PMID: 25581491 Free PMC article.
-
When the outcome is different than expected: Subjective expectancy shapes reward prediction error at the FRN level.Psychophysiology. 2019 Dec;56(12):e13456. doi: 10.1111/psyp.13456. Epub 2019 Aug 12. Psychophysiology. 2019. PMID: 31403188
-
Learning from experience: event-related potential correlates of reward processing, neural adaptation, and behavioral choice.Neurosci Biobehav Rev. 2012 Sep;36(8):1870-84. doi: 10.1016/j.neubiorev.2012.05.008. Epub 2012 Jun 7. Neurosci Biobehav Rev. 2012. PMID: 22683741 Free PMC article. Review.
-
Beyond the FRN: Broadening the time-course of EEG and ERP components implicated in reward processing.Int J Psychophysiol. 2018 Oct;132(Pt B):184-202. doi: 10.1016/j.ijpsycho.2018.02.002. Epub 2018 Feb 15. Int J Psychophysiol. 2018. PMID: 29454641 Review.
Cited by
-
The potential application of event-related potentials to enhance research on reward processes in eating disorders.Int J Eat Disord. 2022 Nov;55(11):1484-1495. doi: 10.1002/eat.23821. Epub 2022 Oct 10. Int J Eat Disord. 2022. PMID: 36214253 Free PMC article. Review.
-
What is left after an error? Towards a comprehensive account of goal-based binding and retrieval.Atten Percept Psychophys. 2023 Jan;85(1):120-139. doi: 10.3758/s13414-022-02609-w. Epub 2022 Nov 30. Atten Percept Psychophys. 2023. PMID: 36451075 Free PMC article.
-
The impact of emotional feedback in learning easy and difficult tasks - an ERP study.Cogn Affect Behav Neurosci. 2025 Aug;25(4):971-988. doi: 10.3758/s13415-025-01284-2. Epub 2025 Mar 27. Cogn Affect Behav Neurosci. 2025. PMID: 40148734 Free PMC article.
-
The Hippocampus in Pigeons Contributes to the Model-Based Valuation and the Relationship between Temporal Context States.Animals (Basel). 2024 Jan 29;14(3):431. doi: 10.3390/ani14030431. Animals (Basel). 2024. PMID: 38338074 Free PMC article.
-
Global neural encoding of behavioral strategies in mice during perceptual decision-making task with two different sensory patterns.iScience. 2024 Oct 16;27(11):111182. doi: 10.1016/j.isci.2024.111182. eCollection 2024 Nov 15. iScience. 2024. PMID: 39524342 Free PMC article.
References
-
- Bellman R. Functional Equations in the Theory of Dynamic Programming--VII. A Partial Differential Equation for the Fredholm Resolvent. Proceedings of the American Mathematical Society. 1957;8(3):435. doi: 10.2307/2033490. - DOI
MeSH terms
LinkOut - more resources
Full Text Sources
