Review
. 2020 Aug;8(16):e14533.
doi: 10.14814/phy2.14533.

Spatiotemporal transformations for gaze control

Affiliations
Review

Spatiotemporal transformations for gaze control

Amirsaman Sajad et al. Physiol Rep. 2020 Aug.

Abstract

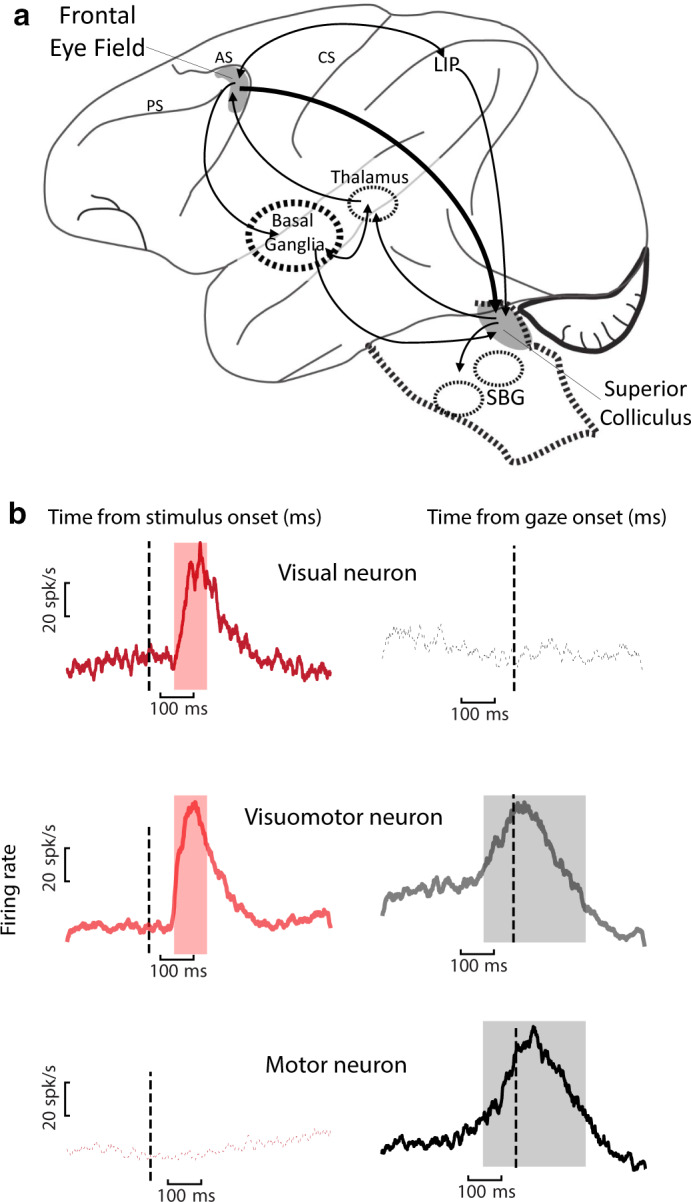
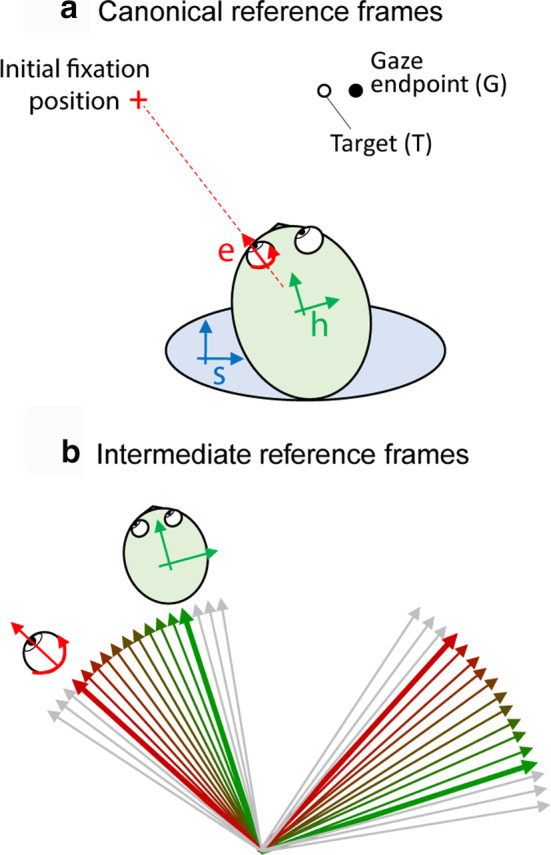
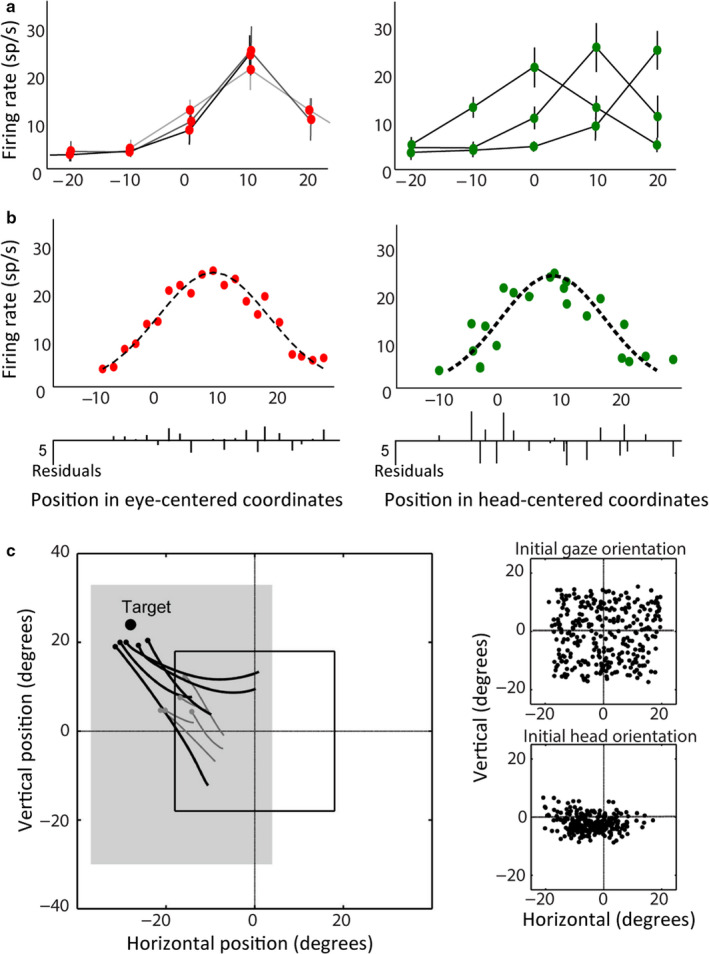
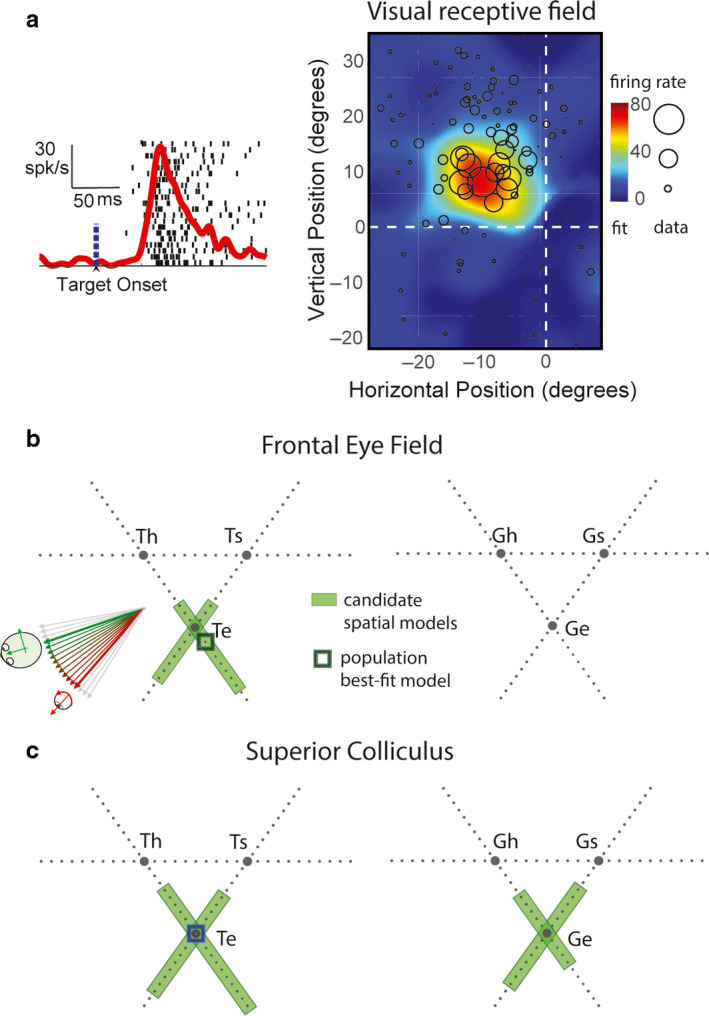
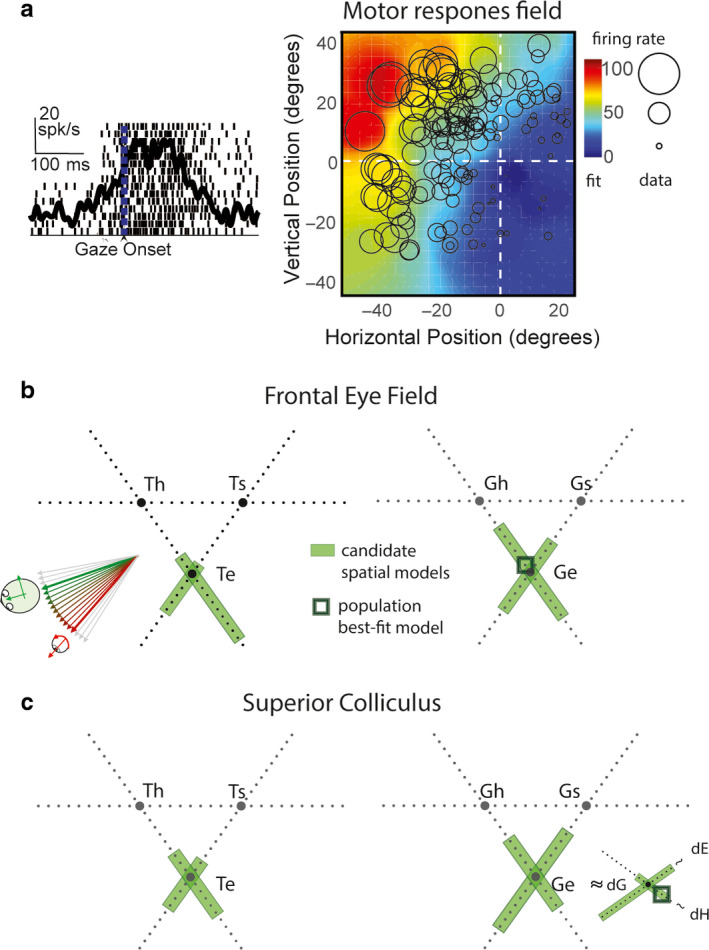
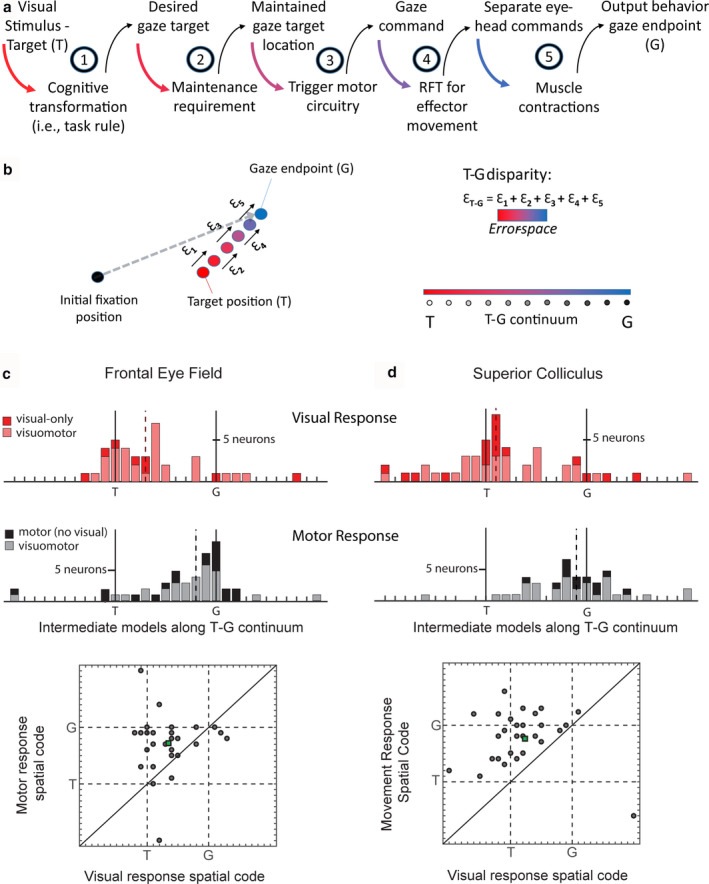
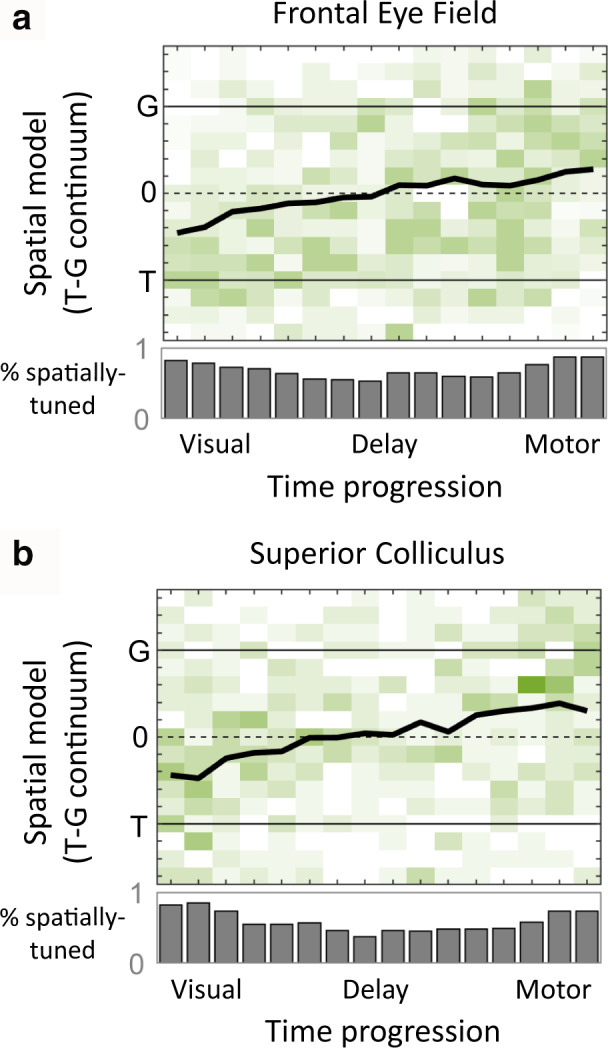
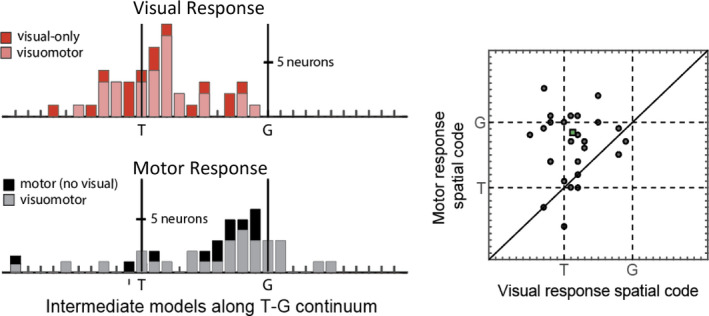
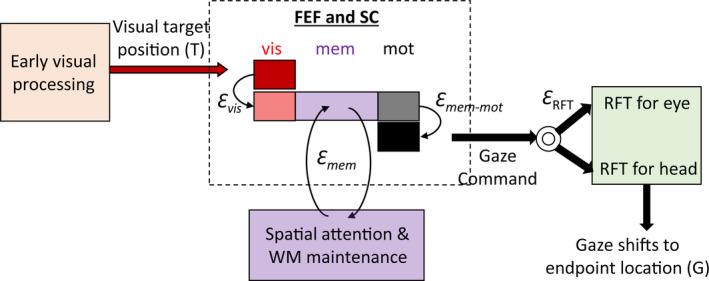
Sensorimotor transformations require spatiotemporal coordination of signals, that is, through both time and space. For example, the gaze control system employs signals that are time-locked to various sensorimotor events, but the spatial content of these signals is difficult to assess during ordinary gaze shifts. In this review, we describe the various models and methods that have been devised to test this question, and their limitations. We then describe a new method that can (a) simultaneously test between all of these models during natural, head-unrestrained conditions, and (b) track the evolving spatial continuum from target (T) to future gaze coding (G, including errors) through time. We then summarize some applications of this technique, comparing spatiotemporal coding in the primate frontal eye field (FEF) and superior colliculus (SC). The results confirm that these areas preferentially encode eye-centered, effector-independent parameters, and show-for the first time in ordinary gaze shifts-a spatial transformation between visual and motor responses from T to G coding. We introduce a new set of spatial models (T-G continuum) that revealed task-dependent timing of this transformation: progressive during a memory delay between vision and action, and almost immediate without such a delay. We synthesize the results from our studies and supplement it with previous knowledge of anatomy and physiology to propose a conceptual model where cumulative transformation noise is realized as inaccuracies in gaze behavior. We conclude that the spatiotemporal transformation for gaze is both local (observed within and across neurons in a given area) and distributed (with common signals shared across remote but interconnected structures).


Conflict of interest statement

The authors report no conflict of interest.

Figures

FIGURE 1
FIGURE 1
Schematic of key areas in dorsal visual pathway and representative visuomotor signals. (a) FEF and SC (shaded in gray) are shown in relation to interconnected structures. AC: arcuate sulcus, PC: Principal sulcus, CS: Central sulcus, SBG: Saccade Burst Generator. (b) Target‐ and gaze movement‐ aligned population responses of three general classes of neurons: Visual, Visuomotor, and Motor neurons in FEF (data from Sajad et al., 2015). Similar response profiles observed in SC (Sadeh et al., 2015). For the results reviewed in this manuscript, FEF and SC visual responses were sampled from 80 to 180 ms (pink shade) and 60 to 160 ms (not shown) following target presentation, respectively. FEF and SC motor responses included the bulk of the motor burst for each neuron (gray shade indicates mean FEF motor response). For SC, this window was fixed from −50 to +50 ms from gaze onset (not shown)
FIGURE 2
FIGURE 2
Spatial models in gaze control. (a) The location of the peripheral visual target (T) and the eventual location of the gaze shift (G) relative to egocentric reference eye (e), head (h), and body/space (s) reference frames at the time of fixation on the red cross. The spatial difference between T and G reflects inaccuracy in gaze behavior. (b) Intermediate eye‐head reference frames obtained by the linear combination of eye‐reference frame (red) and head‐reference frame (green) ranging from a more eye‐centered frame to a more head‐centered frame (color shade). Adapted from Sajad et al., (2015)
FIGURE 3
FIGURE 3
Classic and new methods of neural reference frame analysis for gaze control. (a) Response field plots obtained using the traditional approach to identify reference frames for an example neuron (e.g. Cohen & Andersen, 2002). Many trials are sampled while the head faces the front and the eye initial orientation varies between discrete positions. The shift in response field based on varying initial positions is assessed. The profile of the response field is conserved when plotted relative to the initial position of the eye (left), but shifts when plotted based on the initial position of the head (right), hence eye‐centered. (b) Response field plots reduced to one‐dimension, illustrating the logic for the statistical modeling method developed by Keith et al., (2009). Response fields were plotted by placing firing rate data over positions in space as defined by the tested model and the quality of the fit was assessed by measuring PRESS residuals obtained from a “remove one–fit–replace” approach (bottom panel shows residuals for all data points to a single fit). The response field is more spatially organized when plotted relative to initial eye orientation (left) compared to initial head orientation (right) as the data points (dots) fall closer to the nonparametric fit (dashed line, here looks Gaussian), hence eye‐centered. (c) In head‐unrestrained conditions, the dissociation of spatial parameters in gaze behavior were achieved by variability in eye‐head behavior. Gaze (black) and head (gray) movement trajectories to a single target (large circle) for five trials in the memory‐guided gaze task are shown (left panel). Gaze and head endpoint positions (small circles) fall at variable positions for the same target. Initial gaze position was randomly varied within a central square (black square) to increase variability in starting gaze orientation (upper‐right panel) and head orientation (lower‐right panel). This variability allowed for a differentiation between eye‐, head‐, and space‐ (or body) frames of reference. Adapted from Sajad et al. (2015)
FIGURE 4
FIGURE 4
Spatial analysis of visual receptive fields in FEF and SC. (a) Raster and spike density function aligned on target onset (left) and the visual receptive field plot (right) of a representative visual response in FEF. Circles (radius: firing rate) represent data points for response field mapping. Activity was sampled from the 80–180 ms after target presentation (Figure 1b). Color‐map represents the nonparametric fit to the data. (b) Triangular plots represent intermediate models constructed from three pairs of canonical models: eye (e), head (h), and body/space (s) frames based on target location (left) and gaze endpoint (right). The continua between eye and head intermediate frames (Te‐Th, and Ge‐Gh) are also shown in Figure 2b. Green shade indicates intermediate spatial models that are not significantly eliminated. Black square indicates the population best‐fit model. (c) Similar conventions as (b) for superior colliculus. Green shades in (b) and (c) cluster around eye‐centered T (Te) and G (Ge) models. The population best‐fit (dark green square) was at intermediate spatial model at or close to Te for both FEF and SC. Adapted from Sajad et al., (2015) and Sadeh et al., (2015)
FIGURE 5
FIGURE 5
Spatial analysis of motor response fields in FEF and SC. (a) Raster and spike density function aligned on gaze onset (left) and the motor response field plot (right) of a representative FEF motor response. Similar conventions as Figure 4a. (b and c) Spatial analysis of motor response fields of FEF (b) and SC (c) neurons. Similar conventions as Figure 4b,c are used. Motor response was sampled from the entire motor response (Figure 1b). Notice that noneliminated intermediate models (green shades) cluster around eye‐centered T (Te) and G (Ge) models. The population best‐fit for FEF motor activity was an intermediate spatial model close to Ge, and for SC motor activity was an intermediate model close to dG (gaze displacement), which is geometrically very similar to Ge. Adapted from Sajad et al., (2015) and Sadeh et al., (2015)
FIGURE 6
FIGURE 6
Visuomotor transformations in FEF and SC between visual and motor responses in memory‐guided gaze task. (a) Breakdown of stages in the transformation from target sensory information to output gaze behavior. (b) Red dot: location of the visual target (T); Each process can incrementally add to inaccuracies in spatial representation of target (Ɛ1‐5) resulting in inaccuracy in gaze behavior (gray dotted arrow: gaze vector; blue dot: gaze endpoint). We constructed the T‐G continuum by dividing the error‐space (i.e., T‐G disparity) into equal intervals. This allowed us to explicitly test whether neural activity prefers intermediary positions along this error‐space. Distribution of best‐fit model along the T‐G continuum for visually responsive neurons (c and d top panels) and motor‐responsive neurons (c and d, middle panels). FEF and SC visual responses were sampled as indicated in Figure 1b. Note: visuomotor neurons (pink, c and d top, and gray, c and d bottom) appear on both upper and lower panels. Scatter plots show the best‐fit model distribution of motor response (y‐axis) versus visual response (x‐axis) for individual Visuomotor neurons. Deviation from line of unity indicates change in spatial code along T‐G continuum between visual and motor response in Visuomotor neurons. Adapted from Sajad et al., (2015) and Sadeh et al., (2015)
FIGURE 7
FIGURE 7
Temporal progression of spatial code during visual‐memory‐motor periods of the memory‐guided task. (a) The time course of T‐to‐G transition across all neurons in the FEF is shown for time intervals spanning visual response onset until saccade time. Green shades represent the best‐fit model for individual neurons. Black traces represent population mean of the best‐fit distribution. Gray histograms indicate the percentage of spatially tuned neurons at each time step. Adapted from Sajad et al., (2016). (b) Same analysis on SC neuronal responses
FIGURE 8
FIGURE 8
Visuomotor transformations between SC visual and motor response during visually guided (reactive) gaze task. Similar conventions as Figure 6d. Visual response was sampled from 60 to 160 ms relative to target onset, and motor response from −50 to +50 ms relative to gaze onset. Adapted from Sadeh et al., (2020)
FIGURE 9
FIGURE 9
Conceptual model explaining visuomotor transformations in FEF and SC. A schematic of FEF and SC temporal responses during visual, memory, and motor periods (enclosed in dashed box) and relationship with different visuomotor processing stages are shown. Visual neurons (red) encoded the accurate target position in eye coordinates (T). These neurons receive projections from early visual processing areas. Visuomotor neurons (pink) encoded positions that fell close to T but drawn toward the direction that predicted gaze endpoint in eye‐centered coordinates (G). This visual response likely reflects a stage of visual processing which maps, through a noisy gate, visual information into a priority map of movement goals resulting in the accumulation of errors in behavior (Ɛ vis). This position is maintained through recurrent connections between frontal and parietal areas (purple box), which also send projections to FEF and SC. This memory maintenance is susceptible to noise (Ɛ mem), resulting in the diffusion of the attention spotlight (or memorized location). After the GO signal, the most recent memory of the target location is transferred, via a noisy output gate, to the motor circuitry, resulting in additional accumulation of noise (Ɛ mem‐mot). The motor neurons in FEF and SC send this gaze command to downstream structures, where additional processing for the coordination of effectors and appropriate reference frame transformations (RFT) take place. Adapted from Sajad et al., (2015, 2016)

References

    1. Alikhanian, H. , Carvalho, S. R. D. , & Blohm, G. (2015). Quantifying effects of stochasticity in reference frame transformations on posterior distributions. Frontiers in Computational Neuroscience, 9, 82 10.3389/fncom.2015.00082 - DOI - PMC - PubMed
    1. Andersen, R. A. , Snyder, L. H. , Li, C. S. , & Stricanne, B. (1993). Coordinate transformations in the representation of spatial information. Current Opinion in Neurobiology, 3(2), 171–176. 10.1016/0959-4388(93)90206-E - DOI - PubMed
    1. Andersen, R. A. , & Zipser, D. (1988). The role of the posterior parietal cortex in coordinate transformations for visual–motor integration. Canadian Journal of Physiology and Pharmacology, 66(4), 488–501. 10.1139/y88-078 - DOI - PubMed
    1. Arieli, A. , Sterkin, A. , Grinvald, A. , & Aertsen, A. D. (1996). Dynamics of ongoing activity: Explanation of the large variability in evoked cortical responses. Science, 273(5283), 1868–1871. 10.1126/science.273.5283.1868 - DOI - PubMed
    1. Arora, H. K. , Bharmauria, V. , Yan, X. , Sun, S. , Wang, H. , & Crawford, J. D. (2019). Eye‐head‐hand coordination during visually guided reaches in head‐unrestrained macaques. Journal of Neurophysiology, 122(5), 1946–1961. 10.1152/jn.00072.2019 - DOI - PMC - PubMed

Publication types

Grants and funding

LinkOut - more resources