Perception of One's Own Voice After Hearing-Aid Fitting for Naive Hearing-Aid Users and Hearing-Aid Refitting for Experienced Hearing-Aid Users
- PMID: 32812519
- PMCID: PMC7887686
- DOI: 10.1177/2331216520932467
Perception of One's Own Voice After Hearing-Aid Fitting for Naive Hearing-Aid Users and Hearing-Aid Refitting for Experienced Hearing-Aid Users
Abstract
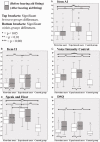
Dissatisfaction with the sound of one's own voice is common among hearing-aid users. Little is known regarding how hearing impairment and hearing aids separately affect own-voice perception. This study examined own-voice perception and associated issues before and after a hearing-aid fitting for new hearing-aid users and refitting for experienced users to investigate whether it was possible to differentiate between the effect of (unaided) hearing impairment and hearing aids. Further aims were to investigate whether First-Time and Experienced users as well as users with dome and mold inserts differed in the severity of own-voice problems. The study had a cohort design with three groups: First-Time hearing-aid users going from unaided to aided hearing (n = 70), Experienced hearing-aid users replacing their old hearing aids (n = 70), and an unaided control group (n = 70). The control group was surveyed once and the hearing-aid users twice; once before hearing-aid fitting/refitting and once after. The results demonstrated that own-voice problems are common among both First-Time and Experienced hearing-aid users with either dome- or mold-type fittings, while people with near-normal hearing and not using hearing aids report few problems. Hearing aids increased ratings of own-voice problems among First-Time users, particularly those with mold inserts. The results suggest that altered auditory feedback through unaided hearing impairment or through hearing aids is likely both to change own-voice perception and complicate regulation of vocal intensity, but hearing aids are the primary reason for poor perceived sound quality of one's own voice.
Keywords: auditory perception; hearing aids; hearing impairment; voice; voice quality.
Conflict of interest statement
Figures


References
-
- Békésy G. (1949). The structure of the middle ear and the hearing of one’s own voice by bone conduction. Journal of the Acoustical Society of America, 21, 217–232.
-
- Coelho A. C., Medved D. M., Brasolotto A. G. (2015). Hearing loss and the voice. In Bahmad F., Jr. (Ed.), An update on hearing loss (pp. 103–128). IntechOpen. 10.5772/61217 - DOI
-
- Dillon H. (2001). Hearing aids. Thieme.
Publication types
MeSH terms
LinkOut - more resources
Full Text Sources
Medical

