. 2020 Aug 19:9:e58362.
doi: 10.7554/eLife.58362.

Structural basis of mitochondrial translation

Affiliations

Structural basis of mitochondrial translation

Shintaro Aibara et al. Elife. .

Abstract

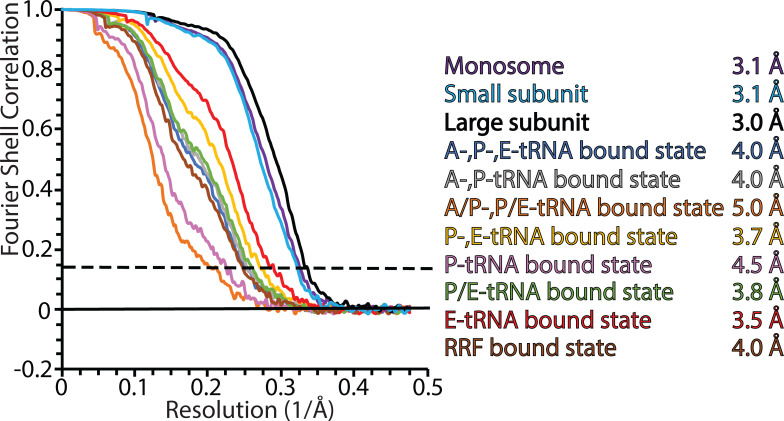
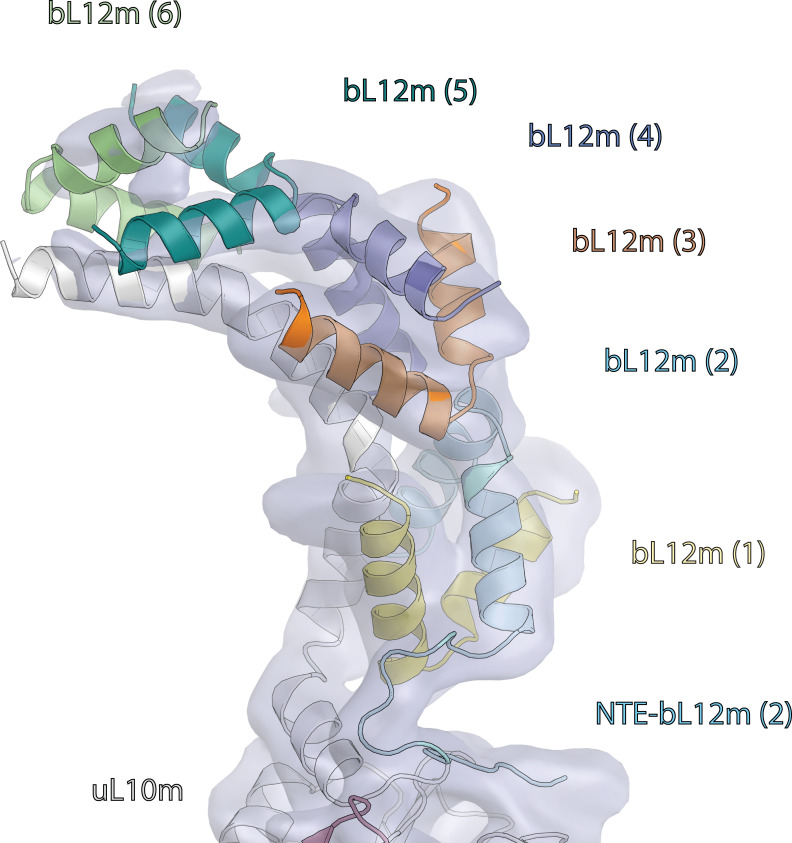
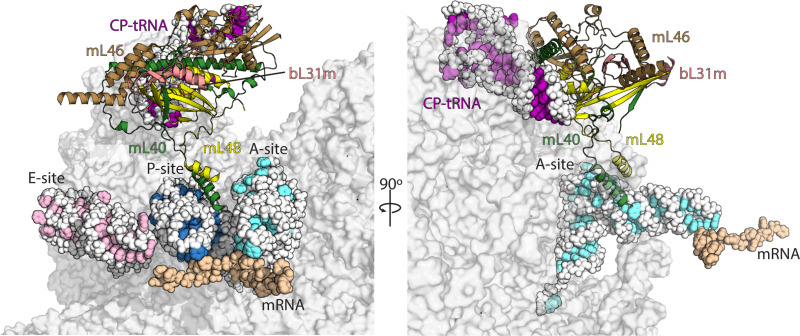
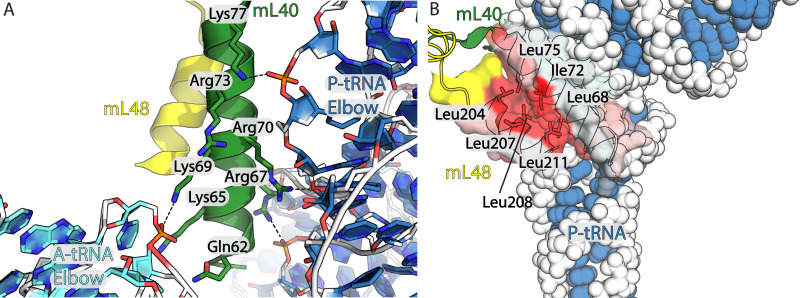
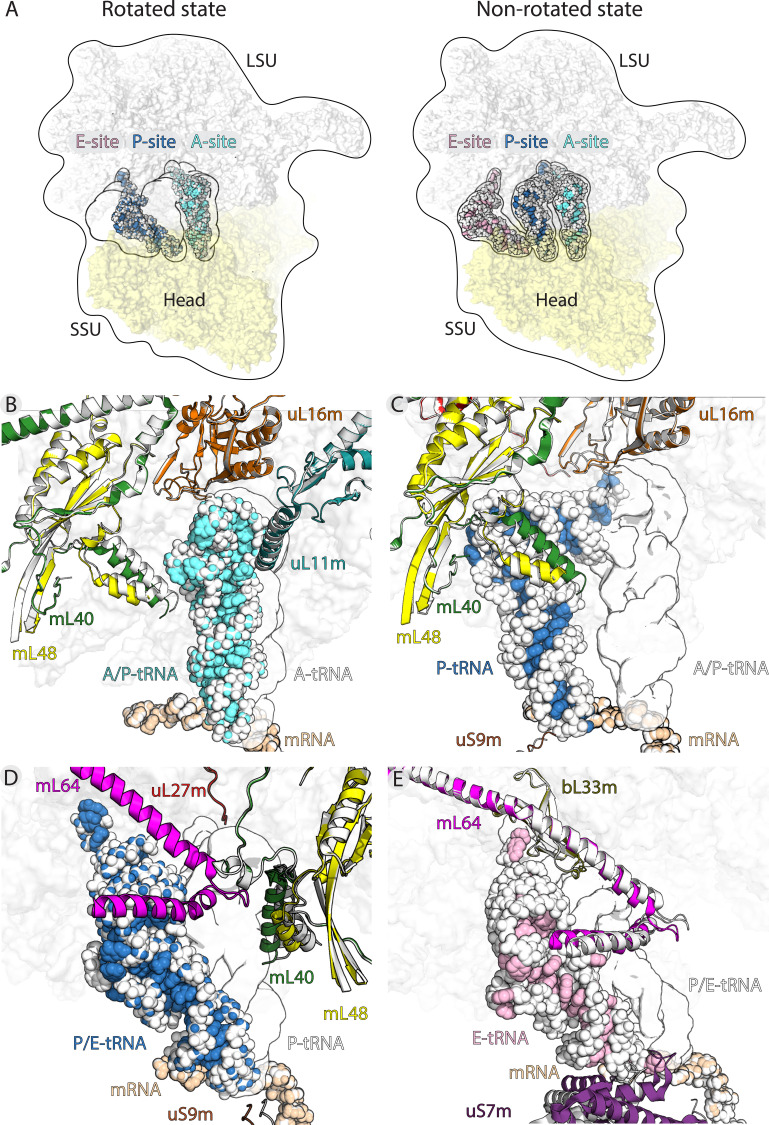
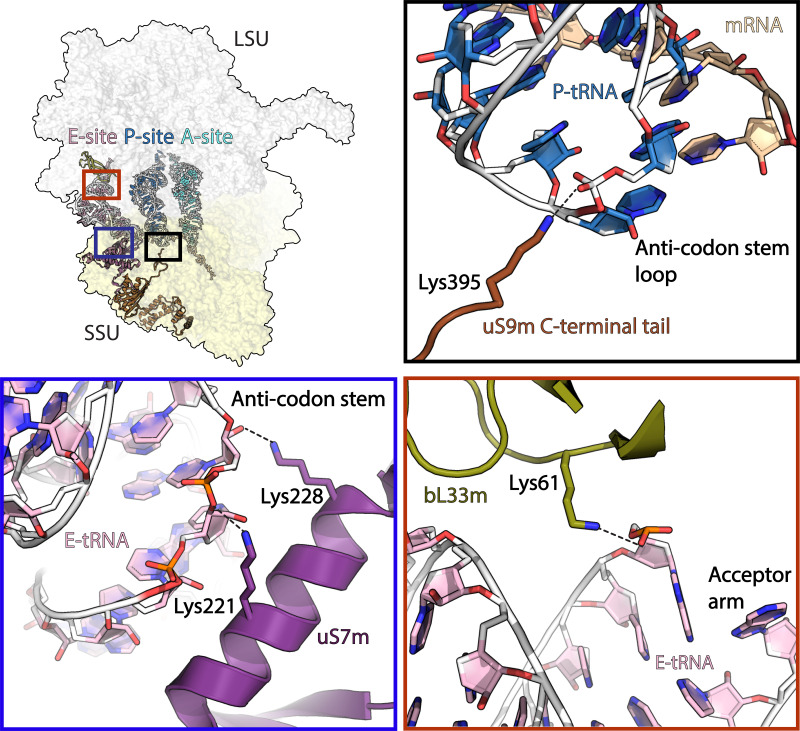
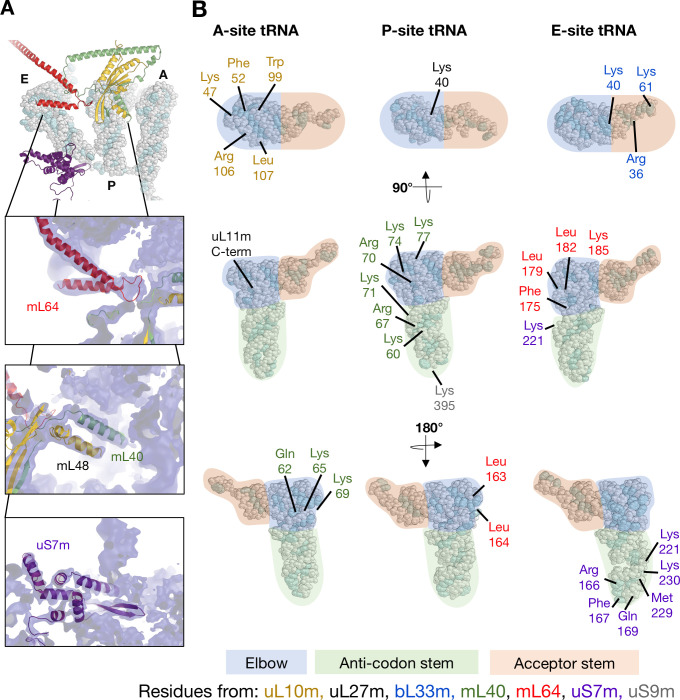
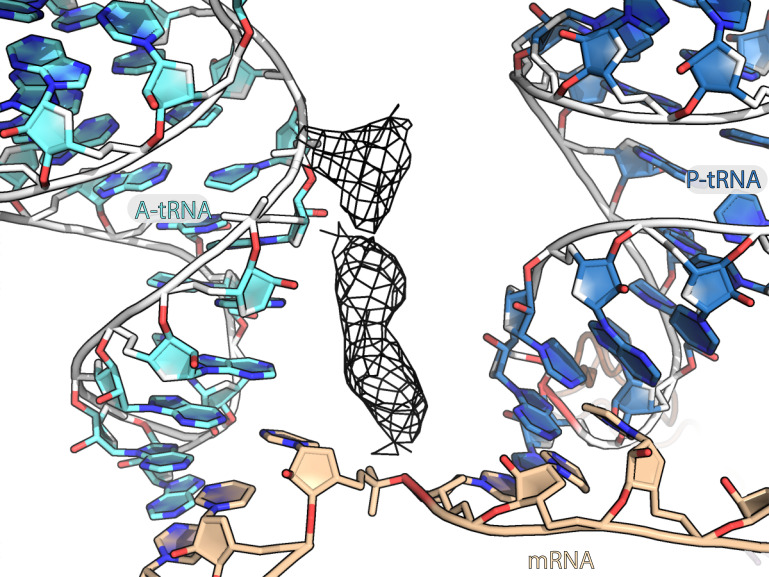
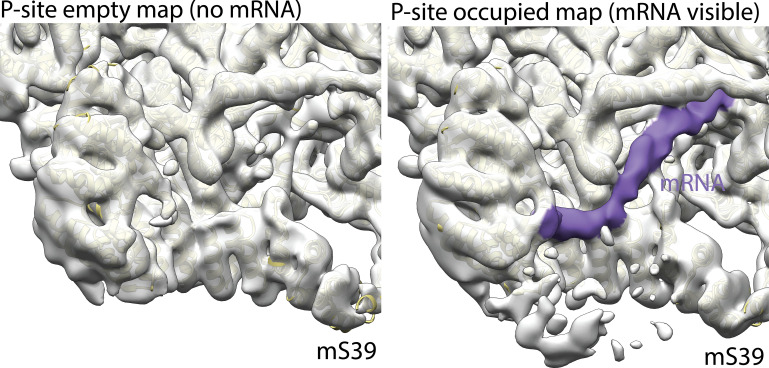
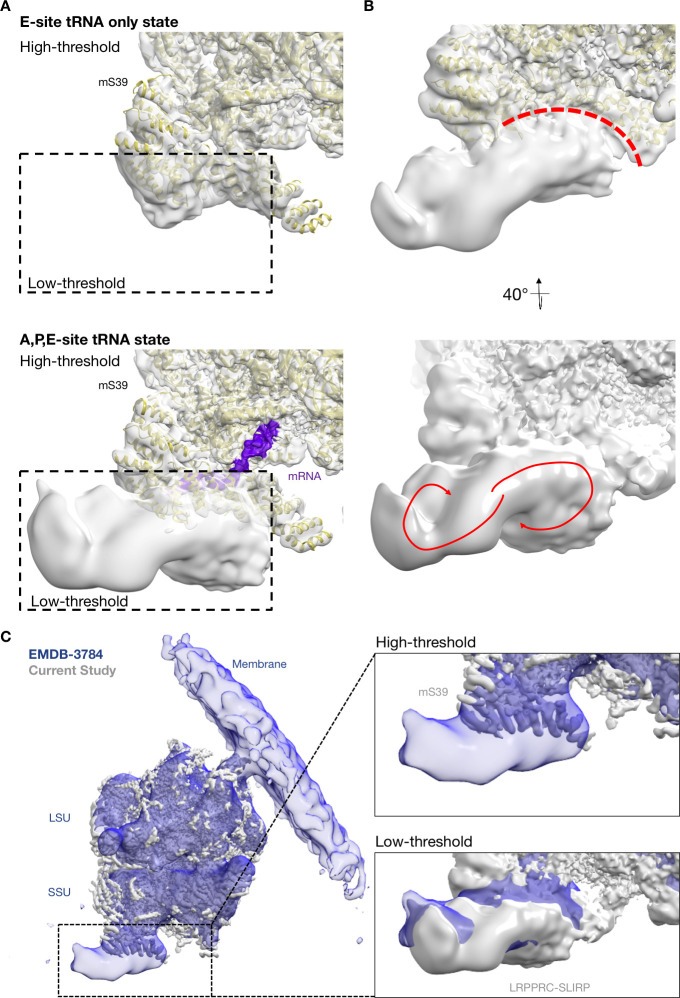
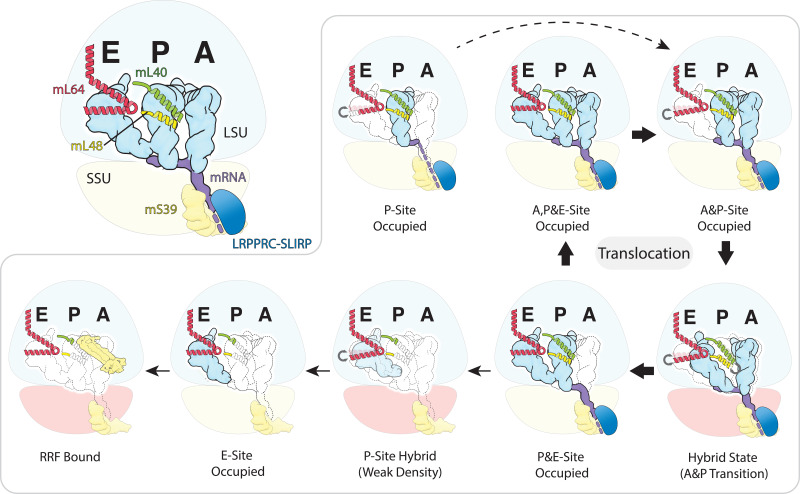
Translation of mitochondrial messenger RNA (mt-mRNA) is performed by distinct mitoribosomes comprising at least 36 mitochondria-specific proteins. How these mitoribosomal proteins assist in the binding of mt-mRNA and to what extent they are involved in the translocation of transfer RNA (mt-tRNA) is unclear. To visualize the process of translation in human mitochondria, we report ~3.0 Å resolution structure of the human mitoribosome, including the L7/L12 stalk, and eight structures of its functional complexes with mt-mRNA, mt-tRNAs, recycling factor and additional trans factors. The study reveals a transacting protein module LRPPRC-SLIRP that delivers mt-mRNA to the mitoribosomal small subunit through a dedicated platform formed by the mitochondria-specific protein mS39. Mitoribosomal proteins of the large subunit mL40, mL48, and mL64 coordinate translocation of mt-tRNA. The comparison between those structures shows dynamic interactions between the mitoribosome and its ligands, suggesting a sequential mechanism of conformational changes.

Keywords: RNA; cryo-EM; gene expression; human; mitochondria; molecular biophysics; ribosome; structural biology; translation.


Conflict of interest statement

SA, VS, AM, AA No competing interests declared

Figures

Figure 1.
Figure 1.. Structure of human mitoribosome and modeled L7/L12 stalk.
(A) Overview of the human mitoribosome model. The mitoribosomal proteins are shown in cartoon with transparent surface, rRNA is shown as spheres. Zoomed in regions are indicated. (B) View of the improved model of the N-terminal mitochondrial extension of bL12m (cyan) and its contacts with mL53 (magenta) and uL10m (grey). The protein uL10m is shown with transparent surface colored by hydrophobicity, with red indicating most hydrophobic, revealing a hydrophobic patch involved in bL12m binding. (C) The modeled loop of mL54 (wheat) forms hydrophobic interface with uL11m (grey with transparent surface colored by hydrophobicity). These interactions between mitochondria-specific elements contribute to the stability of the stalk.
Figure 1—figure supplement 1.
Figure 1—figure supplement 1.. Cryo-EM data processing.
2D and 3D classes of the mitoribosome represent a variety of orientations. The classification strategy for separating different states is shown, which resulted in eight classes (tRNA blue, mtRRF yellow, involved mitoribosomal elements indicated). For the purposes of clarity, the inset showing the tRNAs have been filtered to 7 Å resolution.
Figure 1—figure supplement 2.
Figure 1—figure supplement 2.. Fourier shell correlation (FSC) curves for mitoribosomal complexes.
FSC plots for the consensus map of the monosome; masked refined maps of the large and small subunits; 8 maps of different states. Resolution is estimated based on the 0.143 FSC cut-off criterion (dashed line).
Figure 1—figure supplement 3.
Figure 1—figure supplement 3.. Map and model of human mitoribosome L7/L12 stalk.
Map and model of six copies of bL12m-N-terminal domains bound to uL10m C-terminal α-helix (light grey).
Figure 1—figure supplement 4.
Figure 1—figure supplement 4.. Map and model human mitoribosome mL54.
Comparison of maps and corresponding models of mL54 (wheat) in our human mitoribosome structure and porcine mitochondrial initiation complex (PDBID: 6GAW). Equivalent residues are shown in both structures for comparison.
Figure 1—figure supplement 5.
Figure 1—figure supplement 5.. Map and model human mt-RRF.
(A) Model and density of mt-RRF (purple) bound to the A- and P-sites on human mitoribosome. (B) mt-RRF modeled in this work is superposed with RRF from E. coli (PDBID: 1EK8) and S. oleracea (PDBID: 6ERI). (C) Comparison of mitochondria-specific N-terminal extension of mt-RRF modeled in our human mitoribosome-mt-RRF complex and the human mitoribosome-mt-RRF complex (blue) (PDBID: 6NU2) published previously.
Figure 2.
Figure 2.. Interactions of mL40-mL48 in the tRNA binding sites and the central protuberance.
Views of the tRNA binding sites of human mitoribosome showing interactions of mL40 (green) and mL48 (yellow) with A-tRNA (white/aquamarine) and P-tRNA (white/blue). In the central protuberance, mL40 and mL48 interact with mL46 (brown), bL31m (salmon) and CP-tRNA (white/pink). In the right panel, P- and E-tRNA are removed for clarity.
Figure 2—figure supplement 1.
Figure 2—figure supplement 1.. Topology and interactions of mL40 and mL48 in the central protuberance and with tRNAs.
Topology diagrams for the structural domains of mL40 (green) and mL48 (yellow). β strands from mL40, mL48 and bL31m form β-sheet in the central protuberance. CP-tRNA is involved in extensive interactions with mL40 and mL48. N-terminus of mL40 extends to the A- and P-tRNA binding site.
Figure 2—figure supplement 2.
Figure 2—figure supplement 2.. Hydrophobic interface between mL40 and mL48 involved in tRNA interactions.
(A) Interactions of mL40 N-terminal helix (green) with A-tRNA (cyan) and P- tRNA (blue). (B) Hydrophobic interface between mL40 N-terminal helix and mL48 C-terminal helix (yellow) displayed in transparent surface colored by hydrophobicity, red indicting most hydrophobic.
Figure 3.
Figure 3.. Translocation of mt-tRNA and involvement of mitoribosomal proteins.
(A) Overview of tRNAs bound to the A-, P- and E-site in the rotated and non-rotated mitoribosome. The models were superimposed using the mt-LSU as a reference The classical tRNA binding sites are outlined. (B) Comparison between mt-tRNA in the A-site (outlined) and A/P state (light blue/white). (C) Comparison between mt-tRNA in the A/P state (outlined) and P-site (blue/white). (D) Comparison between mt-tRNA in the P-site (outlined) and P/E state (blue/white). (E) Comparison between mt-tRNA in the P/E state (outlined) and E-site (pink/white).
Figure 3—figure supplement 1.
Figure 3—figure supplement 1.. Interactions of mitoribosomal proteins with tRNAs.
uS9m C-terminal tail (brown) interacts with P-site tRNA (blue/white) anticodon stem loop. uS7m (violet) approaches the major groove of E-site tRNA (pink/white) anticodon stem. bL33m (olive) interacts with E-site tRNA acceptor arm. Dashed line represents distances below 4 Å.
Figure 3—figure supplement 2.
Figure 3—figure supplement 2.. Interactions between mitoribosomal proteins and tRNA.
(A) Cryo-EM density for the APE occupied state, focusing on proteinacious elements involved tRNA interactions. Front top: mL64, P-site fingers (mL40 and mL48), and uS7m. (B) Schematic representation of proteins involved in tRNA interactions. As the structure obtained in this study represents an average of multiple tRNAs, the sections are represented as areas of elbow (blue), anti-codon stem (green), and acceptor stem (orange). Residues numbers and identities are given with their color representing their chain assignment.
Figure 3—figure supplement 3.
Figure 3—figure supplement 3.. Unmodeled density between A-site and P-site tRNAs.
Unmodeled density bound between anticodon stem loops of A-tRNA and P-tRNA is represented as a black mesh.
Figure 3—figure supplement 4.
Figure 3—figure supplement 4.. L1 stalk movement in ratcheted and non-ratcheted states.
The figure shows density of L1 stalk in rotated (white) and non-rotated state (purple) along with E-tRNA (pink) and P/E-tRNA (white) and mL64 (magenta), superposed on the large subunit for comparison. All components from the rotated state are shown in white.
Figure 3—figure supplement 5.
Figure 3—figure supplement 5.. Density of mRNA in P-site tRNA bound mitoribosome.
A continuous density of mRNA (purple) is observed in P-site tRNA bound classes (right) but is absent in classes lacking P-site tRNA (left).
Figure 3—figure supplement 6.
Figure 3—figure supplement 6.. Density of LRPPRC-SLIRP complex in mRNA-bound mitoribosome.
(A) Large density adjacent to mS39 corresponding to LRPPRC-SLIRP complex is observed in P-site tRNA bound classes (shown state: APE-site tRNA bottom panel). No such density is observed in classes lacking P-site tRNA (shown state: E-site tRNA, top panel). (B) Top panel shows the superhelical spiral shell of mS39 that interacts with the density. Bottom panel the density displays a two-parted volute architecture that is characteristic of PPR proteins. (C) Comparisons of the density from our study and the previously published in situ cryo-tomography reconstructions (blue).
Figure 4.
Figure 4.. Schematic of the mt-tRNA moving through the mitoribosome based on the solved structures.
Top left, mt-tRNAs bound to A-, P- and E-site and coordinated by mL40 (green) and mL64 (red), mRNA (purple) and LRPPRC-SLIRP module (blue) bound to mS39 (yellow). Seven structures with bound tRNA are arranged in the order representing tRNA translocation through the translation cycle. The conformational changes of mL40 and mL64 are indicated.

References

    1. Afonine PV, Poon BK, Read RJ, Sobolev OV, Terwilliger TC, Urzhumtsev A, Adams PD. Real-space refinement in PHENIX for cryo-EM and crystallography. Acta Crystallographica Section D Structural Biology. 2018;74:531–544. doi: 10.1107/S2059798318006551. - DOI - PMC - PubMed
    1. Aibara S, Andréll J, Singh V, Amunts A. Rapid isolation of the mitoribosome from HEK cells. Journal of Visualized Experiments. 2018;140:e57877. doi: 10.3791/57877. - DOI - PMC - PubMed
    1. Amunts A, Brown A, Toots J, Scheres SHW, Ramakrishnan V. Ribosome the structure of the human mitochondrial ribosome. Science. 2015;348:95–98. doi: 10.1126/science.aaa1193. - DOI - PMC - PubMed
    1. Aphasizhev R, Aphasizheva I. Emerging roles of PPR proteins in trypanosomes: switches, blocks, and triggers. RNA Biology. 2013;10:1495–1500. doi: 10.4161/rna.26215. - DOI - PMC - PubMed
    1. Arora S, Bhamidimarri SP, Bhattacharyya M, Govindan A, Weber MH, Vishveshwara S, Varshney U. Distinctive contributions of the ribosomal P-site elements m2G966, m5C967 and the C-terminal tail of the S9 protein in the fidelity of initiation of translation in Escherichia coli. Nucleic Acids Research. 2013;41:4963–4975. doi: 10.1093/nar/gkt175. - DOI - PMC - PubMed

MeSH terms