

Exploring novel systemic biomarker approaches in grass-pollen sublingual immunotherapy using omics
- PMID: 32813887
- PMCID: PMC8246889
- DOI: 10.1111/all.14565
Exploring novel systemic biomarker approaches in grass-pollen sublingual immunotherapy using omics
Abstract
Background: Sublingual allergen-specific immunotherapy (SLIT) intervention improves the control of grass pollen allergy by maintaining allergen tolerance after cessation. Despite its widespread use, little is known about systemic effects and kinetics associated to SLIT, as well as the influence of the patient sensitization phenotype (Mono- or Poly-sensitized). In this quest, omics sciences could help to gain new insights to understand SLIT effects.
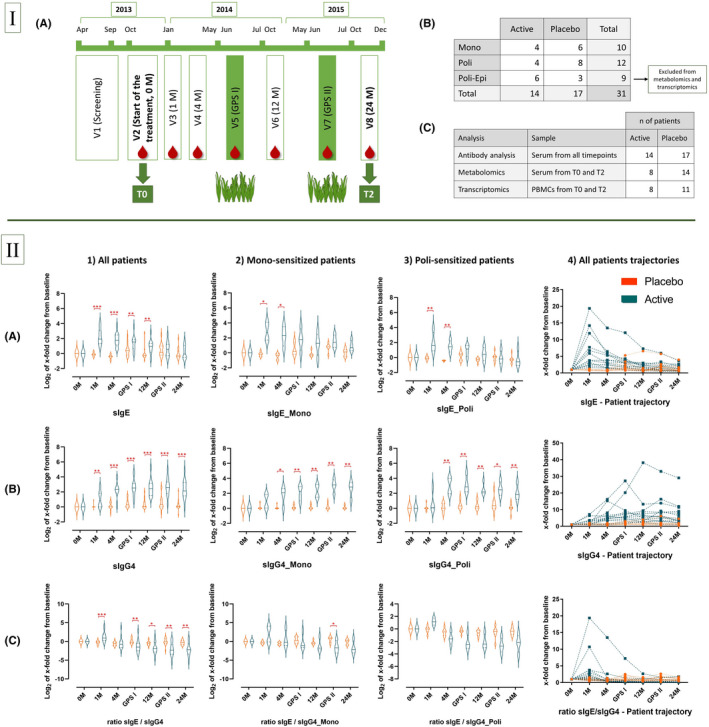
Methods: 47 grass-pollen-allergic patients were enrolled in a double-blind, placebo-controlled, multicenter trial using GRAZAX® during 2 years. Immunological assays (sIgE, sIgG4, and ISAC) were carried out to 31 patients who finished the trial. Additionally, serum and PBMCs samples were analyzed by metabolomics and transcriptomics, respectively. Based on their sensitization level, 22 patients were allocated in Mono- or Poly-sensitized groups, excluding patients allergic to epithelia. Individuals were compared based on their treatment (Active/Placebo) and sensitization level (Mono/Poly).
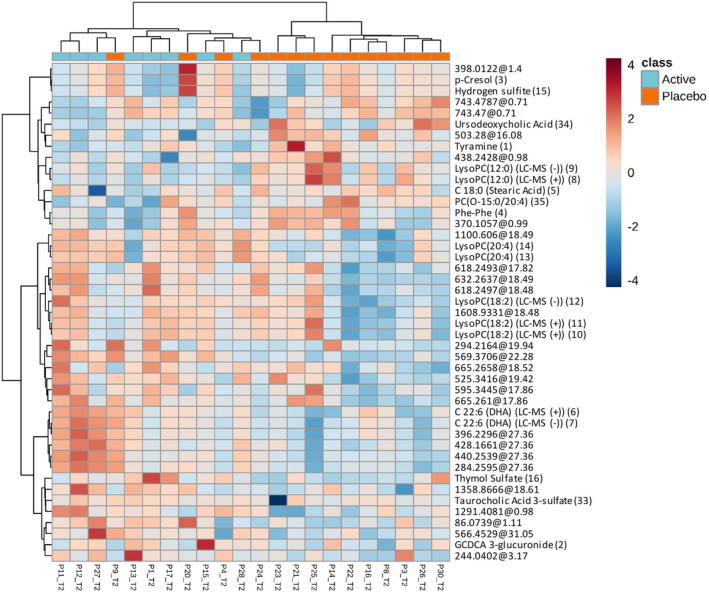
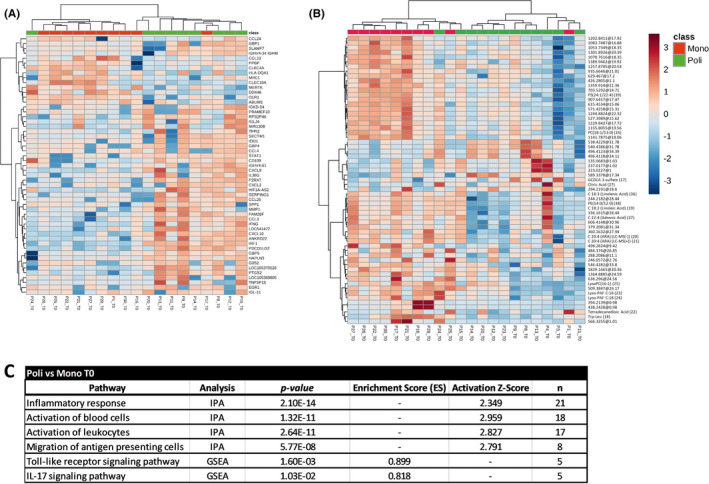
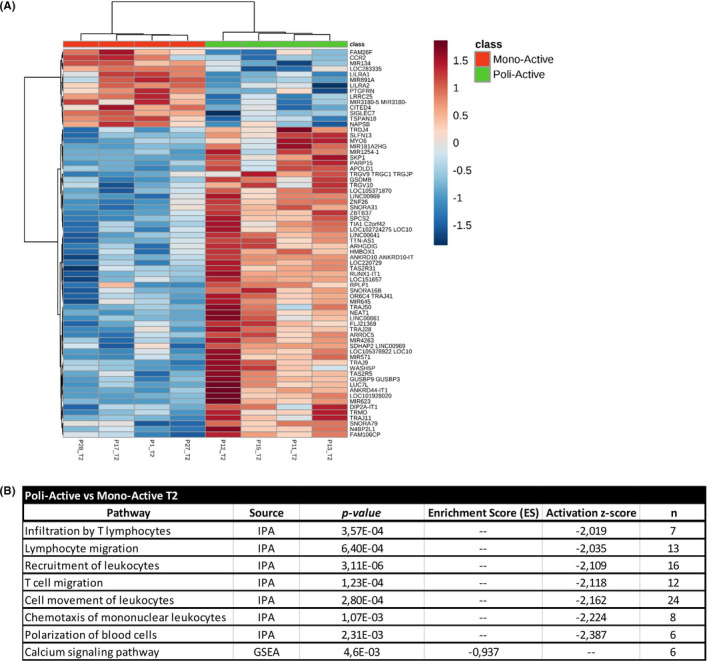
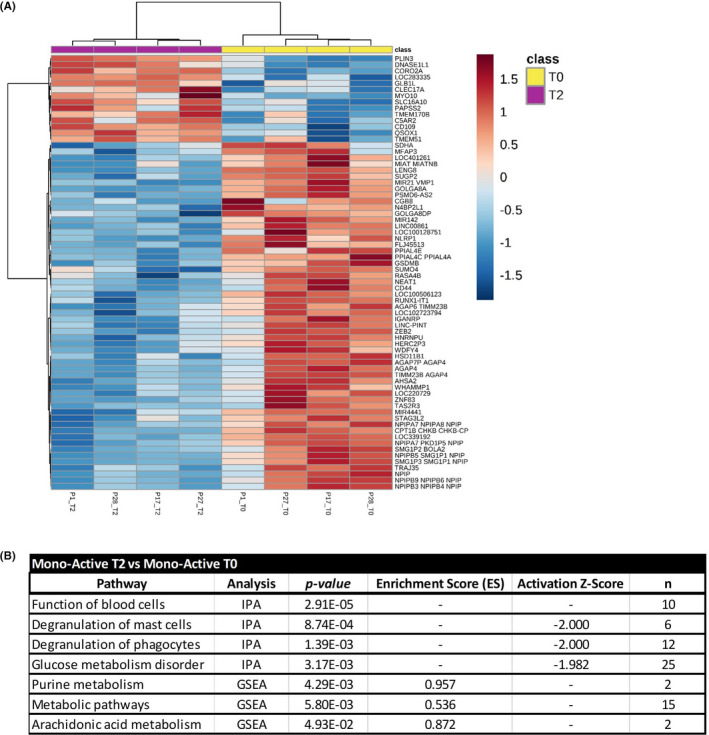
Results: Kinetics of serological changes agreed with those previously described. At two years of SLIT, there are scarce systemic changes that could be associated to improvement in systemic inflammation. Poly-sensitized patients presented a higher inflammation at inclusion, while Mono-sensitized patients presented a reduced activity of mast cells and phagocytes as an effect of the treatment.
Conclusions: The most relevant systemic change detected after two years of SLIT was the desensitization of effector cells, which was only detected in Mono-sensitized patients. This change may be related to the clinical improvement, as previously reported, and, together with the other results, may explain why clinical effect is lost if SLIT is discontinued at this point.
Keywords: biomarkers; metabolomics; respiratory allergy; sublingual immunotherapy; transcriptomics.
© 2020 The Authors. Allergy published by European Academy of Allergy and Clinical Immunology and John Wiley & Sons Ltd.
Figures
Similar articles
-
Heterogeneity of antibody responses among clinical responders during grass pollen sublingual immunotherapy.Clin Exp Allergy. 2013 Dec;43(12):1362-73. doi: 10.1111/cea.12187. Clin Exp Allergy. 2013. PMID: 24261946
-
RNA sequencing of single allergen-specific memory B cells after grass pollen immunotherapy: Two unique cell fates and CD29 as a biomarker for treatment effect.Allergy. 2023 Mar;78(3):822-835. doi: 10.1111/all.15529. Epub 2022 Oct 1. Allergy. 2023. PMID: 36153670 Free PMC article.
-
Double-blind, placebo-controlled study with sublingual immunotherapy in children with seasonal allergic rhinitis to grass pollen.J Investig Allergol Clin Immunol. 2003;13(3):145-8. J Investig Allergol Clin Immunol. 2003. PMID: 14635462 Clinical Trial.
-
An extract of Timothy-grass pollen used as sublingual immunotherapy for summer hay fever.Drugs Today (Barc). 2007 Dec;43(12):841-8. doi: 10.1358/dot.2007.43.12.1162079. Drugs Today (Barc). 2007. PMID: 18174969 Review.
-
Relevance of a 5-grass sublingual tablet for immunotherapy of patients with grass pollen allergy in North America.Expert Rev Clin Immunol. 2016 Jun;12(6):617-23. doi: 10.1586/1744666X.2016.1147349. Epub 2016 Feb 19. Expert Rev Clin Immunol. 2016. PMID: 26813047 Review.
Cited by
-
The Present and Future of Allergen Immunotherapy in Personalized Medicine.J Pers Med. 2022 May 10;12(5):774. doi: 10.3390/jpm12050774. J Pers Med. 2022. PMID: 35629196 Free PMC article. Review.
-
The early-phase transcriptome and the clinical efficacy analysis in three modes of subcutaneous immunotherapy for allergic rhinitis.World Allergy Organ J. 2023 Sep 6;16(8):100811. doi: 10.1016/j.waojou.2023.100811. eCollection 2023 Aug. World Allergy Organ J. 2023. PMID: 37701629 Free PMC article.
-
COVID-19 vaccination and allergen immunotherapy (AIT) - A position paper of the German Society for Applied Allergology (AeDA) and the German Society for Allergology and Clinical Immunology (DGAKI).Allergol Select. 2021 Aug 24;5:251-259. doi: 10.5414/ALX02245E. eCollection 2021. Allergol Select. 2021. PMID: 34533543 Free PMC article.
-
Circulating MIF Associated With Disease Severity and Clinical Response of Sublingual Immunotherapy in House Dust Mite-Induced Allergic Rhinitis.Front Pharmacol. 2021 Jul 8;12:681724. doi: 10.3389/fphar.2021.681724. eCollection 2021. Front Pharmacol. 2021. PMID: 34305594 Free PMC article.
-
COVID-19 vaccination in patients receiving allergen immunotherapy (AIT) or biologicals-EAACI recommendations.Allergy. 2022 Aug;77(8):2313-2336. doi: 10.1111/all.15252. Epub 2022 Mar 18. Allergy. 2022. PMID: 35147230 Free PMC article.
References
-
- Suárez‐Fueyo A, Ramos T, Galán A, et al. Grass tablet sublingual immunotherapy downregulates the TH2 cytokine response followed by regulatory T‐cell generation. J Allergy Clin Immunol. 2014;133:130‐138. - PubMed
-
- Pfaar O, Agache I, de Blay F, et al. Perspectives in allergen immunotherapy: 2019 and beyond. Allergy. 2019;74(Suppl 108):3‐25. - PubMed
-
- Berings M, Karaaslan C, Altunbulakli C, et al. Advances and highlights in allergen immunotherapy: On the way to sustained clinical and immunologic tolerance. J Allergy Clin Immunol. 2017;140:1250‐1267. - PubMed
-
- Shamji MH, Durham SR. Mechanisms of allergen immunotherapy for inhaled allergens and predictive biomarkers. J Allergy Clin Immunol. 2017;140:1485‐1498. - PubMed
Publication types
MeSH terms
Substances
LinkOut - more resources
Full Text Sources
Medical
Molecular Biology Databases
