. 2020 Aug 18;53(2):319-334.e6.
doi: 10.1016/j.immuni.2020.07.017.

Coexpression of CD71 and CD117 Identifies an Early Unipotent Neutrophil Progenitor Population in Human Bone Marrow

Affiliations

Coexpression of CD71 and CD117 Identifies an Early Unipotent Neutrophil Progenitor Population in Human Bone Marrow

Huy Q Dinh et al. Immunity. .

Abstract

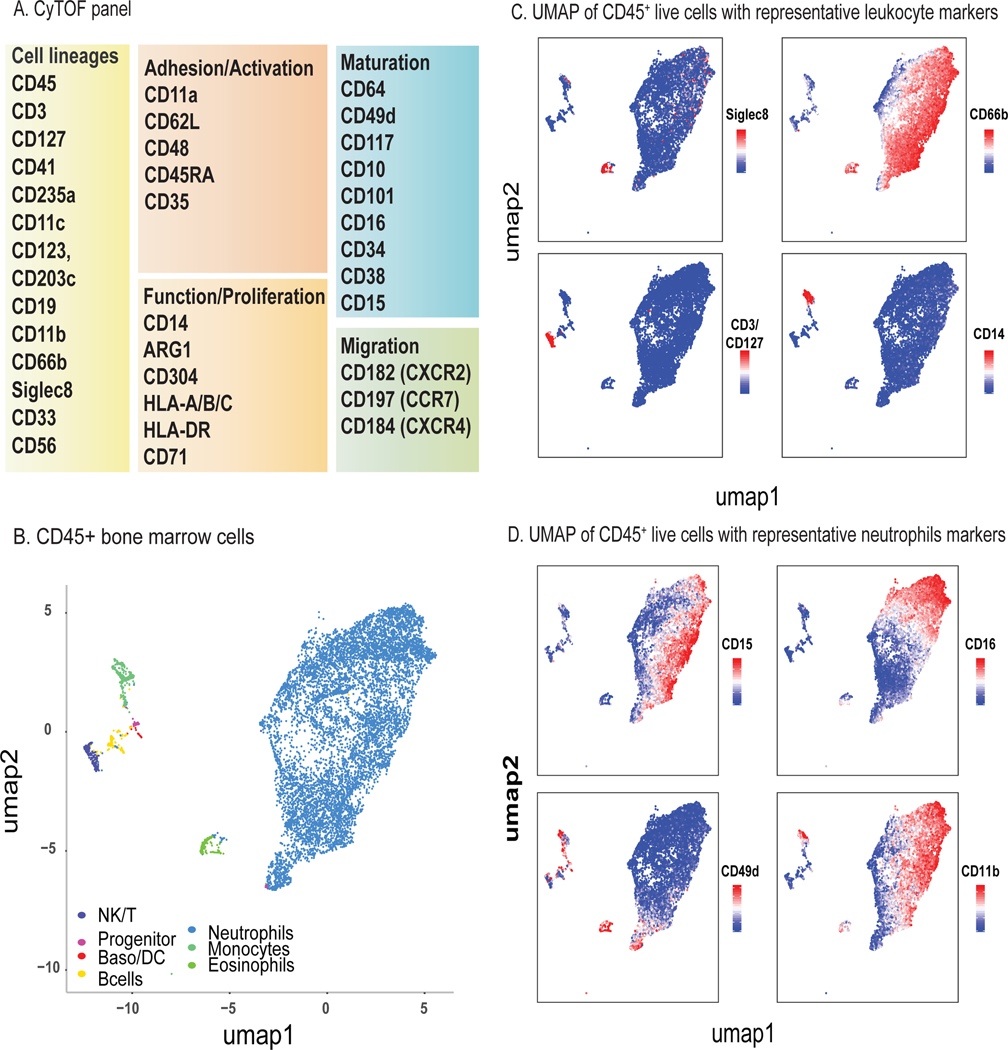
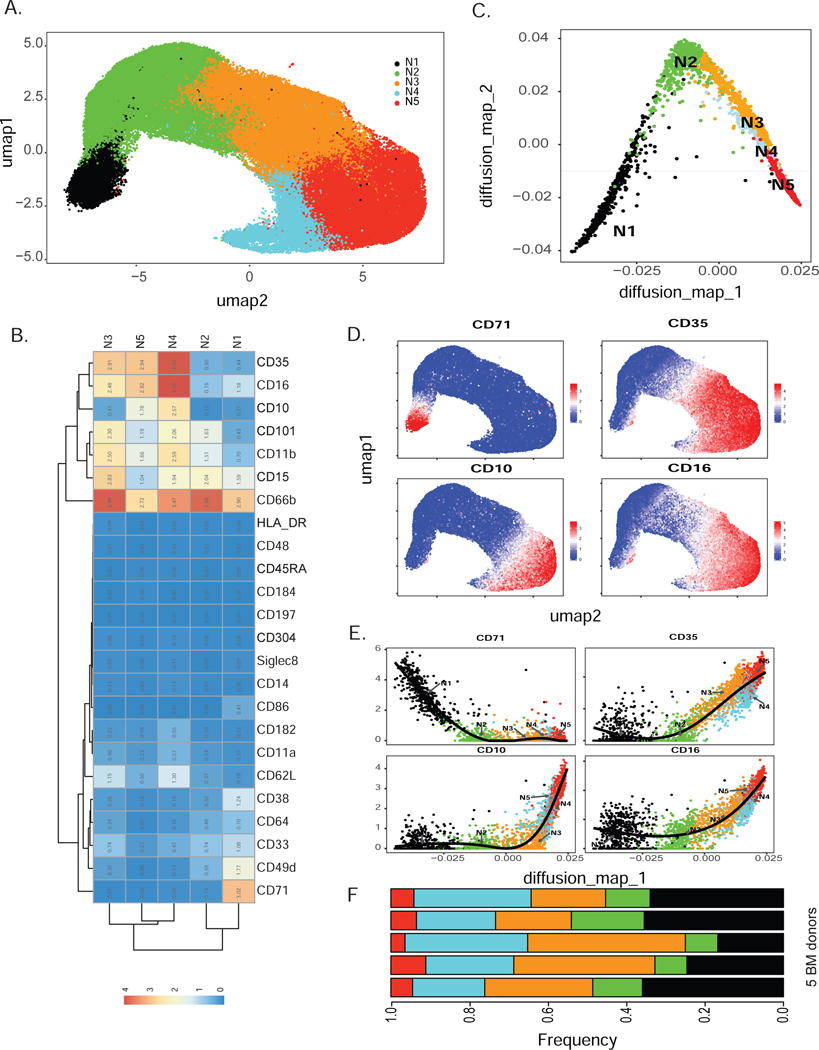
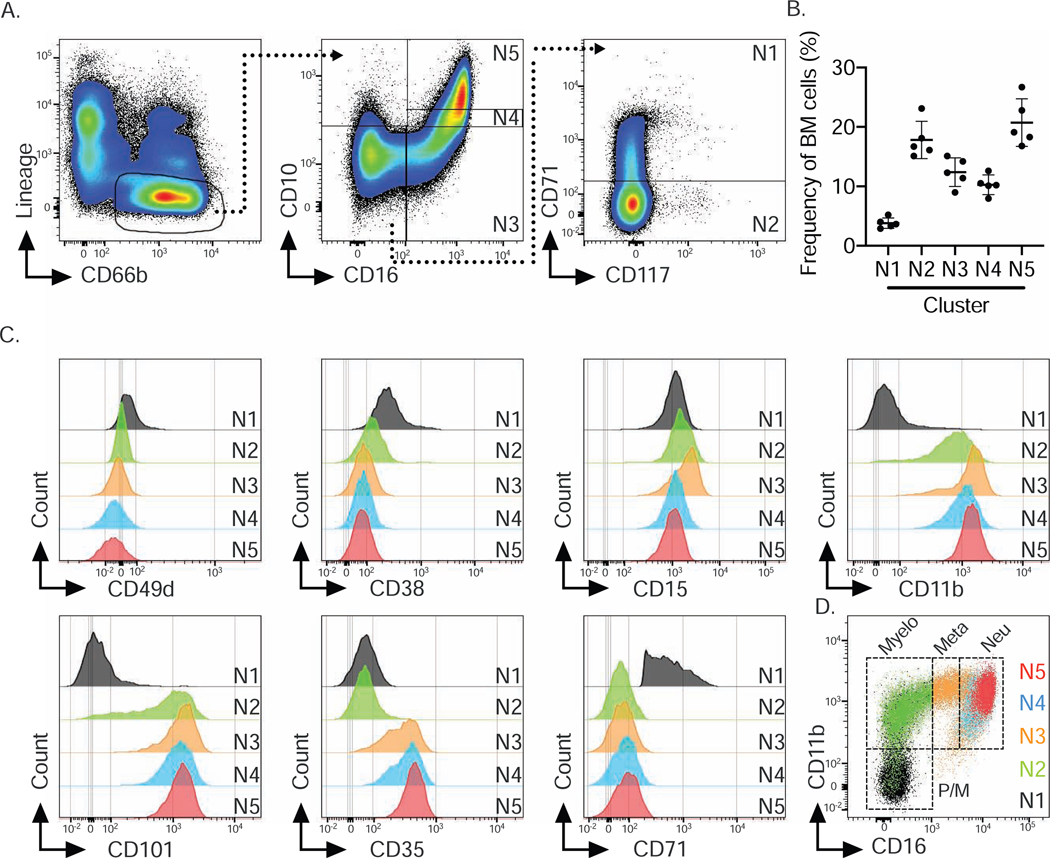
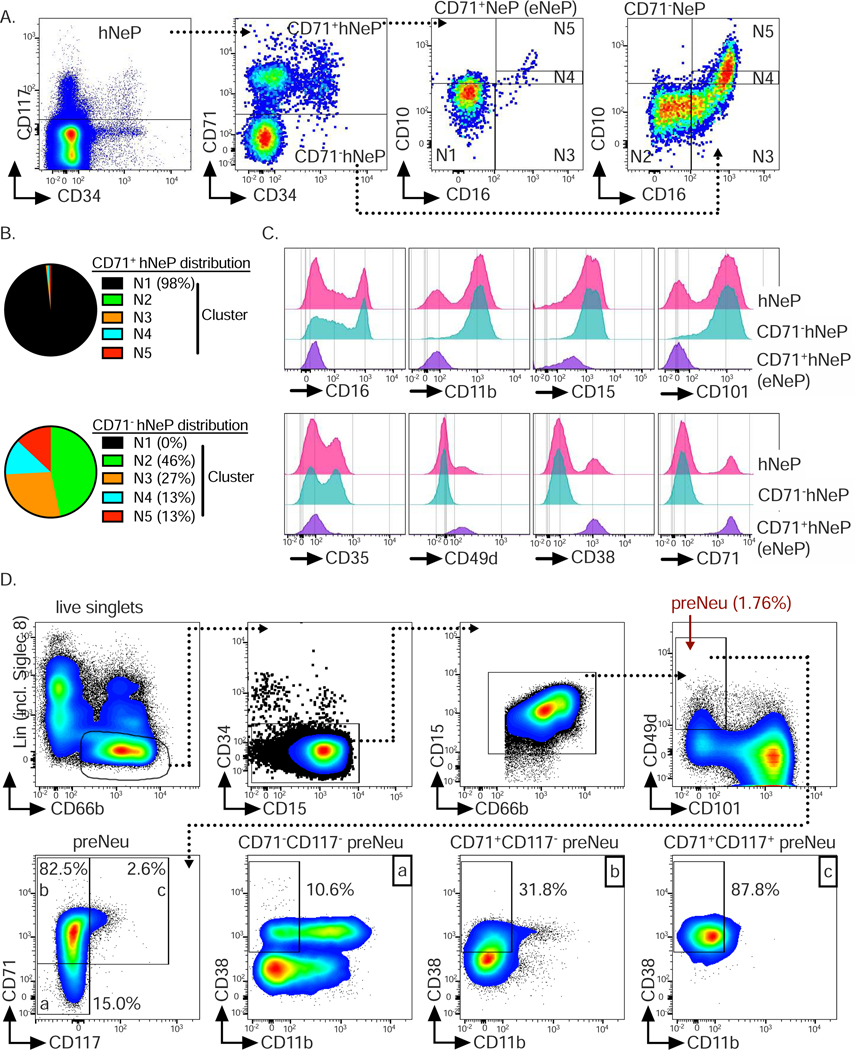
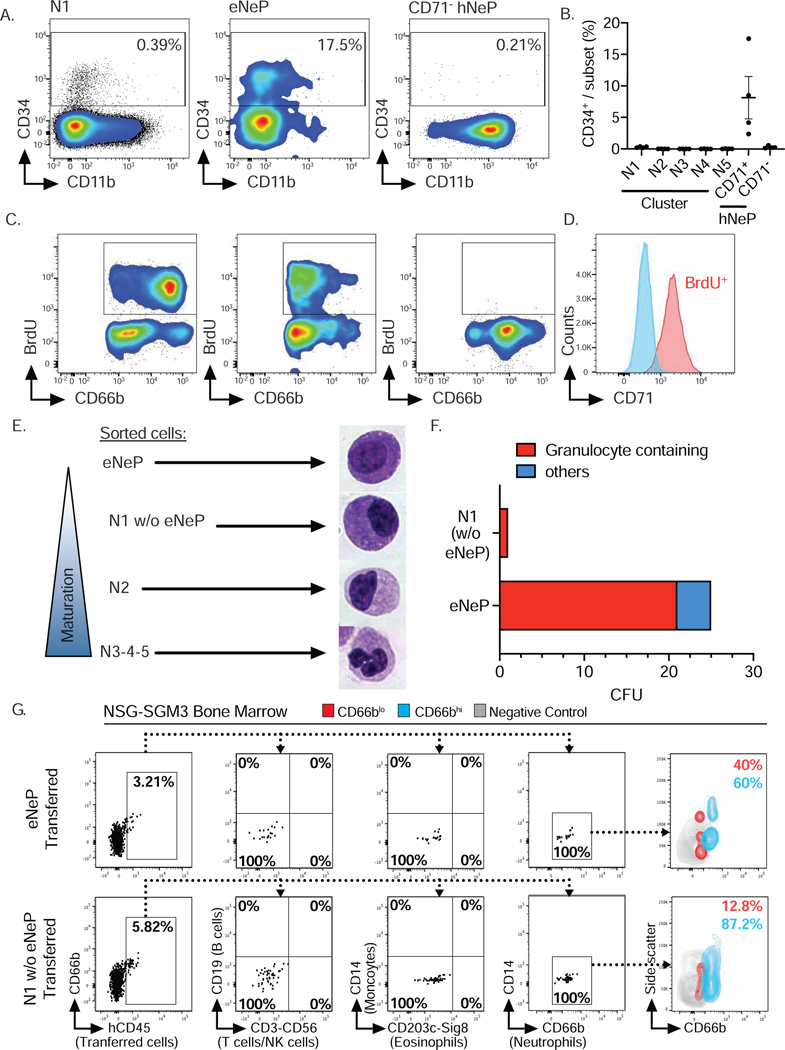
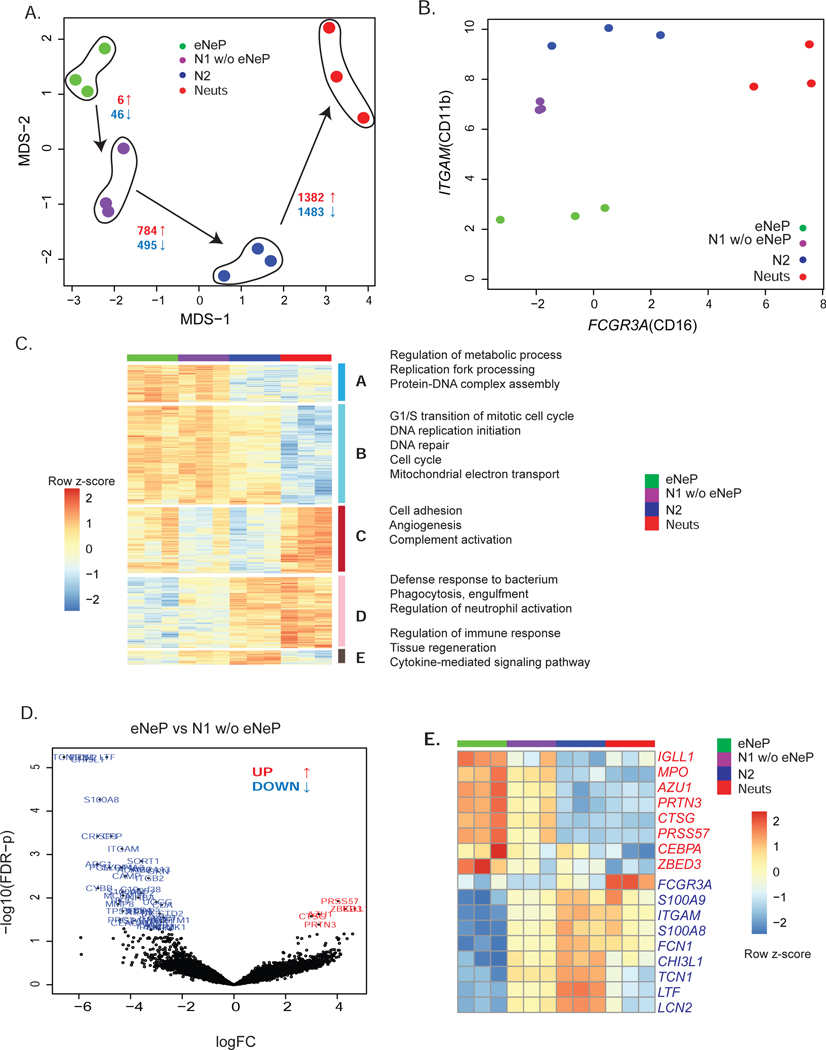
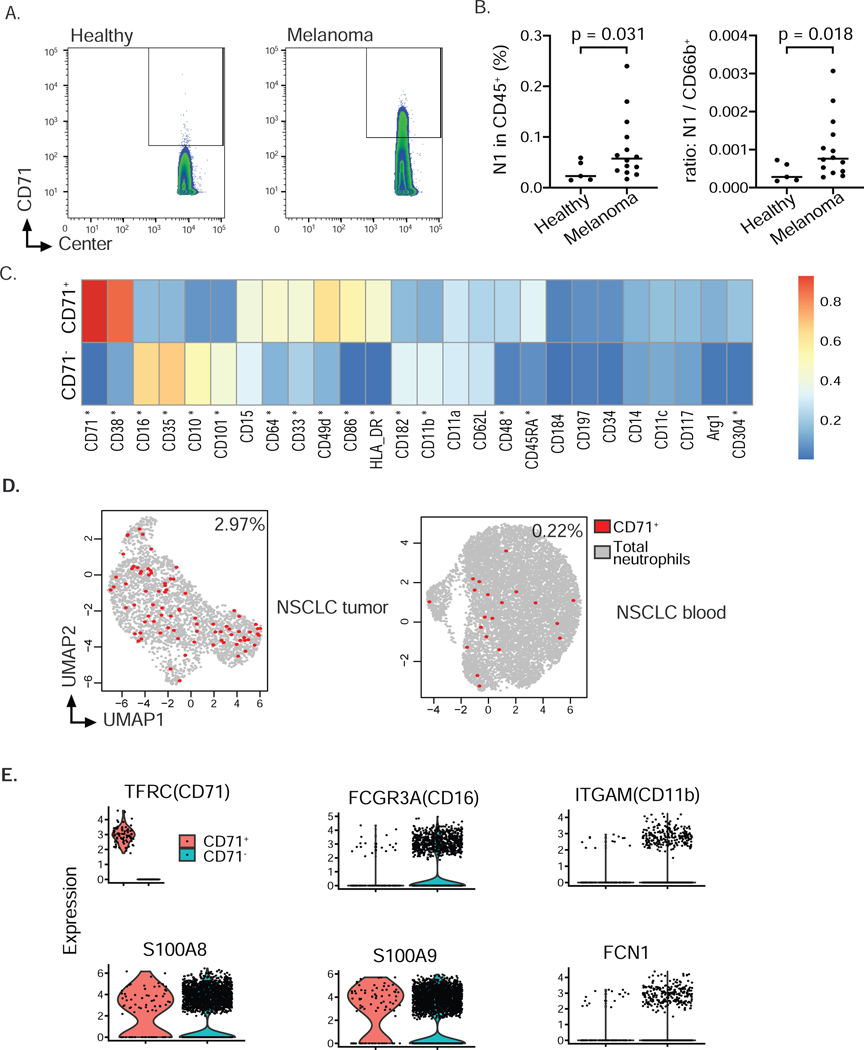
Neutrophils are the most abundant peripheral immune cells and thus, are continually replenished by bone marrow-derived progenitors. Still, how newly identified neutrophil subsets fit into the bone marrow neutrophil lineage remains unclear. Here, we use mass cytometry to show that two recently defined human neutrophil progenitor populations contain a homogeneous progenitor subset we term "early neutrophil progenitors" (eNePs) (Lin-CD66b+CD117+CD71+). Surface marker- and RNA-expression analyses, together with in vitro colony formation and in vivo adoptive humanized mouse transfers, indicate that eNePs are the earliest human neutrophil progenitors. Furthermore, we identified CD71 as a marker associated with the earliest neutrophil developmental stages. Expression of CD71 marks proliferating neutrophils, which were expanded in the blood of melanoma patients and detectable in blood and tumors from lung cancer patients. In summary, we establish CD117+CD71+ eNeP as the inceptive human neutrophil progenitor and propose a refined model of the neutrophil developmental lineage in bone marrow.

Keywords: CD71; bone marrow; cancer; neutrophil development; neutrophil progenitors; neutrophils; promyelocytes.


Conflict of interest statement

Declaration of Interests The authors declare no competing interests.

Figures

Figure 1.
Figure 1.. Study of human bone marrow neutrophil heterogeneity by mass cytometry.
A) CyTOF antibody panel of human immune cell lineage markers and proteins associated with neutrophil function and maturation. CyTOF was performed on fresh human bone marrow from healthy donors (n=5). B) Two-dimensional visualization of major leukocyte populations in human bone marrow (random sampling a total 50,000 cells in which 10,000 cells from each of 5 samples) using UMAP. Major populations were defined by PhenoGraph clustering of 2,540,175 CD45+ live cells and classified based on expression of lineage-specific surface markers. Please also see Fig. S1. C) Single-cell expression of lineage surface markers Siglec-8 (eosinophils), CD66b (neutrophils), CD3/CD127 (NK/T cells), and CD14 (monocytes) used to define major leukocyte populations. D) Single-cell expression of neutrophil surface markers CD49d, CD14, CD11b, and CD16 highlights distinct expression within neutrophil clusters.
Figure 2.
Figure 2.. Human bone marrow neutrophil heterogeneity identified by unbiased clustering (see also Fig. S2).
A) Consensus clustering of PhenoGraph clusters identified 5 merged subsets of CD66b+ neutrophils (labeled as N1-N5) visualized by UMAP projection of total CD66b+ neutrophils. B) Heatmap depicting average surface marker expression of neutrophils, highlighting expression of subset-specific markers, such as CD71 on subset N1. C) Dimensionality reduction by diffusion map of CyTOF data revealed neutrophil lineage trajectory. Random samplings of 500 cells from each cluster N1-N5 were plotted on two diffusion components. D) Single-cell expression of early neutrophil marker CD71 and maturation markers CD35, CD10, and CD16 on human bone marrow neutrophils. E) Cell ordering inferred by diffusion map analysis represented by the first diffusion map component for early and mature markers (CD71, CD35, CD10, CD16). F) Comparison of the frequencies of N1-N5 among healthy human bone marrow donors reveals minimal inter-donor heterogeneity. N1-N5 neutrophil subsets were present in all donors (n=5).
Figure 3.
Figure 3.. Flow cytometry confirms 5 human bone marrow neutrophil subsets (see also Fig. S2).
A) Flow cytometry gating strategy based on marker expression from CyTOF data shown in Fig. 2B to identify 5 bone marrow neutrophil clusters. B) Frequencies of 5 neutrophil subsets based on flow cytometry data for an independent cohort of 5 human bone marrow donors confirms frequencies observed in CyTOF data. C) Histograms of neutrophil markers across 5 neutrophil subsets based on flow cytometric analysis and gating strategy shown in A. D) Overlay of 5 identified neutrophil subsets onto CD16 vs. CD11b biaxial dot plot based on the conventional gating strategy for neutrophil progenitors (Hidalgo et al. 2019) identified subsets N1 to N5 as Promyelocytes (Pro), Myelocytes (Myelo), Metamyelocytes (Meta) and banded and segmented neutrophils (Neu).
Figure 4.
Figure 4.. CD71+hNeP, termed eNeP, are a distinct subset of progenitors (see als Fig. S3, Fig. S4 and Fig. S5).
A) Stratification of previously identified neutrophil progenitor population termed hNeP (Zhu et al. 2018) by promyelocyte (N1) marker CD71 identified CD71+hNeP and CD71hNeP. Because CD71 was found to be a defining marker for neutrophil progenitors within promyelocytes (Fig. 3), CD71+hNeP were re-labeled as ‘early NeP’ or ‘eNeP’. Subsequently, eNeP (CD71+hNeP) and CD71NeP were backgated using the gating strategy depicted in Fig. 3A, revealing that only eNeP were a pure population and negative for maturation markers CD10 and CD16. B) Frequencies of 5 defined neutrophil subsets (N1 to N5) in eNeP (CD71+hNeP) and CD71 hNeP. C) Comparison of selected neutrophil markers based on histograms of flow cytometric analysis of hNeP, eNeP (CD71+NeP) and CD71NeP. D) Top: Flow cytometry gating strategy to identify previously described preNeu (Evrard et al. 2018). Bottom: preNeu were further stratified according to CD71 and CD117 expression, identifying eNeP as a small subpopulation of preNeu (2.6%; gate c). The resulting subsets were then examined for neutrophil maturation marker CD11b and progenitor marker CD38.
Figure 5.
Figure 5.. eNeP are early unipotent proliferating neutrophil progenitors
A) Analysis of CD34 expression on early neutrophil subsets by flow cytometry. B) Frequency of CD34+cells among 5 neutrophil clusters, eNeP and CD71NeP analyzed by flow cytometry as shown in A. Please also see Fig. S6. C) Quantification of proliferation by measuring BrdU incorporation with flow cytometry. Neutrophil subsets not depicted here contained < 0.2% proliferating cells (not shown). D) Histogram of BrdU staining in bone marrow neutrophils stratified by CD71. Gated on BrdU+ or BrdU live neutrophils after exclusion of doublets (not shown). E) Microscopic analysis of morphology of fluorescence-activated cell sorted neutrophil subsets following Cytospin and Hema 3™ staining identified the typical morphology of neutrophil maturation gradually developing along identified neutrophil subsets. Please also see Fig. S6. F) Quantification of in vitro progenitor differentiation assay of fluorescence-activated cell sorted eNeP and cluster N1 (w/o eNeP). Colonies were identified by side-by-side comparison with representative images of pre-defined colonies from 3 independent plates. G) eNePs or N1 w/o eNePs human bone marrow cells were sorted and adoptively transferred into irradiated NSG-SGM3 mice. Recipient bone marrow was analyzed by flow cytometry after 5 days. Plots show the absence of T cells (CD3), NK cells (CD56), B cells (CD19), monocytes (CD14), and eosinophils (Siglec8, CD203c) and sole presence of neutrophils (CD66b) in human CD45+ (hCD45) progeny. Contour plot shows CD66bLo (red) and CD66bhi (blue) hCD45+ progeny. Grey contour indicates negative control (mouse CD45+ cells). Flow cytometry is representative of 3 independent experiments (n=3 mice per group). Please also see Fig. S5.
Figure 6.
Figure 6.. Transcriptome analysis reveals distinct gene expression of eNeP
A) eNep, N1 w/o eNeP, N2 and N3-4-5 (Neuts) were fluorescence-activated cell sorted, followed by bulk RNA sequencing. Please also see Fig. S6. MDS plot of eNeP, preNeu-like, immature and mature neutrophils (3 replicates each) suggested the developmental stages starting with eNeP toward more mature neutrophils. Number of statistically significant differentially expressed (logFC 2 and FDR-corrected p-values cutoff 0.05) genes (red: up-regulated, blue: down-regulated) for the comparison between eNep-N1(w/o eNeP), N1(w/o eNeP) - N2, N2 - mature neutrophils (N3-4-5). B) Log2 expression of CD11b (ITGAM) and CD16 (FCGR3A) of the 4 sorted neutrophil subsets shown in A aligned with the conventional neutrophil development gating strategy (Hidalgo et al. 2019) of neutrophil maturation from promyelocytes to mature neutrophils (compare to Fig. 3D). C) Five gene clusters from pairwise differentially expression analysis between two neutrophil subsets next to each other in the developmental lineages (eNeP-N1(w/o eNeP), N1(w/o eNeP) - N2, N2 - mature neutrophils (N3-4-5)). Biological process GO terms that were enriched in each of 5 subsets. D) Volcano plot of differentially expressed genes between the earliest neutrophil progenitor subsets eNeP and N1 w/o eNeP (−log 10 adjusted p-values - yaxis and log2FC - xaxis) revealed 6 up-regulated genes in eNeP. E) Top up- and down-regulated genes (logFC 2, FDR-corrected p values 0.05) in eNeP from (D) and neutrophil genes (transcriptional factors CEBPA/E, neutrophil marker MPO, AZU1, FCGR3A, S100A8/9) confirmed early developmental stage of eNeP.
Figure 7.
Figure 7.. Expansion of CD71+ neutrophils in cancer patients (see also Fig. S7).
A) Representative contour plot of CyTOF analysis of 14 melanoma samples and 5 healthy controls to identify CD71 positive cells among CD66b+CD15+CD16CD10neutrophils in blood of healthy donors and melanoma patients suggested expansion of neutrophil progenitor subset N1 in blood of cancer patients. Gating also included exclusion of dead cells and cells expressing CD3, CD19, CD56 and CD14 (not shown). B) Frequency of neutrophil progenitor subset N1 within all leukocytes or ratio of subset N-to-CD66b+neutrophils in blood of healthy donors and melanoma patients. Data analyzed according to results shown in panel A. n = 5 healthy donors, n = 14 melanoma patients. Welch’s t-test was performed and p-value shown. C) Differentially expression test of protein marker expression between CD71− and CD71+ neutrophils (Wilcox rank sum test, Fig. S7C) revealed a number of important markers including progenitor markers CD38, CD48, CD49d, maturation markers CD16, CD10, CD35, CD101, antigen-presenting markers CD86, HLA-DR, CD64 and angiogenesis-associated marker CD304 (star indicating FDR-corrected p values < 0.01, 2-fold change difference in the expression median, Fig. S7C). Expression value was normalized from 0–1 for each marker. D) CD71+ eNeP are found in the blood of NSCLC patients and in lung tumor samples (from our reanalysis of single cell RNA sequencing data sets (Zilionis et al. 2019)). Each dot is one cell, red dots representing positive CD71 expression. E) Violin plot from scRNA-Seq of CD71+ neutrophils and other neutrophils (CD71, data set also depicted in D).

References

    1. Aisen Philip. 2004. “Transferrin Receptor 1.” The International Journal of Biochemistry & Cell Biology 36 (11): 2137–43. - PubMed
    1. Alexa Adrian, Jörg Rahnenführer, and Lengauer Thomas. 2006. “Improved Scoring of Functional Groups from Gene Expression Data by Decorrelating GO Graph Structure.” Bioinformatics 22 (13): 1600–1607. - PubMed
    1. Bainton DF, Ullyot JL, and Farquhar MG. 1971. “The Development of Neutrophilic Polymorphonuclear Leukocytes in Human Bone Marrow.” The Journal of Experimental Medicine 134 (4): 907–34. - PMC - PubMed
    1. Becht Etienne, Leland McInnes John Healy, Dutertre Charles-Antoine, Kwok Immanuel W. H., Lai Guan Ng Florent Ginhoux, and Newell Evan W.. 2018. “Dimensionality Reduction for Visualizing Single-Cell Data Using UMAP.” Nature Biotechnology, December. 10.1038/nbt.4314. - DOI - PubMed
    1. Beguin Y, Lampertz S, De Groote D, Igot D, Malaise M, and Fillet G. 1993. “Soluble CD23 and Other Receptors (CD4, CD8, CD25, CD71) in Serum of Patients with Chronic Lymphocytic Leukemia.” Leukemia 7 (12): 2019–25. - PubMed

Publication types