. 2020 Aug 18;53(2):398-416.e8.
doi: 10.1016/j.immuni.2020.07.010.

Paneth Cell-Derived Lysozyme Defines the Composition of Mucolytic Microbiota and the Inflammatory Tone of the Intestine

Affiliations

Paneth Cell-Derived Lysozyme Defines the Composition of Mucolytic Microbiota and the Inflammatory Tone of the Intestine

Shiyan Yu et al. Immunity. .

Abstract

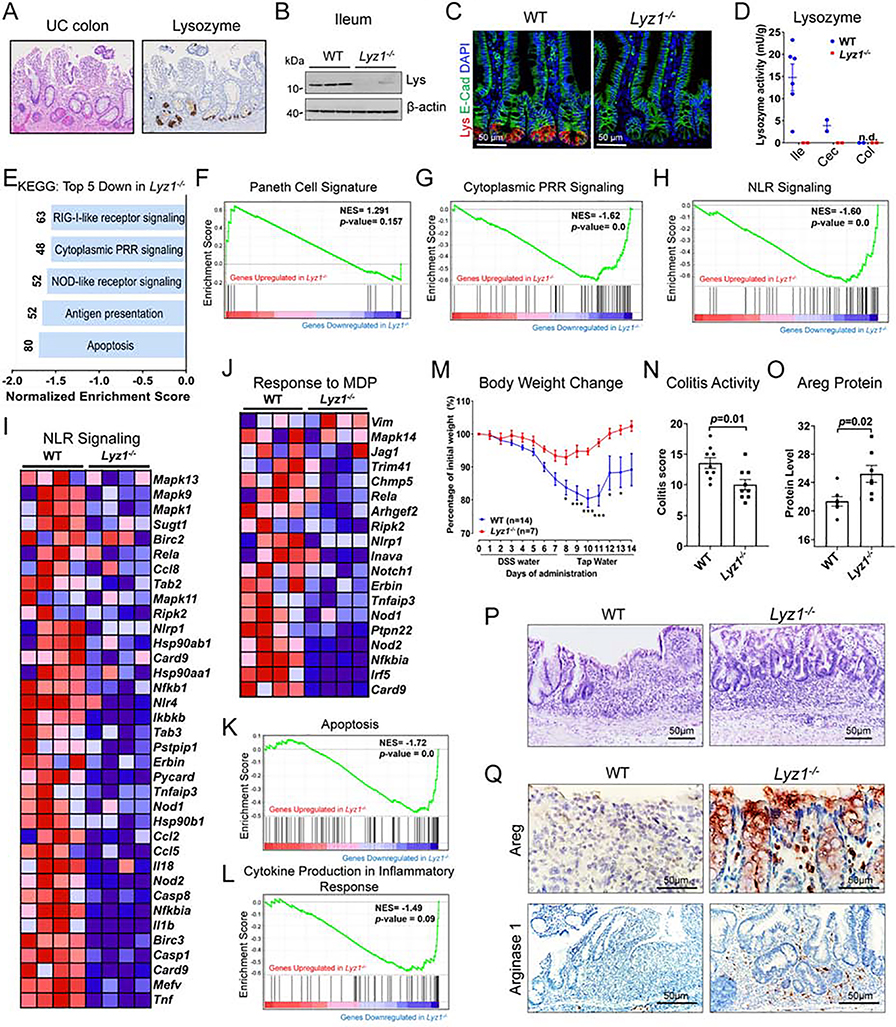
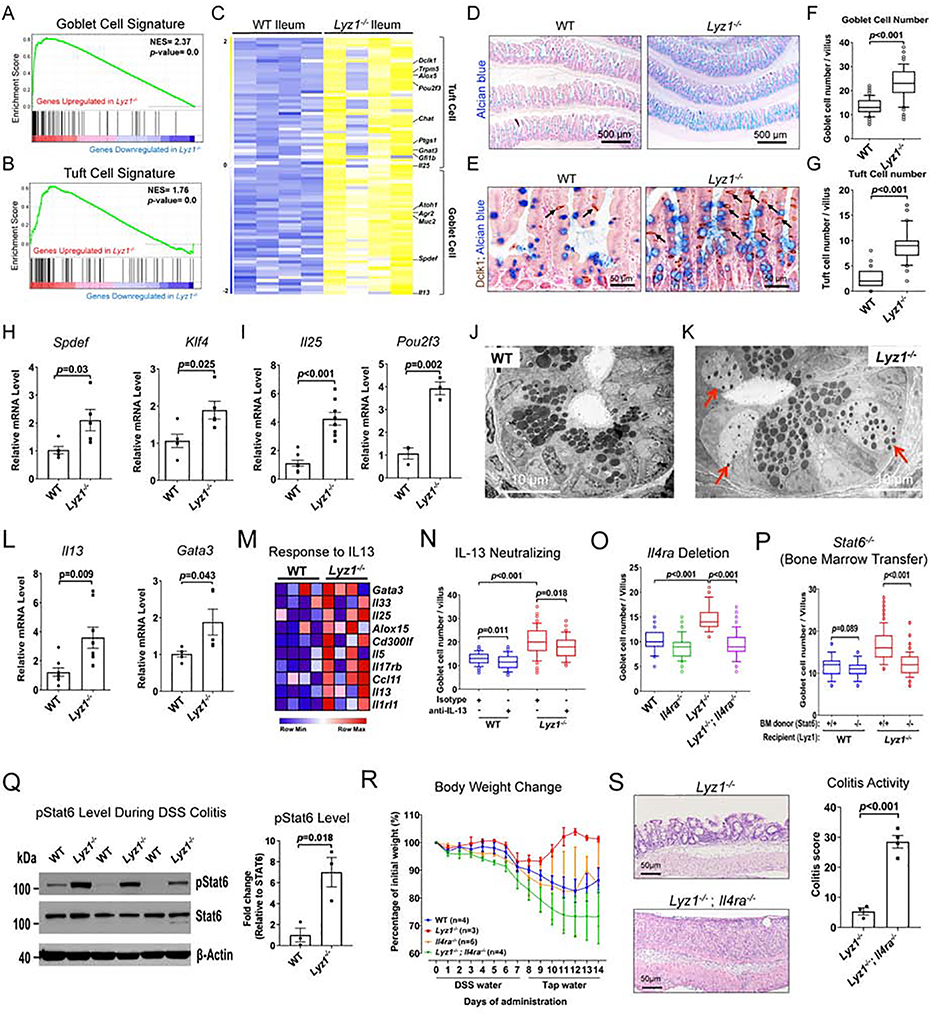
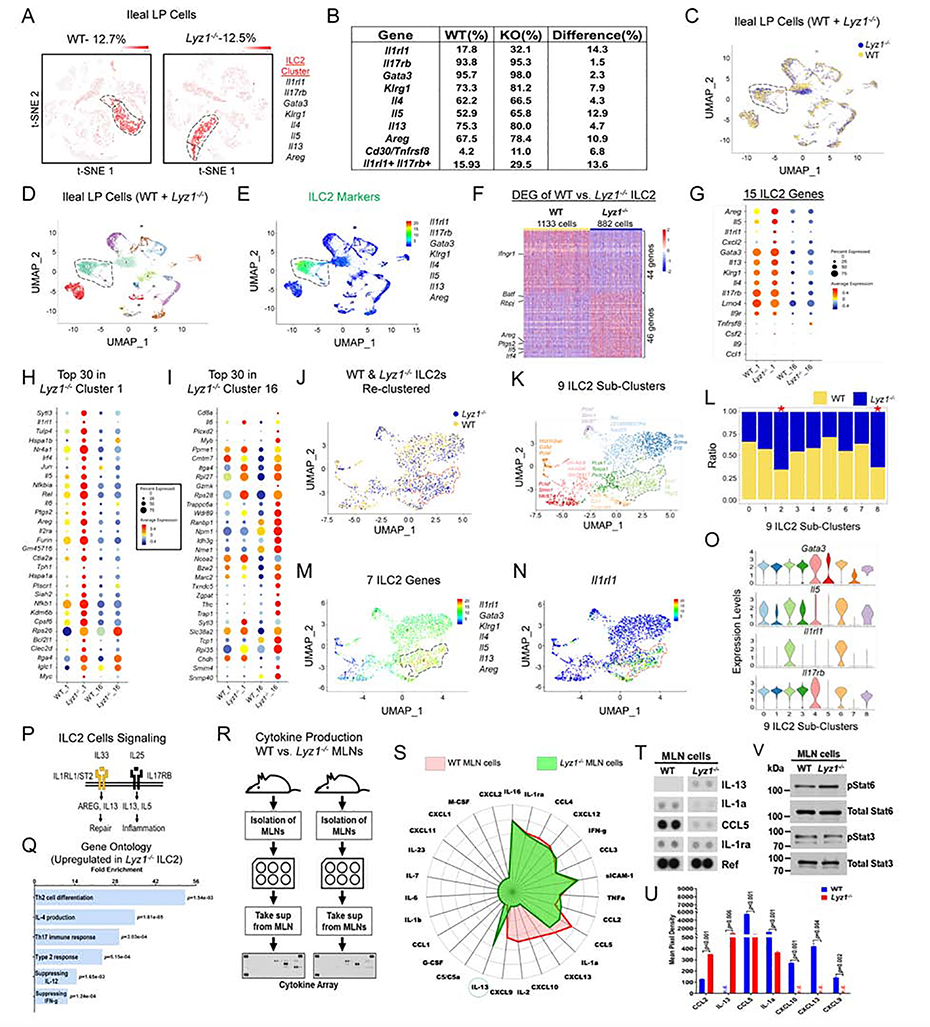
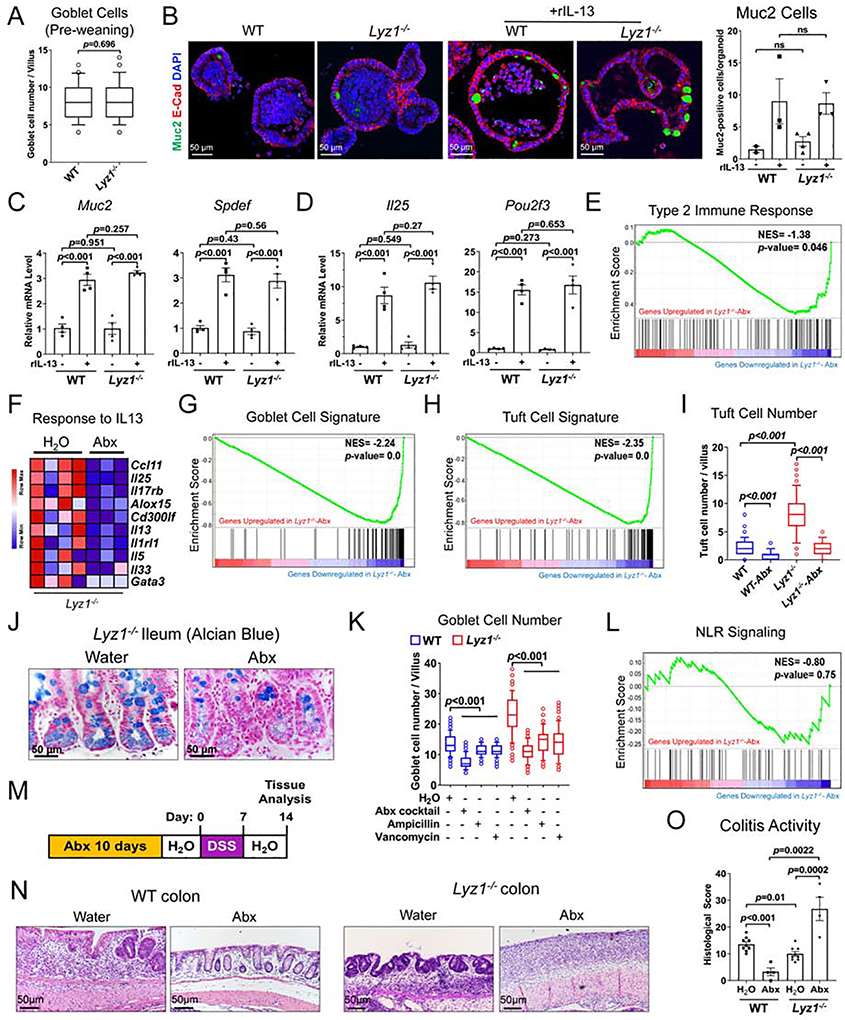
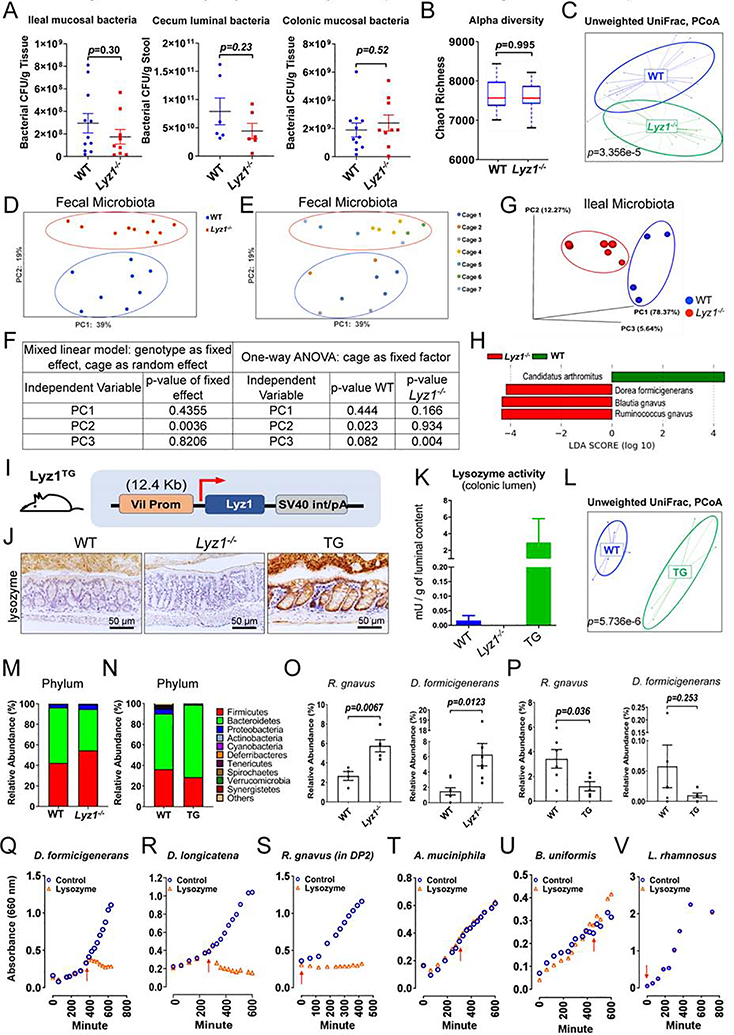
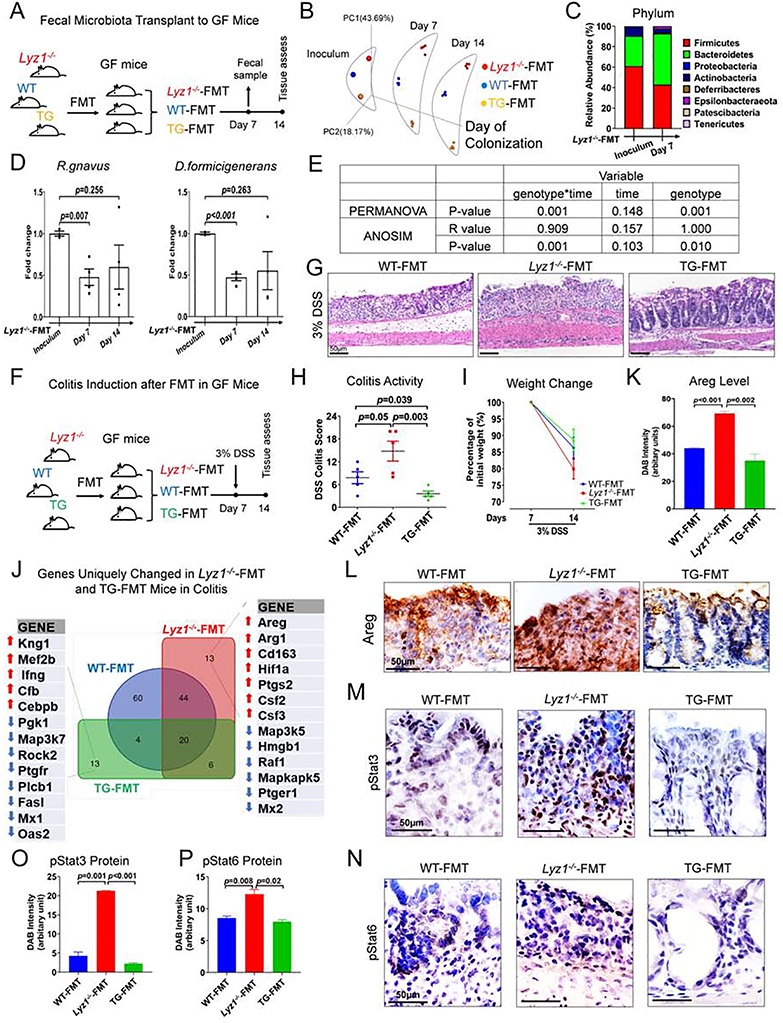
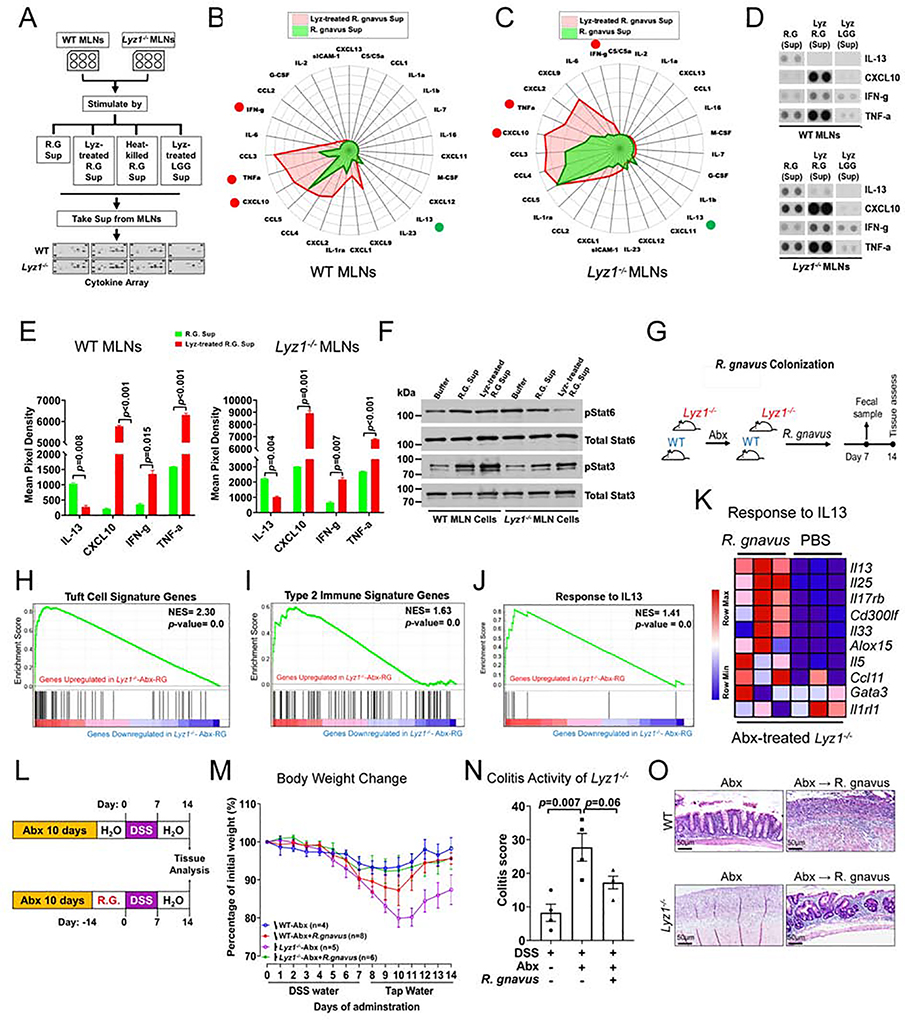
Paneth cells are the primary source of C-type lysozyme, a β-1,4-N-acetylmuramoylhydrolase that enzymatically processes bacterial cell walls. Paneth cells are normally present in human cecum and ascending colon, but are rarely found in descending colon and rectum; Paneth cell metaplasia in this region and aberrant lysozyme production are hallmarks of inflammatory bowel disease (IBD) pathology. Here, we examined the impact of aberrant lysozyme production in colonic inflammation. Targeted disruption of Paneth cell lysozyme (Lyz1) protected mice from experimental colitis. Lyz1-deficiency diminished intestinal immune responses to bacterial molecular patterns and resulted in the expansion of lysozyme-sensitive mucolytic bacteria, including Ruminococcus gnavus, a Crohn's disease-associated pathobiont. Ectopic lysozyme production in colonic epithelium suppressed lysozyme-sensitive bacteria and exacerbated colitis. Transfer of R. gnavus into Lyz1-/- hosts elicited a type 2 immune response, causing epithelial reprograming and enhanced anti-colitogenic capacity. In contrast, in lysozyme-intact hosts, processed R. gnavus drove pro-inflammatory responses. Thus, Paneth cell lysozyme balances intestinal anti- and pro-inflammatory responses, with implications for IBD.

Keywords: IL-13; Lyz1; Paneth cell; Ruminococcus gnavus; colitis; inflammation; lysozyme; mucolytic bacteria; type 2 immunity.


Conflict of interest statement

Declaration of Interests The authors declare no competing interests.

Figures

Figure 1.
Figure 1.. Lyz1 deficiency diminishes NLR signaling and reduces inflammation during experimental colitis.
(A) Representative IBD patient left colon with metaplastic Paneth cells positive for lysozyme. (B-C) Loss of lysozyme protein expression in Lyz1−/− ileum by Western blotting (B; N=3) and by immunostaining (C; lysozyme in red; N>20). (D) Enzymatic activity of lysozyme in WT and Lyz1−/− ileum, cecum and proximal colon luminal contents was measured by a fluorometric assay (N=2–6 per genotype). (E) Top 5 pathways identified by KEGG analysis of differential gene expression by bulk RNAseq of WT and Lyz1−/− ileum (N=4 for each genotype for E-L). (F) No change of Paneth cell signature in Lyz1−/− ileum in GSEA analysis. (G-H) Significant reduction of cytoplasmic PRR and NLR signaling in Lyz1−/− ileum in GSEA analysis (p=0.0). (I-J) Differenatial expression of genes involved in NLR signaling, in particular to MDP, in Lyz1−/− ileum. (K-L) Suppressed apoptosis and inflammatory cytokine production in Lyz1−/− ileum in GSEA analysis. (M) Body weight change in WT and Lyz1−/− mice during 3% DSS treatment and recovery. (N) Histological colitis activity scores in WT and Lyz1−/− mice after DSS treatment. (O) Areg protein quantitation from immune-stained sections of DSS-treated WT and Lyz1−/− mouse colons. (P) Representative H&E staining of the distal colons of DSS-treated WT and Lyz1−/− mice. (Q) Representative immunostaining of Areg and Arginase 1 in the colon of DSS-treated WT and Lyz1−/− mice. All bar graphs display mean ± SEM from at least two independent experiments. See also Figure S1.
Figure 2.
Figure 2.. Elevated type 2 immune response in Lyz1−/− intestinal mucosa mediates anti-colitogenic protection.
(A-B) Elevated goblet and tuft cell signatures in Lyz1−/− ileum in GSEA analysis (p=0.0). (C) Differential expression of goblet and tuft cell specific genes along with IL-25 and IL-13 in WT and Lyz1−/− ileum (N=4 for each genotype). (D-E) Representative Alcian blue (goblet) and DCLK1 (tuft) staining in WT and Lyz1−/− ileum. (F-G) Quantification of the number of goblet and tuft cells per villus in WT and Lyz1−/− littermates (N=5 mice per genotype). (H-I) Real-time qPCR for goblet and tuft cell specific genes (N=3~6 per genotype). (J-K) Transmission electron microscopy of the WT and Lyz1−/− ileal crypts demonstrating cells with granules characteristic of both goblet and Paneth cells. The electron dense granules were surrounded by expanded halos (red arrows) in abnormal Paneth cells in the Lyz1−/− (representative of N=3 for each genotype). (L) qPCR analysis of IL-13 and Gata3 mRNA in WT and Lyz1−/− ileum (N=3–6 for each genotype). (M) Differential expression of IL-13 responsive genes in WT and Lyz1−/− ileum (N=4 per genotype). (N) Goblet cell numbers (counted from 50 villi per field of vision per mouse) in WT or Lyz1−/− mice treated with neutralizing anti-IL-13 antibody, anti- CD90.2, or isotype control (N=2 for each condition per genotype). (O) Goblet cell numbers (counted from 50 villi per field of vision per mouse) in WT, Lyz1−/−, Il4ra−/−, or Lyz1−/−; Il4ra−/− mice (N=3 for each genotype). (P) Goblet cell numbers (counted from 50 villi per field of vision per mouse) in WT or Lyz1−/− bone marrow chimeras with hematopietic cells from Stat6+/+ or Stat6−/− donors (total N=4 mice for each condition; 2 independent experiments). (Q) Western blotting analysis of pStat6 from the colons of DSS-treated WT and Lyz1−/− mice (N=3 for each genotype). (R) Body weight change in WT, Lyz1−/−, Il4ra−/−, or Lyz1−/−; Il4ra−/− mice treated by 3% DSS and during recovery. (S) Representative H&E staining and colitis histological activity score in DSS-treated Lyz1−/− and Lyz1−/−; Il4ra−/− mice. All bar graphs display mean ± SEM from at least two independent experiments. See also Figure S2.
Figure 3.
Figure 3.. scRNAseq reveals immune-activated ILC2 in Lyz1−/− ileal lamina propria.
(A) Unsupervised separate clustering (t-SNE plot) of LP cells identified ILC2 populations in WT mice (total of 1,017 cells, 12.7% of all LP cells) and in Lyz1−/− mice (844 cells, 12.5% of all LP cells). (B) Table summarizing the percentage of ILC2 cells that expressed indicated genes in WT and Lyz1−/− LP. (C-D) Uniform manifold approximation and projection (UMAP) of combined clustering of WT and Lyz1−/− LP cells (WT, 8767 cells; Lyz1−/−, 7492 cells) resulted in 23 distinct clusters. (E) ILC2s (clusters 1 &16) identified based on the indicated set of signature genes. (F) 90 differentially expressed genes between WT and Lyz1−/− ILC2 population in cluster 1. (G-I) Representative differentially expressed genes in WT and Lyz1−/− ILC2s. Dot size reflects the percentage of cells in the cluster that express the gene; color indicates the average expression of the gene. (G) Differential expression of 15 ILC2 signature genes by WT and Lyz1−/− ILC2s. (H) Top 30 genes increased in Lyz1−/− cluster 1. (I) Top 30 genes increased in Lyz1−/− cluster 16. (J-O) All WT and Lyz1−/− ILC2 cells (a total of 2281 cells) were further partitioned into 9 sub-clusters colored by genotype (J) or by cluster (K), with top 3 differentially expressed genes indicated next to each sub-cluster. (L) Bar graph with the relative distribution of WT and Lyz1−/− ILC2 cells in each sub-cluster. The Lyz1−/− ILC2-dominated sub-clusters 2 & 8 were denoted by an asterisk. (M) UMAP projection with 7 indicated signature genes elevated in sub-cluster 2 of Lyz1−/− ILC2. (N) ILC2 UMAP projection with highlighetd relative expression of Il1rl1 mRNA. (O) Violin plots of indicated gene expression across 9 ILC2 sub-clusters. (P) Schematic illustration of ILC2 signaling through IL1RL1 and IL17RB receptors in tissue repair and inflammation. (Q) Gene ontology (GO) categories (sorted by P value) with top pathways overrepresented in Lyz1−/− ILC2 compared to WT ILC2 in cluster 1. (R-S) Experimental design and radar plot with differential cytokine/chemokine secretion by WT (red) and Lyz1−/− (green) MLN cells at steady state. IL-13 highlighted by a circle. (T) Representative dot blots showing elevated IL-13 production by Lyz1−/− MLN cells. (U) Quantification of cytokine/chemokine production from two independent experiments. The bar graph displays mean ± SEM. (V) Western blots for pStat6 and pStat3 using MLN cell lysates from the experiment shown in S-U. See also Figure S3.
Figure 4.
Figure 4.. Altered mucosal immunity in Lyz1−/− mice is microbiota-dependent
(A) Goblet cell numbers (counted from 50 villi per field of vision per mouse) in WT or Lyz1−/− mice based on Alcian blue staining of ileal sections of 14 day-old WT and Lyz1−/− mice (N=4 for each genotype from 2 independent experiments). (B) The effect of genotype and IL-13 treatment on goblet cell maturation (Muc2+ cells in green) in ileal entroids from WT and Lyz1−/− mice. (C-D) qPCR analysis of mRNA expression of goblet- and tuft cell-specific genes in ileal WT and Lyz1−/− enteroids. (E) GSEA analysis of genes related to type 2 immune response in the ileum of untreated or Abx-treated Lyz1−/− mice (N=3–4, bulk RNAseq). (F) Differential expression of IL-13-responsive genes in the ileum of untreated or Abx-treated Lyz1−/− mice. (G-H) GSEA analysis of goblet and tuft cell gene signatures in the ileum of untreated or Abx-treated Lyz1−/− mice. (I) The effects of genotyope and Abx treatment on DCLK1+ tuft cell numbers (counted from 50 villi per field of vision per mouse; N=4–5 for each condition). (J) Representative alcian blue staining of the ileum of untreated or Abx-treated Lyz1−/− mice. (K) Goblet cell numbers (counted from 50 villi per field of vision per mouse) in WT or Lyz1−/− mice treated with regular water, or water with ampicillin, vancomycin, or an Abx cocktail (N=2–4 in each group). (L) Unaltered NLR signaling gene signature in untreated or Abx-treated Lyz1−/− mice by GSEA analysis. (M) Schematic of the experimental design for panels N-O. (N-O) Representative H&E images of distal colon and colitis activitivity scores in WT and Lyz1−/− mice treated as in panel M (N=3–7 in each group). All bar graphs display mean ± SEM from at least two independent experiments. See also Figure S4.
Figure 5.
Figure 5.. Paneth cell lysozyme deficiency or overproduction alters gut microbiota composition.
(A) Bacterial loads were determined in ileal and colonic mucosa and cecal lumen in WT and Lyz1−/− mice (N=6–10 in each group). (B-H) 16S amplicon profiling of fecal or ileal luminal microbiota from WT and Lyz1−/− mice. (B) Chao1 index (alpha diversity) (fecal microbiota, n=10– 12). (C) Unweighted UniFrac analysis of fecal microbiota from WT and Lyz1−/− mice (n=14–16). (D-E) PCoA analysis of fecal microbiota with consideration for genotype and cage effect (total of 8 WTs in 3 cages; 10 Lyz1−/−s in 4 cages). (F) Mixed linear model analysis using genotype as fixed and cage as random effect. One-way ANOVA showed that cage effects contributed to differences among mice of the same genotype. (G) PCoA analysis of ileal luminal microbiota from separately housed adult Lyz1−/− and WT littermates. (H) LDA of ileal luminal bacteria with species contracting (Candidatus Arthromitus) or expanding (R. gnavus, B. gnavus, and D. formicigenerans) in Lyz1−/−mice. (I) Schematic diagram of the Villin-Lyz1TG transgenic (TG) construct. (J) Lysozyme immunohistochemistry for WT, Lyz1−/−, and TG mouse colons (representative of N>3 for each genotype). (K) Lysozyme enzymatic activity in the colonic lumen of WT, Lyz1−/−, and TG mice (N=3 for each genotype). (L) Unweighted UniFrac analysis (16S amplicon profiling) of WT and TG mouse fecal microbiota. (M) Relative phyla abundance in the feces of separately housed WT and Lyz1−/− mice (N=4–8). (N) Relative phyla abundance of WT and TG mice (N=5–6). (O) Relative abundance of R. gnavus and D. formicigenerans in WT and Lyz1−/− fecal microbiota (N=4–10 per genotype). (P) Relative abundance of R. gnavus and D. formicigenerans in WT and TG fecal microbiota (N=5–6). (Q-V) Growth sensitivity of selected bacteria to lysozyme based on OD 660nm readings. Red arrowhead indicated the addition of 200 μg/ml lysozyme (data from 2–4 independent experiments). All bar graphs display mean ± SEM from at least two independent experiments. See also Figure S5.
Figure 6.
Figure 6.. Lyz1-deficient microbiota transplanted to Lyz1-intact host, promotes inflammation in experimental colitis.
(A) Experimental design schematics. (B) PCoA showed the maintenance of diverse communities in GF mice with FMT from the 3 genotypes. (C) Averaged relative abundance of phyla in the Lyz1−/−-FMT inoculum and in the colonized WT GF mice 7 days later. (D) Relative abundance of D. formicigenerans and R. gnavus in fecal microbiota of Lyz1−/−-FMT mice, 7 and day 14 post-FMT as compared to inoculum. (E) In PERMANOVA and ANOSIM analysis, the source/genotype of the inoculum, but not the duration of colonization, determined the microbial differences. (F) Experimental design of DSS colitis in ex-GF mice after FMT with different microbiota (N=5 ex-GF mice-FMT donor genotype). (G-H) Representative H&E images of distal colons and colitis activity scores in DSS-treated ex-GF mice. (I) Body weight changes of ex-GF mice before and after DSS treatment. (J) NanoString analysis of inflammation-related gene expression in the proximal colons of ex-GF mice before and after DSS treatment. (K-L) Areg immunohistochemistry in the colons of DSS-treated ex-GF mice. (M-P) Representative pStat3 and pStat6 immunohistochemistry and semi-quantitative analysis in the colons of DSS-treated ex-GF mice (n=5 in each group). Data are represented as mean ± SEM in D, H, K, O and P from at least two independent experiments. See also Figure S6.
Figure 7.
Figure 7.. Distinct inflammatory cytokine induction by R. gnavus in lysozyme’s presence or absence.
(A) Experimental design for data in panels B-G. (B-C) Radar plots of cytokine/chemokine concentrations in the media of from WT and Lyz1−/− MLN cells stimulated by supernatants from lysozyme-treated R. gnavus (red) versus untreated live R. gnavus culture (green). (D-E) Representative dot blots and summary quantification from two independent experiments (each in 2 replicates). (F) Western blots of pStat6 and pStat3 in lysates of WT and Lyz1−/− MLN cells treated analogous to B-E. (G) Experimental design for data in panels H-K. (H-J) Bulk RNAseq of ileal mucosa 14-days after R. gnavus gavage (n=3). Increased tuft cell signature, type 2 immune response, and IL-13 response in R. gnavus colonized mice in GSEA analysis. (K) Differential expression of IL-13 responsive genes in R. gnavus-colonized Lyz1−/− compared to PBS-gavaged Lyz1−/− mice. (L) Experimental design for data in panels M-O showing that DSS colitis was induced in R. gnavus colonized WT and Lyz1−/− littermates following Abx treatment. (M) Body weight changes during DSS exposure and recovery in Abx-precleared WT and Lyz1−/− mice with or without R. gnavus association (n number indicated; 2 independent experiments). (N) Colitis activity scores in the colon of DSS-treated Lyz1−/− mice with or withour R. gnavus association. (O) Representative H. & E. images of DSS colons of Abx-treated and R. gnavus colonized WT and Lyz1−/− mice. All bar graphs display mean ± SEM. See also Figure S7.

Comment in

References

    1. Afgan E, Baker D, Batut B, van den Beek M, Bouvier D, Cech M, Chilton J, Clements D, Coraor N, Gruning BA, et al. (2018). The Galaxy platform for accessible, reproducible and collaborative biomedical analyses: 2018 update. Nucleic Acids Res 46, W537–W544. - PMC - PubMed
    1. Ashburner M, Ball CA, Blake JA, Botstein D, Butler H, Cherry JM, Davis AP, Dolinski K, Dwight SS, Eppig JT, et al. (2000). Gene ontology: tool for the unification of biology. The Gene Ontology Consortium. Nat Genet 25, 25–29. - PMC - PubMed
    1. Balasubramanian I, and Gao N (2017). From sensing to shaping microbiota: insights into the role of NOD2 in intestinal homeostasis and progression of Crohn’s disease. Am J Physiol Gastrointest Liver Physiol 313, G7–G13. - PMC - PubMed
    1. Bel S, Pendse M, Wang Y, Li Y, Ruhn KA, Hassell B, Leal T, Winter SE, Xavier RJ, and Hooper LV (2017). Paneth cells secrete lysozyme via secretory autophagy during bacterial infection of the intestine. Science 357, 1047–1052. - PMC - PubMed
    1. Biton M, Haber AL, Rogel N, Burgin G, Beyaz S, Schnell A, Ashenberg O, Su CW, Smillie C, Shekhar K, et al. (2018). T Helper Cell Cytokines Modulate Intestinal Stem Cell Renewal and Differentiation. Cell 175, 1307–1320 e1322. - PMC - PubMed

Publication types

Supplementary concepts