. 2020 Sep 1;119(5):950-965.
doi: 10.1016/j.bpj.2020.07.023. Epub 2020 Aug 5.

Interplay of Disorder and Sequence Specificity in the Formation of Stable Dynein-Dynactin Complexes

Affiliations

Interplay of Disorder and Sequence Specificity in the Formation of Stable Dynein-Dynactin Complexes

Nikolaus M Loening et al. Biophys J. .

Abstract

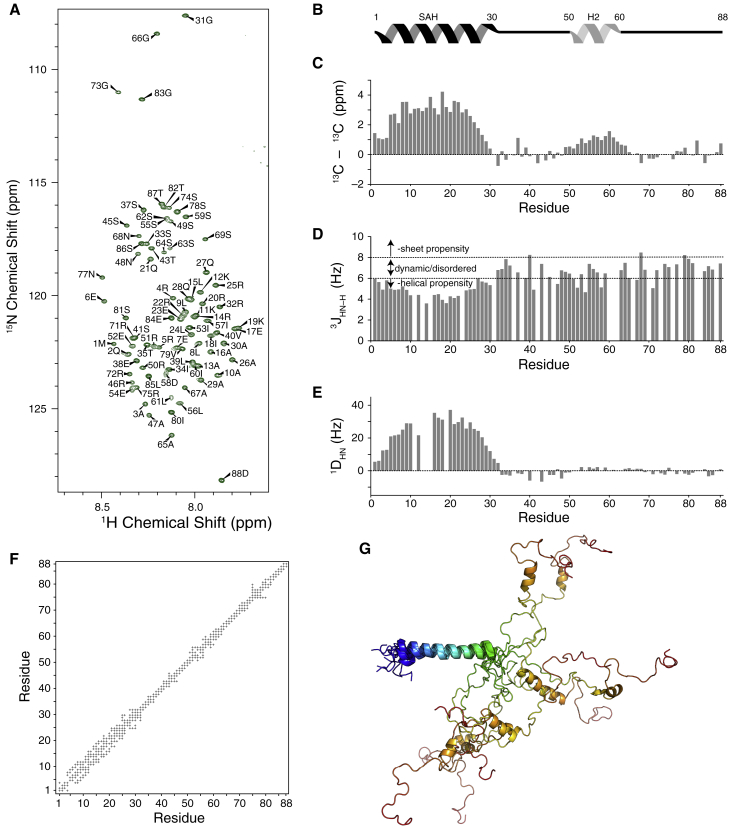
Cytoplasmic dynein is a eukaryotic motor protein complex that, along with its regulatory protein dynactin, is essential to the transport of organelles within cells. The interaction of dynein with dynactin is regulated by binding between the intermediate chain (IC) subunit of dynein and the p150Glued subunit of dynactin. Even though in the rat versions of these proteins this interaction primarily involves the single α-helix region at the N-terminus of the IC, in Drosophila and yeast ICs the removal of a nascent helix (H2) downstream of the single α-helix considerably diminishes IC-p150Glued complex stability. We find that for ICs from various species, there is a correlation between disorder in H2 and its contribution to binding affinity, and that sequence variations in H2 that do not change the level of disorder show similar binding behavior. Analysis of the structure and interactions of the IC from Chaetomium thermophilum demonstrates that the H2 region of C. thermophilum IC has a low helical propensity and establishes that H2 binds directly to the coiled-coil 1B (CC1B) domain of p150Glued, thus explaining why H2 is necessary for tight binding. Isothermal titration calorimetry, circular dichroism, and NMR studies of smaller CC1B constructs localize the region of CC1B most essential for a tight interaction with IC. These results suggest that it is the level of disorder in H2 of IC along with its charge, rather than sequence specificity, that underlie its importance in initiating tight IC-p150Glued complex formation. We speculate that the nascent H2 helix may provide conformational flexibility to initiate binding, whereas those species that have a fully folded H2 have co-opted an alternative mechanism for promoting p150Glued binding.


Figures

Figure 1
Figure 1
Dynein intermediate chain and dynactin p150Glued domain architecture. (A) ICs from rat (IC-2C), Drosophila (Dros IC), and yeast (IC homolog Pac 11) have an N-terminal single α-helix (SAH) as well as a second helix (H2 (8,13,21)). H2 is either fully formed (black helix) or transient/nascent (gray helix). Rat and Drosophila ICs have binding sites for three light chains (Tctex, LC8, and LC7), whereas the yeast IC has binding sites for two copies of an LC8 homolog (DYN2). The C-terminal region for all ICs studied is predicted to contain seven WD40 repeat domains. (B) The IC from C. thermophilum (CT IC) is predicted to have an α-helical SAH region and a nascent helix in the H2 region. Based on sequence motifs, the Tctex, LC8, and LC7 binding sites are predicted to be in regions similar to Dros IC. IC88 and IC35 are the constructs used in this work. (C) Mammalian p150Glued has a Cap-Gly domain near the N-terminus and two coiled-coil domains, CC1 and CC2, that are separated by an intercoil domain (ICD). CC1 is further divided into two regions called CC1A and CC1B. The construct p150 was used in previous studies. (D) CT p150Glued is predicted to have similar domains as mammalian p150Glued. The COILS Server prediction tool was used to predict the coiled-coil propensity of each residue in the CC1B region (p150ABC), which informed the selection of the smaller p150Glued constructs. To see this figure in color, go online.
Figure 2
Figure 2
Disorder in H2 is species dependent. (A) Residue-level percent helicity predictions generated using the Agadir algorithm for the first 100 amino acids of IC from H. sapiens (human), D. rerio (zebrafish), C. milii (Australian ghostshark), O. bimaculoides (Californian two-spot octopus), C. elegans (nematode), and CT (thermophilic fungus). The insets for O. bimaculoides and CT show detail for the predicted H2 region. (B) The top graphs show the percent helicity prediction for the ICs from R. norvegicus (rat), D. melanogaster (fruit fly), and S. cerevisiae (yeast). The insets for Drosophila and yeast show detail for the predicted H2 region. The bottom graphs show NMR secondary chemical shift data for IC constructs from rat, Drosophila, and yeast from prior studies (8,13,21). (C) Sequence alignments of ICs from chordates (human, rat, zebrafish, and shark) and from nonchordates (octopus, fruit fly, CT, and yeast) using the MAFFT alignment program (58, 59, 60). Highlighted residues show predicted (light blue) and experimentally determined (dark blue) H2 regions. Identical (asterisk), strongly similar (colon), and weakly similar (period) residues are shown at the bottom of each alignment. To see this figure in color, go online.
Figure 3
Figure 3
CD spectra of IC35 and IC88 at 15°C. The CD spectrum of IC35 (A) shows double minima at 222 and 208 nm consistent with a completely helical structure, whereas the shift of the first minimum for IC88 (B) to 205 nm suggests that its structure consists of a mixture of helical and disordered regions. FH indicates the fractional helicity estimated at 222 nm using Eq. 1.
Figure 4
Figure 4
NMR assignments, secondary chemical shifts, couplings, and structural ensemble for IC88. (A) 15N-1H TROSY-HSQC spectrum of IC88 acquired at 800 MHz for 1H showing assignments for the amide resonances. (B) Schematic structure for IC88 showing the location of the α-helical SAH region and the nascent α-helix H2 region. (C) Secondary chemical shifts for IC88; clusters of residues with positive values correspond to α-helical regions, whereas values close to zero correspond to intrinsically disordered regions. (D) Three-bond HN-Hα scalar coupling constants for IC88 calculated using cross-peak/diagonal peak intensity ratios from a 3D HNHA experiment. The predominance of coupling values between 6 and 8 Hz for residues 30–88 is consistent with those residues being dynamic or disordered. (E) One-bond H-N residual dipolar couplings measured using an IC88 sample in a stretched gel. The cluster of positive values for residues 1–30 is consistent with this region forming a stable α-helix. (F) NOE contact map for IC88 after using ARIA to assign NOE peaks. Most of the NOE contacts are either intraresidue or sequential (i ± 1). The pattern of medium-range contacts (i ± 3 and i ± 4) observed in the SAH region (residues 1–30) is consistent with α-helical secondary structure. (G) IC88 structural ensemble calculated using a combination of NOE restraints, scalar coupling-based torsion angle restraints, residual dipolar couplings, and chemical shift-based torsion angle restraints. The 20 lowest-energy structures from 50 structures calculated in the final iteration of the ARIA protocol were then refined in explicit water and used to generate the ensemble. The N-terminus is colored blue, whereas the C-terminus (residue 88) is colored red. For purposes of clarity, only 10 of the 20 structures used to define the structural ensemble are shown here, with residues 5–25 aligned. To see this figure in color, go online.
Figure 5
Figure 5
NMR relaxation and chemical exchange data for IC88. IC88 NMR relaxation data acquired at 800 MHz for 1H include (A) 15N longitudinal relaxation rates, (B) 15N transverse relaxation rates, and (C) {1H} 15N heteronuclear NOE enhancements. The location of proline residues, which do not provide a signal in these experiments, are indicated by “P.” The ratio of the transverse and the longitudinal relaxation rates (R2/R1) shown in (D) is expected to be close to unity for portions of IC88 that have a short correlation time (i.e., regions that are highly dynamic), whereas larger values for this ratio are observed for more rigid regions. (E) Chemical exchange data for IC88 measured using CLEANEX-PM; positive values indicate amide protons that exchange with the solvent, whereas zero or near-zero values indicate amide protons that are protected from exchange. The stretches of near-zero values for residues 3–30 and 50–60 are consistent with α-helical secondary structures in these regions. For (A) and (B) the error bars are the standard errors of the R1 and R2 values derived from fitting the data; for (C) the error bars are from propagating the root-mean-square deviations of the noise floors of the saturated and control spectra; for (D) the error bars are derived from propagating the errors in the R1 and R2 values.
Figure 6
Figure 6
Identification of minimal sequence requirements for folding and binding using CD, ITC, and NMR titrations. (A) CD spectra at 25°C for p150ABC, p150AB, p150BC, p150A, p150B, and p150C; FH indicates the fractional helicity estimated at 222 nm using Eq. 1. The colored bars above the CD spectra graphically represent the portion of the CC1B region (residues 478–680) used for each construct. (B) ITC thermograms (top) and binding isotherms (bottom) from titrations of p150ABC, p150AB, p150BC, p150A, p150B, and p150C with IC88. (C) 1H-15N spectra peak volume ratios from titrations of 15N-labeled IC88 with unlabeled p150ABC, p150AB, p150BC, p150A, p150B, and p150C. All data were acquired at 800 MHz for 1H. Samples for p150ABC, p150A, and p150C were at an IC to ligand molar ratio of ∼1:1. Samples for p150AB, p150BC, and p150B were at an IC to ligand molar ratio of 1:1.2. To see this figure in color, go online.
Figure 7
Figure 7
Interactions of CT IC constructs with p150ABC. (A) Representative thermograms (top) and binding isotherms (bottom) from ITC titrations of IC88 (left), IC35 (middle), and IC88C (right) with p150ABC collected at 25°C (pH 7.5). (B) The sequence for IC88 illustrating which amino acids in the H2 region are replaced in the IC88C construct. The IC35 construct consists of the N-terminal 35 amino acids of IC88, and the IC37–88 construct consists of the C-terminal 52 amino acids of IC88. Basic residues (K, R) and acidic residues (D, E) are indicated in blue and red, respectively. (C) SV-AUC of free p150ABC (80 μM, blue dashed line) and the SEC-purified IC88-p150ABC complex (60 μM, green solid line) shows that IC88-p150ABC forms a stable complex with an apparent single oligomeric state. No data are collected for IC88 for comparison because it has no absorbance at 280 nm. (D) 1H-15N spectra peak volume ratios from titrations of 240 μM 15N-labeled IC37–88 with unlabeled p150ABC acquired at 600 MHz for 1H. Samples were prepared with a substoichiometric (1:0.5, blue) or a stoichiometric (1:1, green) ratio of IC to p150ABC. The location of the four prolines in IC37–88 are indicated by “P.” To see this figure in color, go online.
Figure 8
Figure 8
Complex-dependent secondary structure stability detected using temperature-dependent CD. (A) CD signal (in millidegrees, mdeg) as a function of temperature at 220 nm for IC88, p150ABC, IC88 bound with p150ABC, and IC35 bound with p150ABC. The curves on this graph are scaled so that they align at low temperatures. (BF) Temperature-dependent CD spectra of (B) IC35, (C) IC88, (D) p150ABC, (E) IC35-p150ABC, and (F) IC88-p150ABC collected at temperatures between 5 and 50°C. To see this figure in color, go online.
Figure 9
Figure 9
Models for the binding interaction between IC and p150Glued. (A) Current model for IC-p150Glued binding, in which only the SAH region interacts directly with the p150Glued CC1B region (13,21). (B) New model based on our NMR results for CT IC-p150Glued binding, in which both the SAH and H2 regions directly interact with p150Glued. For clarity, only a small portion of the ∼200-amino-acid-long p150Glued CC1B region is shown. (C) The observation of nonspecific electrostatic interactions between H2 and p150Glued CC1B suggest a speculative model in which H2 is able to interact nonspecifically with the CC1B region of p150Glued until the SAH region locks to a specific binding site, resulting in the configuration modeled in (B). To see this figure in color, go online.

References

    1. Kardon J.R., Vale R.D. Regulators of the cytoplasmic dynein motor. Nat. Rev. Mol. Cell Biol. 2009;10:854–865. - PMC - PubMed
    1. Vallee R.B., McKenney R.J., Ori-McKenney K.M. Multiple modes of cytoplasmic dynein regulation. Nat. Cell Biol. 2012;14:224–230. - PubMed
    1. Reck-Peterson S.L., Redwine W.B., Carter A.P. The cytoplasmic dynein transport machinery and its many cargoes. Nat. Rev. Mol. Cell Biol. 2018;19:382–398. - PMC - PubMed
    1. Kini A.R., Collins C.A. Modulation of cytoplasmic dynein ATPase activity by the accessory subunits. Cell Motil. Cytoskeleton. 2001;48:52–60. - PubMed
    1. Makokha M., Hare M., Barbar E. Interactions of cytoplasmic dynein light chains Tctex-1 and LC8 with the intermediate chain IC74. Biochemistry. 2002;41:4302–4311. - PubMed

Publication types

Supplementary concepts

LinkOut - more resources