. 2020 Sep 1;119(5):1002-1014.
doi: 10.1016/j.bpj.2020.07.020. Epub 2020 Aug 3.

A Stochastic Model of Gene Expression with Polymerase Recruitment and Pause Release

Affiliations

A Stochastic Model of Gene Expression with Polymerase Recruitment and Pause Release

Zhixing Cao et al. Biophys J. .

Abstract

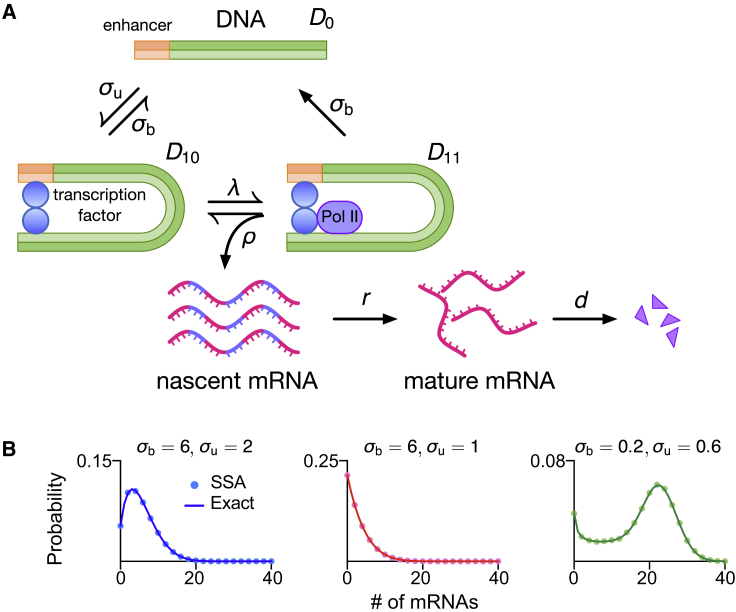
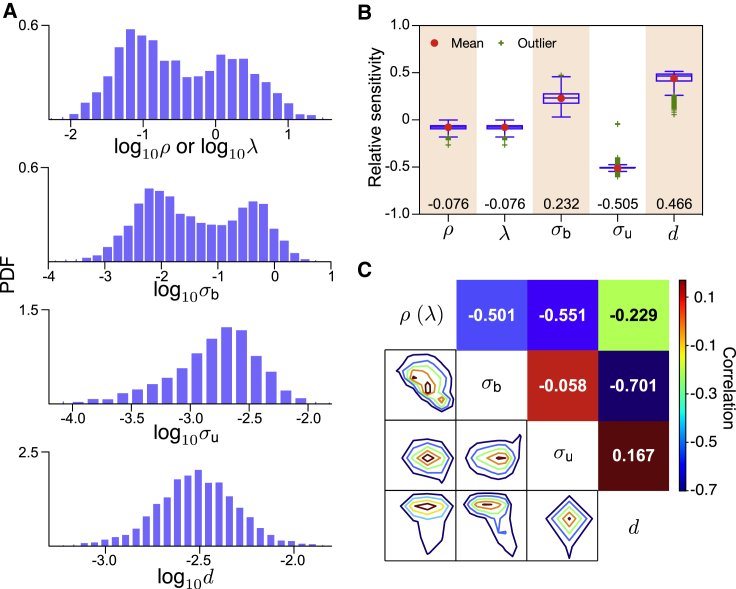
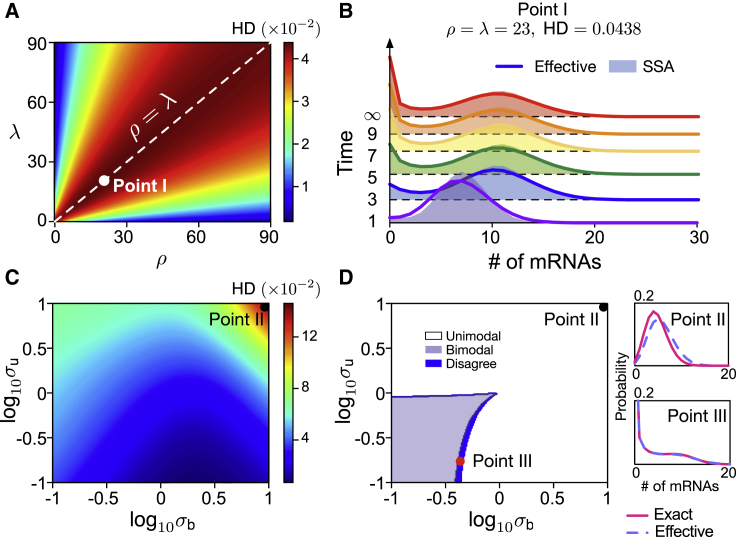
Transcriptional bursting is a major source of noise in gene expression. The telegraph model of gene expression, whereby transcription switches between on and off states, is the dominant model for bursting. Recently, it was shown that the telegraph model cannot explain a number of experimental observations from perturbation data. Here, we study an alternative model that is consistent with the data and which explicitly describes RNA polymerase recruitment and polymerase pause release, two steps necessary for messenger RNA (mRNA) production. We derive the exact steady-state distribution of mRNA numbers and an approximate steady-state distribution of protein numbers, which are given by generalized hypergeometric functions. The theory is used to calculate the relative sensitivity of the coefficient of variation of mRNA fluctuations for thousands of genes in mouse fibroblasts. This indicates that the size of fluctuations is mostly sensitive to the rate of burst initiation and the mRNA degradation rate. Furthermore, we show that 1) the time-dependent distribution of mRNA numbers is accurately approximated by a modified telegraph model with a Michaelis-Menten like dependence of the effective transcription rate on RNA polymerase abundance, and 2) the model predicts that if the polymerase recruitment rate is comparable or less than the pause release rate, then upon gene replication, the mean number of RNA per cell remains approximately constant. This gene dosage compensation property has been experimentally observed and cannot be explained by the telegraph model with constant rates.


Figures

Figure 1
Figure 1
(A) Schematic of the stochastic multiscale transcriptional bursting model. (B) Analytical distribution for mature mRNA numbers (under the assumption of short-lived nascent mRNA) is given by Eq. 6 and agrees with stochastic simulations using the SSA. The kinetic parameters are ρ = 60, λ = 40, and d = 1; other parameters are indicated in each panel. To see this figure in color, go online.
Figure 2
Figure 2
Relative sensitivity analysis of the coefficient variation CV¯ of mRNA noise over five kinetic parameters for 3575 genes of CAST allele data for mouse fibroblasts. (A) Distributions of the kinetic parameters in the dataset (obtained from (3)); values of ρ or λ are calculated using Eq. 8. (B) Box plots indicate the median (values shown at bottom), the 25% and 75% quantiles, and mean and outliers of relative sensitivity. (C) Joint distributions and Pearson correlation between the relative sensitivity vectors for each pair of parameters suggest that (σb, σu) and (σu, d) are the least-dependent pairs. To see this figure in color, go online.
Figure 3
Figure 3
An effective telegraph model (given by reaction scheme (11)) approximates the distribution of mRNA numbers of the multiscale model. (A) Hellinger distance (HD) between steady-state distributions of mRNA numbers for the effective telegraph model and the multiscale model as a function of ρ and λ with σu = 0.2, σb = 0.1, and d = 1. The discrepancy between the two distributions grows as ρ and λ approach the line ρ = λ. (B) Shown is the time-dependent distributions for Point I in (A) (the point with the largest HD) predicted by the effective model compared to those computed by the SSA for the multiscale model. (C) Heat map of HD between both distributions as a function of σb and σu with ρ = λ = 23 and d = 1. (D) Stochastic bifurcation diagram for the number of modes of the steady-state distributions predicted by the two models. The small dark blue region is where modality of both models disagree. Insets show distributions corresponding to the points marked in (C and D). To see this figure in color, go online.
Figure 4
Figure 4
Effective telegraph model approximation for the refractory model. (A) Schematics of both models. (B) Hellinger distance between the steady-state distributions of mRNA numbers predicted by both models and a bifurcation diagram of their number of modes (black lines) as a function of σu and λ with σb = 0.8, ρu = 30, and d = 1. (C) Distributions for Points I and II in (B), showing significant disagreement in the height of the zero mode (insets show a zoom at the mode at zero). To see this figure in color, go online.

References

    1. Bahar Halpern K., Tanami S., Itzkovitz S. Bursty gene expression in the intact mammalian liver. Mol. Cell. 2015;58:147–156. - PMC - PubMed
    1. Suter D.M., Molina N., Naef F. Mammalian genes are transcribed with widely different bursting kinetics. Science. 2011;332:472–474. - PubMed
    1. Larsson A.J.M., Johnsson P., Sandberg R. Genomic encoding of transcriptional burst kinetics. Nature. 2019;565:251–254. - PMC - PubMed
    1. Zenklusen D., Larson D.R., Singer R.H. Single-RNA counting reveals alternative modes of gene expression in yeast. Nat. Struct. Mol. Biol. 2008;15:1263–1271. - PMC - PubMed
    1. Sanchez A., Golding I. Genetic determinants and cellular constraints in noisy gene expression. Science. 2013;342:1188–1193. - PMC - PubMed

Publication types

LinkOut - more resources