. 2020 Dec;159(6):2203-2220.e14.
doi: 10.1053/j.gastro.2020.08.015. Epub 2020 Aug 16.

Cooperation Between Distinct Cancer Driver Genes Underlies Intertumor Heterogeneity in Hepatocellular Carcinoma

Affiliations

Cooperation Between Distinct Cancer Driver Genes Underlies Intertumor Heterogeneity in Hepatocellular Carcinoma

Pedro Molina-Sánchez et al. Gastroenterology. 2020 Dec.

Abstract

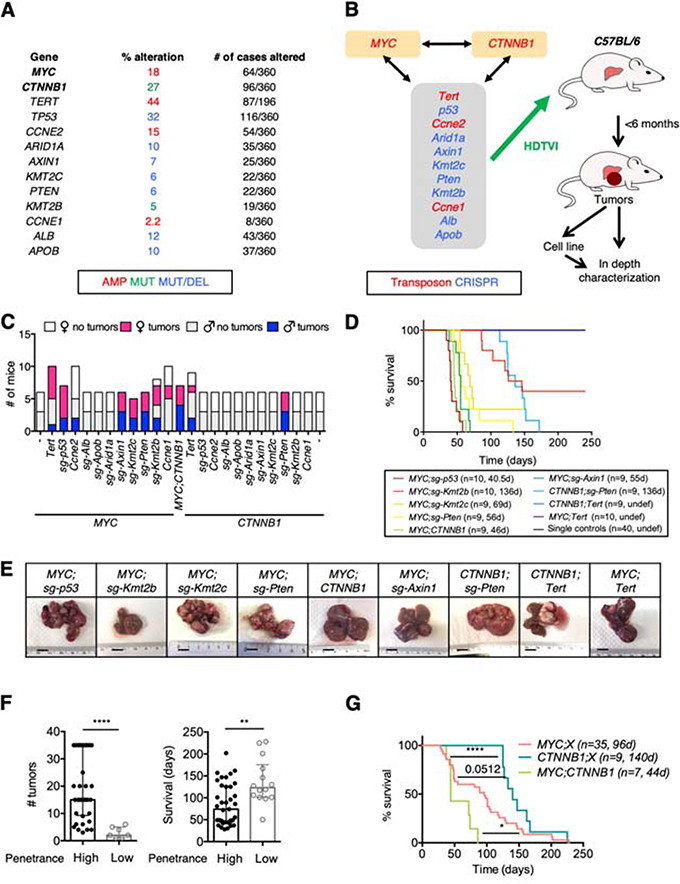
Background and aims: The pattern of genetic alterations in cancer driver genes in patients with hepatocellular carcinoma (HCC) is highly diverse, which partially explains the low efficacy of available therapies. In spite of this, the existing mouse models only recapitulate a small portion of HCC inter-tumor heterogeneity, limiting the understanding of the disease and the nomination of personalized therapies. Here, we aimed at establishing a novel collection of HCC mouse models that captured human HCC diversity.

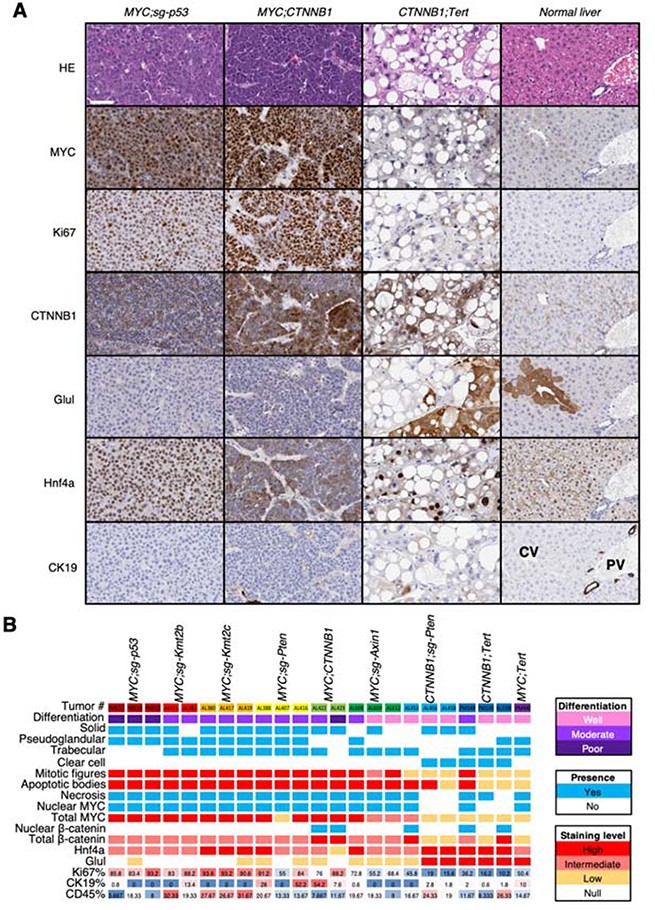
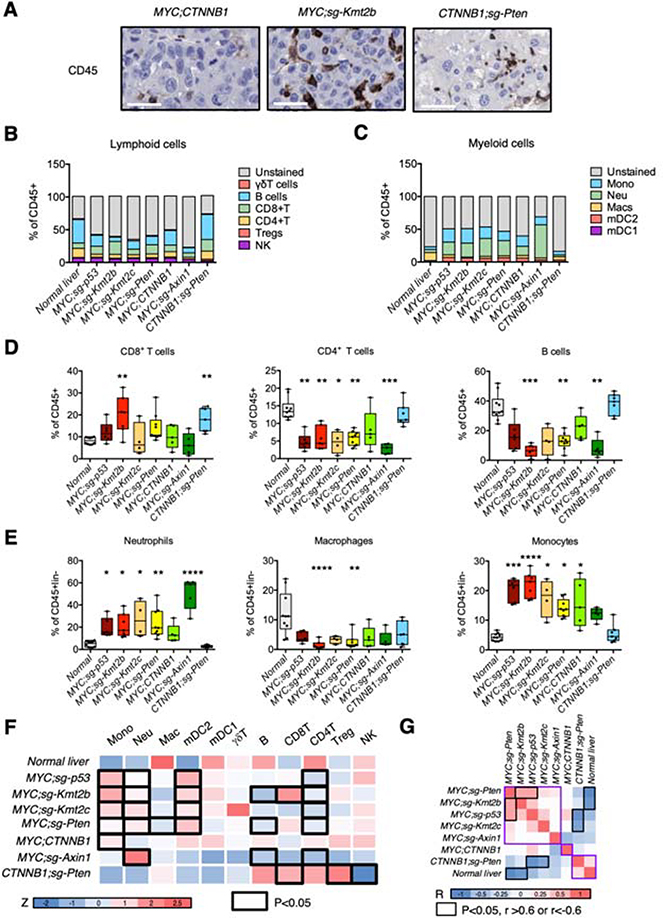
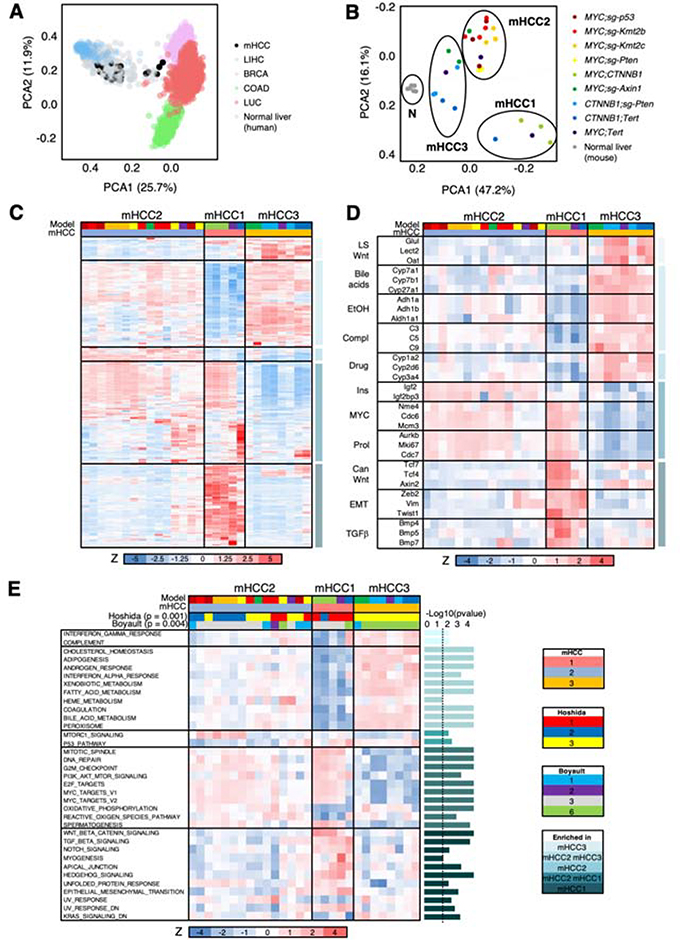
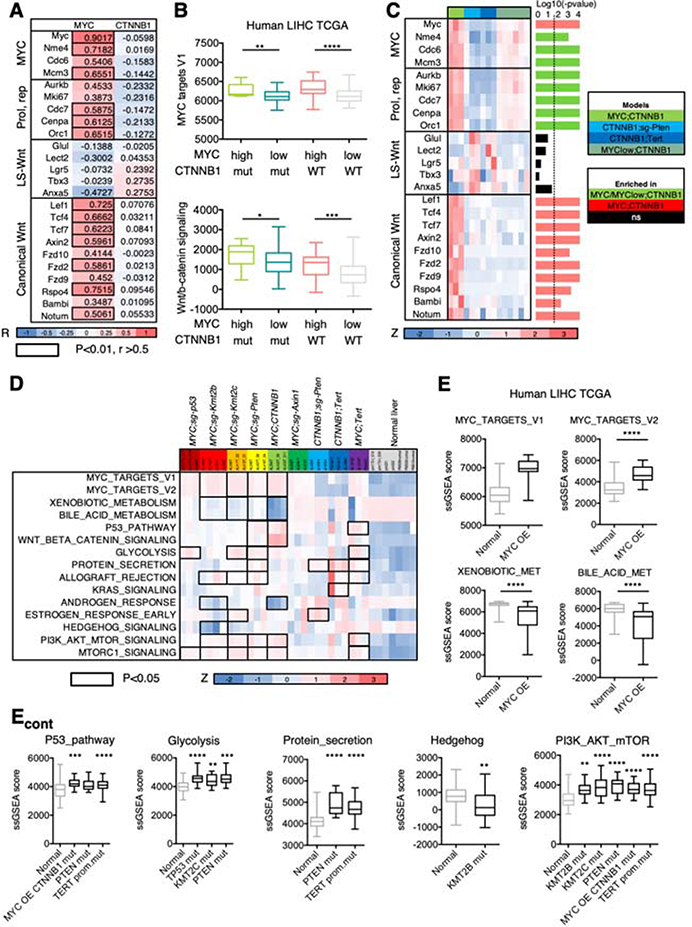
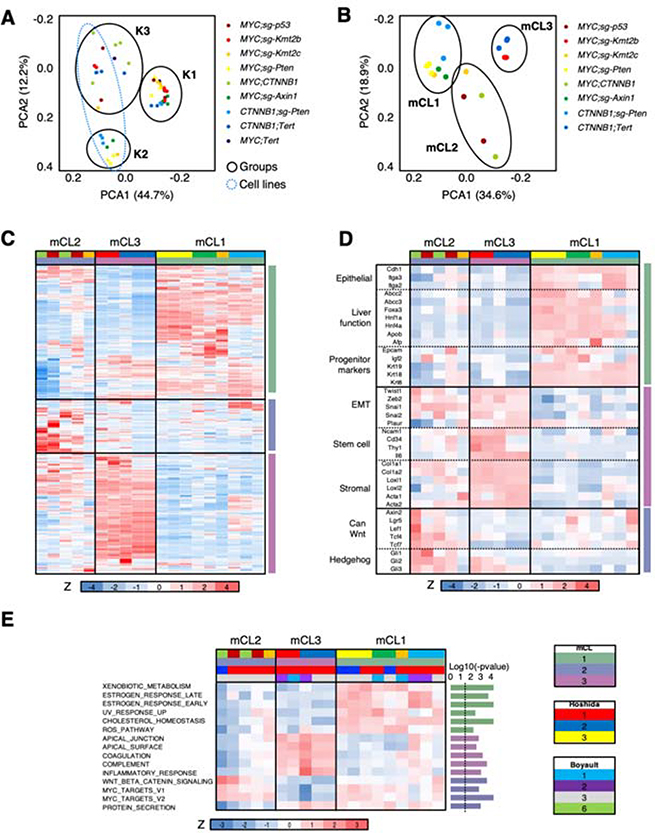
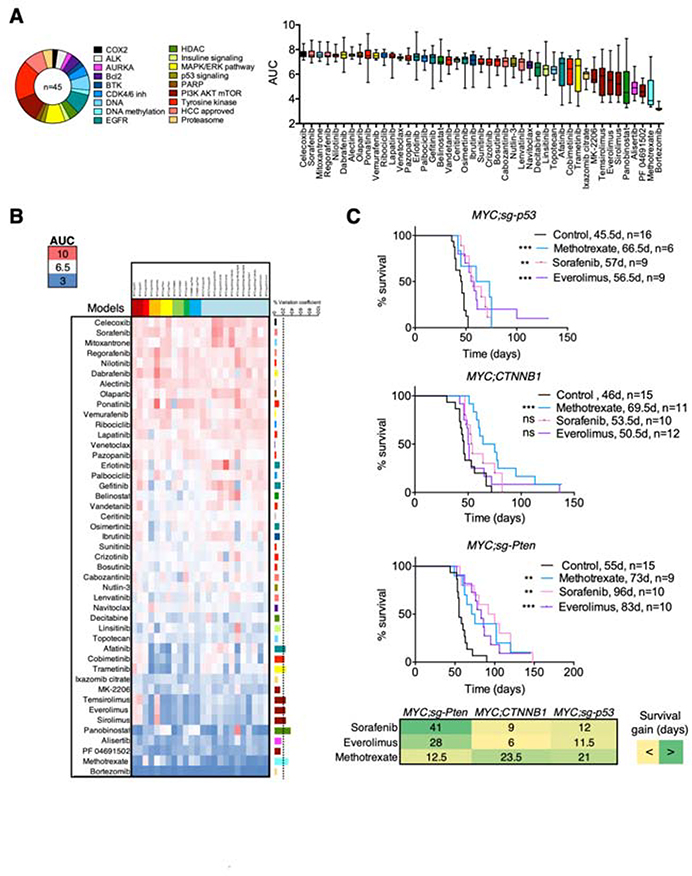
Methods: By performing hydrodynamic tail-vein injections, we tested the impact of altering a well-established HCC oncogene (either MYC or β-catenin) in combination with an additional alteration in one of eleven other genes frequently mutated in HCC. Of the 23 unique pairs of genetic alterations that we interrogated, 9 were able to induce HCC. The established HCC mouse models were characterized at histopathological, immune, and transcriptomic level to identify the unique features of each model. Murine HCC cell lines were generated from each tumor model, characterized transcriptionally, and used to identify specific therapies that were validated in vivo.

Results: Cooperation between pairs of driver genes produced HCCs with diverse histopathology, immune microenvironments, transcriptomes, and drug responses. Interestingly, MYC expression levels strongly influenced β-catenin activity, indicating that inter-tumor heterogeneity emerges not only from specific combinations of genetic alterations but also from the acquisition of expression-dependent phenotypes.

Conclusions: This novel collection of murine HCC models and corresponding cell lines establishes the role of driver genes in diverse contexts and enables mechanistic and translational studies.

Keywords: Cancer Driver Genes; Cooperation; Intertumor Heterogeneity; Mouse Models.


Figures

Figure 1.
Figure 1.. In vivo screen identifies cooperating driver genes in HCC.
(A) Frequency of alteration of selected genes in HCC patients from the TCGA cohort. (B) Schematic of experimental approach. The genes in the grey box were tested in combination with MYC overexpression or activation of β-catenin (encoded by CTNNB1). The combination of MYC overexpression and β-catenin activation was also tested. HDTVI, hydrodynamic tail-vein injection. (C) Number of C57BL/6 female and male mice that developed tumors within 6 months after HDTVI. (D) Survival graph of the corresponding conditions in C57BL/6 male mice. Median survival and number of mice per group are shown. D, days; undef, undefined. Single controls include MYC, CTNNB1, TERT, sg-p53, sg-Axin1, sg-Pten, sg-Kmt2c, and sg-Kmt2b alone models (5 male mice each). (E) Representative pictures of livers from mice from different conditions showing macroscopic tumors. Bar, 1 cm. (F) Number of tumors (left) and survival (right) in models with high (> 30%) or low (< 30%) penetrance. Median with interquartile range is shown. Mann-Whitney test. Mice from (C). (G) Survival graph of combined models with MYC overexpression (MYC;X), β-catenin activation (CTNNB1;X), and MYC;CTNNB1 model. Median survival and number of mice per group are shown. X denotes “other alteration”. D, days. Log-rank Mantel-Cox test. Mice from (C).
Figure 2.
Figure 2.. Cooperation between distinct driver genes leads to HCC with unique histologies.
(A) Stainings for the indicated markers in tumors from representative models and mice. An illustrative normal liver is also included. HE, hematoxylin & eosin. The white bar represents 50 μm. (B) Heatmap summarizing different parameters and staining outcomes in tumor samples from different mice and models. Each column represents a mouse. Color code is on the right.
Figure 3.
Figure 3.. Cooperation between distinct driver genes leads to unique immune landscapes.
(A) Staining for immune cell marker CD45 in tumors from representative models and mice. The white bar represents 50 μm. (B-C), Frequency of different lymphoid (B) and myeloid (C) immune cell populations in tumors from different mouse models and normal liver. (D-E), Box and whisker plots representing different lymphoid (D) and myeloid (E) immune cell populations (% over CD45+ (lymphoid) or CD45+lin− (myeloid), respectively) in tumors and normal liver. Anova (Kruskal Wallis) test and multiple comparison to normal liver. (F) Heatmap summarizing the average of the % of immune cells (transformed to Z score) in the total CD45+ or CD45+lin− cells in different tumor models and normal liver. The black outline represents significant models when compared to normal liver (summary of D-E; Supplementary Figure 3A). Color code is shown under the heatmap and represents the Z score. (G) Correlation matrix between different models based on the immune profiles. Color code is shown under the heatmap. The correlation values that are higher than 0.6 and with a P-value lower than 0.05 are highlighted with the black outline. R, Pearson correlation coefficient. Mono, monocytes; neu, neutrophils; mac, macrophages; mDC2, myeloid dendritic cells type 2; mDC1, myeloid dendritic cells type 1; Treg, regulatory T cells; NK, natural killer cells.
Figure 4.
Figure 4.. Novel genetically-defined murine HCC models recapitulate human HCC transcriptional subclasses.
(A) PCA analysis of gene expression profiles of human HCCs (LIHC), breast cancers (BRCA), lung squamous carcinomas and lung adenocarcinomas (LUC), colorectal adenocarcinomas (COAD), normal human liver, and murine HCC (mHCCs). (B) PCA analysis of gene expression profiles of murine HCC (mHCCs) and normal murine livers. (C) Heatmap of the 2,500 most differentially expressed genes in murine HCCs (mHCCs). Z score is shown. Color code is shown under the heatmap and in (B) and (E). (D) Heatmap of 32 selected genes from the 2,500 most differentially expressed genes in murine HCCs (mHCCs) in (C). Z score is shown. Color code is shown under the heatmap and in (B) and (E). LS, liver-specific; EtOH, ethanol; compl, complement; ins, insulin; prol, proliferation; can, canonical; EMT, epithelial-to-mesenchymal transition. (E) Heatmap of ssGSEA values (shown as Z score) for significant pathways in the different murine HCCs. The P-value for each gene set is shown in the right (bar graph) (Anova). The dotted line indicates the threshold for significance after applying Benjamini-Hochberg multiple testing correction (p < 0.03). Color code is shown under the heatmap. For Hoshida and Boyault subclasses, the association Chi test value is shown.
Figure 5.
Figure 5.. Inter-tumor heterogeneity is shaped by oncogene expression levels and specific cooperating events.
(A) Heatmap showing the Pearson R values for the correlation between transposon-driven MYC or CTNNB1 mRNA levels and expression of the indicated genes. Color code is shown under the heatmap. The correlation values that are higher than 0.5 and with a P-value lower than 0.01 are highlighted with the black outline. R, Pearson correlation coefficient. LS, liver specific; Prol, proliferation; rep, replication. (B) Box and whisker plot representing ssGSEA values for MYC targets and Wnt/β-catenin signatures in HCC patients stratified depending on the MYC mRNA levels (high, 1st quartile; low, 2nd-4th quartiles) and CTNNB1 mutational status (mut, mutated; WT, wild-type). Mann-Whitney test. MYC high CTNNB1 mutant n=15; MYC low CTNNB1 mutant n=34; MYC high CTNNB1 wild-type n=30; MYC low CTNNB1 mutant n=104. (C) Heatmap of gene expression values (shown as Z score) in the different murine HCCs expressing β-catenin. The P-value for each gene is shown in the right (bar graph) (Anova). The dotted line indicates the threshold for significance after applying Benjamini-Hochberg multiple testing correction (p < 0.019). Color code is shown under the heatmap and on the right. (D) Heatmap of ssGSEA values (shown as Z score) for representative pathways in the different murine HCCs and normal livers. Color code is shown under the heatmap. Black outlines indicate gene sets that are significantly different in the corresponding model compared to normal liver (Anova test). (E) Bar graphs showing the ssGSEA score in human HCC samples from TCGA with genetic alterations in the indicated gene and compared to normal livers from GTEX. Mann-Whitney test or Anova test. MYC OE (overexpression) n=31, normal liver n=136; MYC OE CTNNB1 mut (mutant) n=16; PTEN mut n=12; TERT prom.mut (promoter mutation) n=80; TP53 mut n=58; KMT2C mut n=16; KMT2B mut n=12.
Figure 6.
Figure 6.. Novel murine HCC cell lines recapitulate the most aggressive HCC subclasses.
(A) PCA analysis of gene expression profiles of murine HCC tumors and cell lines. (B) PCA analysis of gene expression profiles of murine HCC cell lines (mCLs). (C) Heatmap of the 2,500 most differentially expressed genes in murine HCC cell lines (mCLs). Z score is shown. Color code is shown under the heatmap and in (B) and (E). (D) Heatmap of selected genes from the 2,500 most differentially expressed genes in murine HCC cell lines (mCLs) in (C). Z score is shown. Color code is shown under the heatmap and in (B) and (E). EMT, epithelial-to-mesenchymal transition; can, canonical. (E) Heatmap of ssGSEA values (shown as Z score) for significant pathways in the different murine HCC cell lines (mCLs). The P-value for each gene set is shown in the right (bar graph) (Anova). The dotted line indicates the threshold for significance after applying Benjamini-Hochberg multiple testing correction (p < 0.03). Color code is shown under the heatmap.
Figure 7.
Figure 7.. Cooperation between distinct driver genes leads to unique drug responses.
(A) Schematic of the inhibitors used in the drug screen. The number indicates the number of inhibitors in each class, and the name, the target of the inhibitors. On the right, area under the curve (AUC) is used as a measure of drug activity (high AUC, less activity) in the panel of 24 murine HCC cell lines. Box and whisker plot of AUC per each drug in the panel of cell lines. (B) Heatmap representing the AUC of each drug in each cell line. Color code is shown in the left. The coefficient of variance (CV) is shown in the right. (C) Survival graphs of the corresponding mouse models treated with sorafenib, methotrexate, and everolimus. The number of mice per group and median survival is shown. Mantel-Cox test. **p < 0.01, ***p < 0.001. Ns, not significant. Below, gain in median survival (in days) between each treatment and the control group for each model. Green, more survival gain; yellow, less survival gain.

References

    1. Villanueva A Hepatocellular Carcinoma. N Engl J Med 2019;380:1450–1462. - PubMed
    1. Zhu S, Hoshida Y. Molecular heterogeneity in hepatocellular carcinoma. Hepat Oncol 2018;5:HEP10. - PMC - PubMed
    1. Schulze K, Imbeaud S, Letouze E, et al. Exome sequencing of hepatocellular carcinomas identifies new mutational signatures and potential therapeutic targets. Nat Genet 2015;47:505–11. - PMC - PubMed
    1. Network. CGAR. Comprehensive and Integrative Genomic Characterization of Hepatocellular Carcinoma. Cell 2017;169:1327–1341 e23. - PMC - PubMed
    1. Totoki Y, Tatsuno K, Yamamoto S, et al. High-resolution characterization of a hepatocellular carcinoma genome. Nat Genet 2011;43:464–9. - PubMed

Publication types

MeSH terms