. 2021 Jan;160(1):232-244.e7.
doi: 10.1053/j.gastro.2020.08.017. Epub 2020 Aug 16.

Transcription and DNA Methylation Patterns of Blood-Derived CD8+ T Cells Are Associated With Age and Inflammatory Bowel Disease But Do Not Predict Prognosis

Affiliations

Transcription and DNA Methylation Patterns of Blood-Derived CD8+ T Cells Are Associated With Age and Inflammatory Bowel Disease But Do Not Predict Prognosis

Marco Gasparetto et al. Gastroenterology. 2021 Jan.

Abstract

Background & aims: Gene expression patterns of CD8+ T cells have been reported to correlate with clinical outcomes of adults with inflammatory bowel diseases (IBD). We aimed to validate these findings in independent patient cohorts.

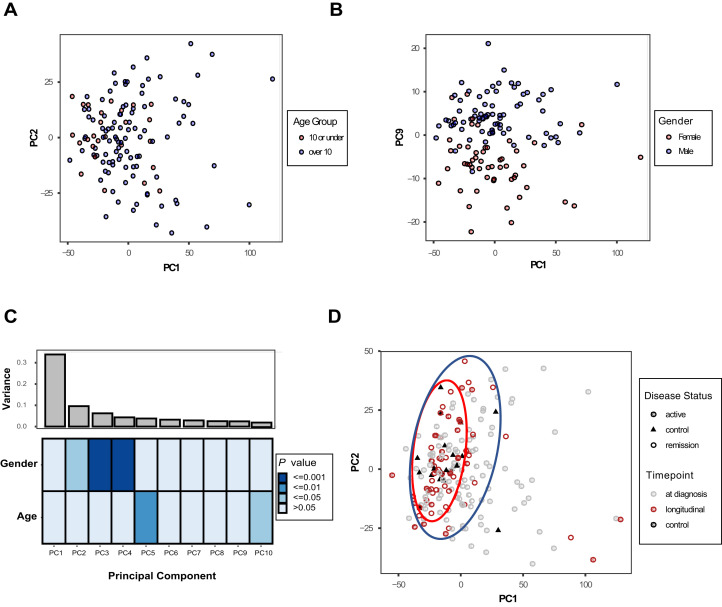
Methods: We obtained peripheral blood samples from 112 children with a new diagnosis of IBD (71 with Crohn's disease and 41 with ulcerative colitis) and 19 children without IBD (controls) and recorded medical information on disease activity and outcomes. CD8+ T cells were isolated from blood samples by magnetic bead sorting at the point of diagnosis and during the course of disease. Genome-wide transcription (n = 192) and DNA methylation (n = 66) profiles were generated using Affymetrix and Illumina arrays, respectively. Publicly available transcriptomes and DNA methylomes of CD8+ T cells from 3 adult patient cohorts with and without IBD were included in data analyses.

Results: Previously reported CD8+ T-cell prognostic expression and exhaustion signatures were only found in the original adult IBD patient cohort. These signatures could not be detected in either a pediatric or a second adult IBD cohort. In contrast, an association between CD8+ T-cell gene expression with age and sex was detected across all 3 cohorts. CD8+ gene transcription was clearly associated with IBD in the 2 cohorts that included non-IBD controls. Lastly, DNA methylation profiles of CD8+ T cells from children with Crohn's disease correlated with age but not with disease outcome.

Conclusions: We were unable to validate previously reported findings of an association between CD8+ T-cell gene transcription and disease outcome in IBD. Our findings reveal the challenges of developing prognostic biomarkers for patients with IBD and the importance of their validation in large, independent cohorts before clinical application.

Keywords: Biomarker; Epigenetic; Prognosis; Validation.


Figures

None
Graphical abstract
Figure 1
Figure 1
Genome-wide transcriptional profiles of CD8+ T cells obtained from children newly diagnosed with CD (n = 67), UC (n = 40), and healthy controls (n = 19), as well as from a previously published adult patient cohort (CD n = 19, UC n = 19, non-IBD controls n = 14, adult cohort 1). (A) Observed variance within pediatric CD8+ T-cell transcriptomes (top panel) in the first 10 PCs. Heatmap displaying correlation between observed transcriptional variance and phenotype as well as selected serum markers at diagnosis (bottom panel). (B) PC analysis plot of pediatric CD8+ T-cell transcriptomes illustrating close clustering of samples derived from non-IBD controls (red circle containing 17 of 19 control samples). (C) Variance in adult CD8+ T-cell transcriptomes also shows association with diagnosis, sex, and age. (D) PC analysis plot of adult CD8+ T-cell transcriptomes showing a similar distribution with close clustering of most non-IBD samples (red circle containing 11 of 14 control samples). P values were generated with a Kendall correlation for continuous variables, or an analysis of variance for categorical.
Figure 2
Figure 2
Disease prognostic transcriptional signature in adult and pediatric CD8+ T-cell samples. Genes forming the previously reported transcriptional signature were selected from genome-wide transcriptomes and subjected to hierarchical clustering. (A) Heatmap and hierarchical clustering of genes forming the IBD prognostic expression signature in CD8+ T cells obtained from adult patients diagnosed with CD (n = 35, adult cohort 2). (B, C) Heatmap and hierarchical clustering tree for genes forming the core adult IBD prognostic expression signature applied to CD8+ T-cell transcriptomes of (B) all children newly diagnosed with IBD (n = 107), and (C) children diagnosed aged 12 to 16 years (n = 74). (D) Prognostic signature applied to a second adult IBD patient cohort (adult cohort 1, n = 38). Clustering was tested for statistical significance using M3C.
Figure 3
Figure 3
WGCNA of CD8+ T-cell transcriptomes derived from adult-onset (adult cohort 2) (A) and childhood-onset (B) CD. (Ai) Module–trait relationship heatmap displaying gene modules and their correlation with age, sex, and outcome class (severe vs mild). Numbers indicate degree of correlation between module and trait (top) and corrected P value evaluating statistical significance of association (in parentheses). (Aii) Overlap between genes forming the adult IBD prognostic expression signature derived from Figure 1A (gray) and top correlated modules (blue and turquoise). (Aiii) Hierarchical clustering and heatmap of genes forming the blue module. (Bi) Top 10 module–trait relationship heatmap of CD8+ T cells derived from children newly diagnosed with CD (n = 60). (Bii) Hierarchical clustering and heatmap based on genes forming the gene module associated with sex (dark red module). Samples of patients commenced on treatment with biologics at diagnosis were excluded from these analyses.
Figure 4
Figure 4
Transcriptional variation of genes associated with T-cell exhaustion in CD8+ T cells. Genes forming a transcriptional T-cell exhaustion signature were selected from genome-wide transcriptomes and subjected to hierarchical clustering. Heatmap and hierarchical clustering trees are displayed for samples obtained from adults (adult cohort 2, A, n = 35) and children (B, n = 67) diagnosed with CD.
Figure 5
Figure 5
Genome-wide DNA methylation profiles derived from CD8+ T cells. (A) Variation observed in CD8+ T-cell DNA methylomes obtained from children newly diagnosed with CD (n = 66). Degree of variance in the first 10 PCs (top panel) and association with phenotype/serum parameters are indicated (heatmap, bottom panel). P values were generated with a Spearman correlation for continuous variables or an analysis of variance for categorical. (B) PC analysis plot of childhood CD patient–derived CD8+ T-cell DNA methylomes. Samples labeled according to disease outcome (mild, moderate, severe). (C) Epigenetic clock applied to CD8+ T-cell DNA methylomes derived from children newly diagnosed with CD, as well as 2 publicly available datasets (adult cohorts 1 and 3). Adult cohort 1 includes samples derived from adult patients diagnosed with IBD and healthy controls. (D) Estimated proportion of naïve (left) and memory (right) CD8+ T cells based on DNA methylomes demonstrating correlation with age in adult cohorts. Adult cohort 1 (n = 56), adult cohort 3 (n = 98).
Supplementary Figure 1
(A, B) Genome-wide transcriptional profiles of CD8+ T cells obtained from children newly diagnosed with CD (n = 67), UC (n = 40), and healthy controls (n = 19). PC analysis plots were generated after pre-processing and batch correction. (A) PC1 vs PC2 with samples labeled by age: 10 years or younger (n = 26, red) or older than 10 years (n = 100, blue). (B) Showing PC1 vs PC9 with samples labeled by sex: male (n = 74, blue), female (n = 52, red). (C) Assessment of variance within CD8+ T-cell transcriptomes generated from adult patients diagnosed with CD (adult cohort 2, n = 35) in each PC (top panel). Heatmap displaying correlation between observed transcriptional variance with sex and age (bottom panel). (D) PC analysis plot of samples obtained from pediatric patients at diagnosis and during follow-up, illustrating overlap between the majority of samples derived from patients in clinical remission (blue circle, 30 of 32) and non-IBD controls (red circle, 17 of 19).
Supplementary Figure 2
Application of previously reported disease prognostic transcriptional signature to adult and pediatric CD8+ T-cell samples. Genes forming the previously reported transcriptional signature were selected from genome-wide transcriptomes and subjected to hierarchical clustering. (A) Heatmap and hierarchical clustering of genes forming the UC-specific prognostic expression signature in CD8+ T cells obtained from adult patients diagnosed with UC (n = 32, original adult cohort 2). (B) Venn diagram illustrating overlap of transcriptional signatures identified in adult patients diagnosed with CD (n = 35) and UC (n = 32) forming the core IBD signature. (C–E) Heatmap and hierarchical clustering tree for genes forming adult IBD prognostic expression signature applied to CD8+ T-cell transcriptomes of (C) all children newly diagnosed with CD (n = 67, adult CD-specific signature applied), (D) all children newly diagnosed with UC (n = 40, adult UC-specific signature applied), and (E) all pediatric patient derived CD8+ T-cell transcriptomes, including non-IBD controls and longitudinal samples (n = 188, adult core IBD signature applied).
Supplementary Figure 3
Application of WGCNA to CD8+ T-cell transcriptional profiles derived from pediatric patients diagnosed with (A) UC (all ages, n = 39), (B) CD (age of disease onset 12–16 years, n = 37) and (C) UC (age of disease onset 12–16 years, n = 25). Displayed are the top 10 gene modules and their association with clinical phenotype (age at diagnosis, sex, number of treatment escalations, treatment escalation to biologics, surgery, and summary severity score). Statistically significant correlations were observed for sex (P < .05) in all cohorts and with age when including pediatric UC samples of all age groups (A). Numbers indicate degree of correlation between module and trait (top) and corrected P value evaluating statistical significance of association (in parentheses).
Supplementary Figure 4
Transcriptional variation of genes associated with T-cell exhaustion in CD8+ T cells. Genes forming a transcriptional T-cell exhaustion signature (Wherry et al29) were selected from genome-wide transcriptomes and subjected to hierarchical clustering. Heatmap and hierarchical clustering trees are displayed for samples obtained from (A) children newly diagnosed with UC (n = 40), (B) all pediatric patient derived CD8+ T-cell transcriptomes (n = 188, including controls and longitudinal follow-up samples) and (C) adult IBD patients (adult cohort 1, n = 38). No significant clusters were identified and patients with mild (ie, 0–1 treatment escalations in gray), or moderate to severe (ie, 2 or more treatment escalations in black) outcome are distributed equally in pediatric patients. The y-axis indicates expression of genes according to reference signature (red = up-regulated, blue = down-regulated).

Comment in

References

    1. Rosen M.J., Dhawan A., Saeed S.A. Inflammatory bowel disease in children and adolescents. JAMA Pediatr. 2015;169:1053–1060. - PMC - PubMed
    1. Herzog D., Fournier N., Buehr P. Age at disease onset of inflammatory bowel disease is associated with later extraintestinal manifestations and complications. Eur J Gastroenterol Hepatol. 2018;30:598–607. - PubMed
    1. Kerur B., Benchimol E.I., Fiedler K. Natural history of very early onset inflammatory bowel disease in north america: a retrospective cohort study. Inflamm Bowel Dis. 2020 May 9 [Epub ahead of print] - PMC - PubMed
    1. McKinney E.F., Lyons P.A., Carr E.J. A CD8+ T cell transcription signature predicts prognosis in autoimmune disease. Nat Med. 2010;16:586–591. 1p following 591. - PMC - PubMed
    1. Gravano D.M., Hoyer K.K. Promotion and prevention of autoimmune disease by CD8+ T cells. J Autoimmun. 2013;45:68–79. - PubMed

Supplementary References

    1. Davis S., Meltzer P.S. GEOquery: a bridge between the Gene Expression Omnibus (GEO) and BioConductor. Bioinformatics. 2007;23:1846–1847. - PubMed
    1. John C.R., Watson D., Russ D. M3C: Monte Carlo reference-based consensus clustering. Sci Rep. 2020;10:1816. - PMC - PubMed
    1. Ritchie M.E., Phipson B., Wu D. limma powers differential expression analyses for RNA-sequencing and microarray studies. Nucleic Acids Res. 2015;43:e47. - PMC - PubMed
    1. Mansell G., Gorrie-Stone T.J., Bao Y. Guidance for DNA methylation studies: statistical insights from the Illumina EPIC array. BMC Genomics. 2019;20:366. - PMC - PubMed
    1. Price M.E., Cotton A.M., Lam L.L. Additional annotation enhances potential for biologically-relevant analysis of the Illumina Infinium HumanMethylation450 BeadChip array. Epigenet Chromatin. 2013;6:4. - PMC - PubMed

Publication types