. 2020 Oct;586(7831):807-811.
doi: 10.1038/s41586-020-2668-z. Epub 2020 Aug 19.

Structure of hepcidin-bound ferroportin reveals iron homeostatic mechanisms

Affiliations

Structure of hepcidin-bound ferroportin reveals iron homeostatic mechanisms

Christian B Billesbølle et al. Nature. 2020 Oct.

Abstract

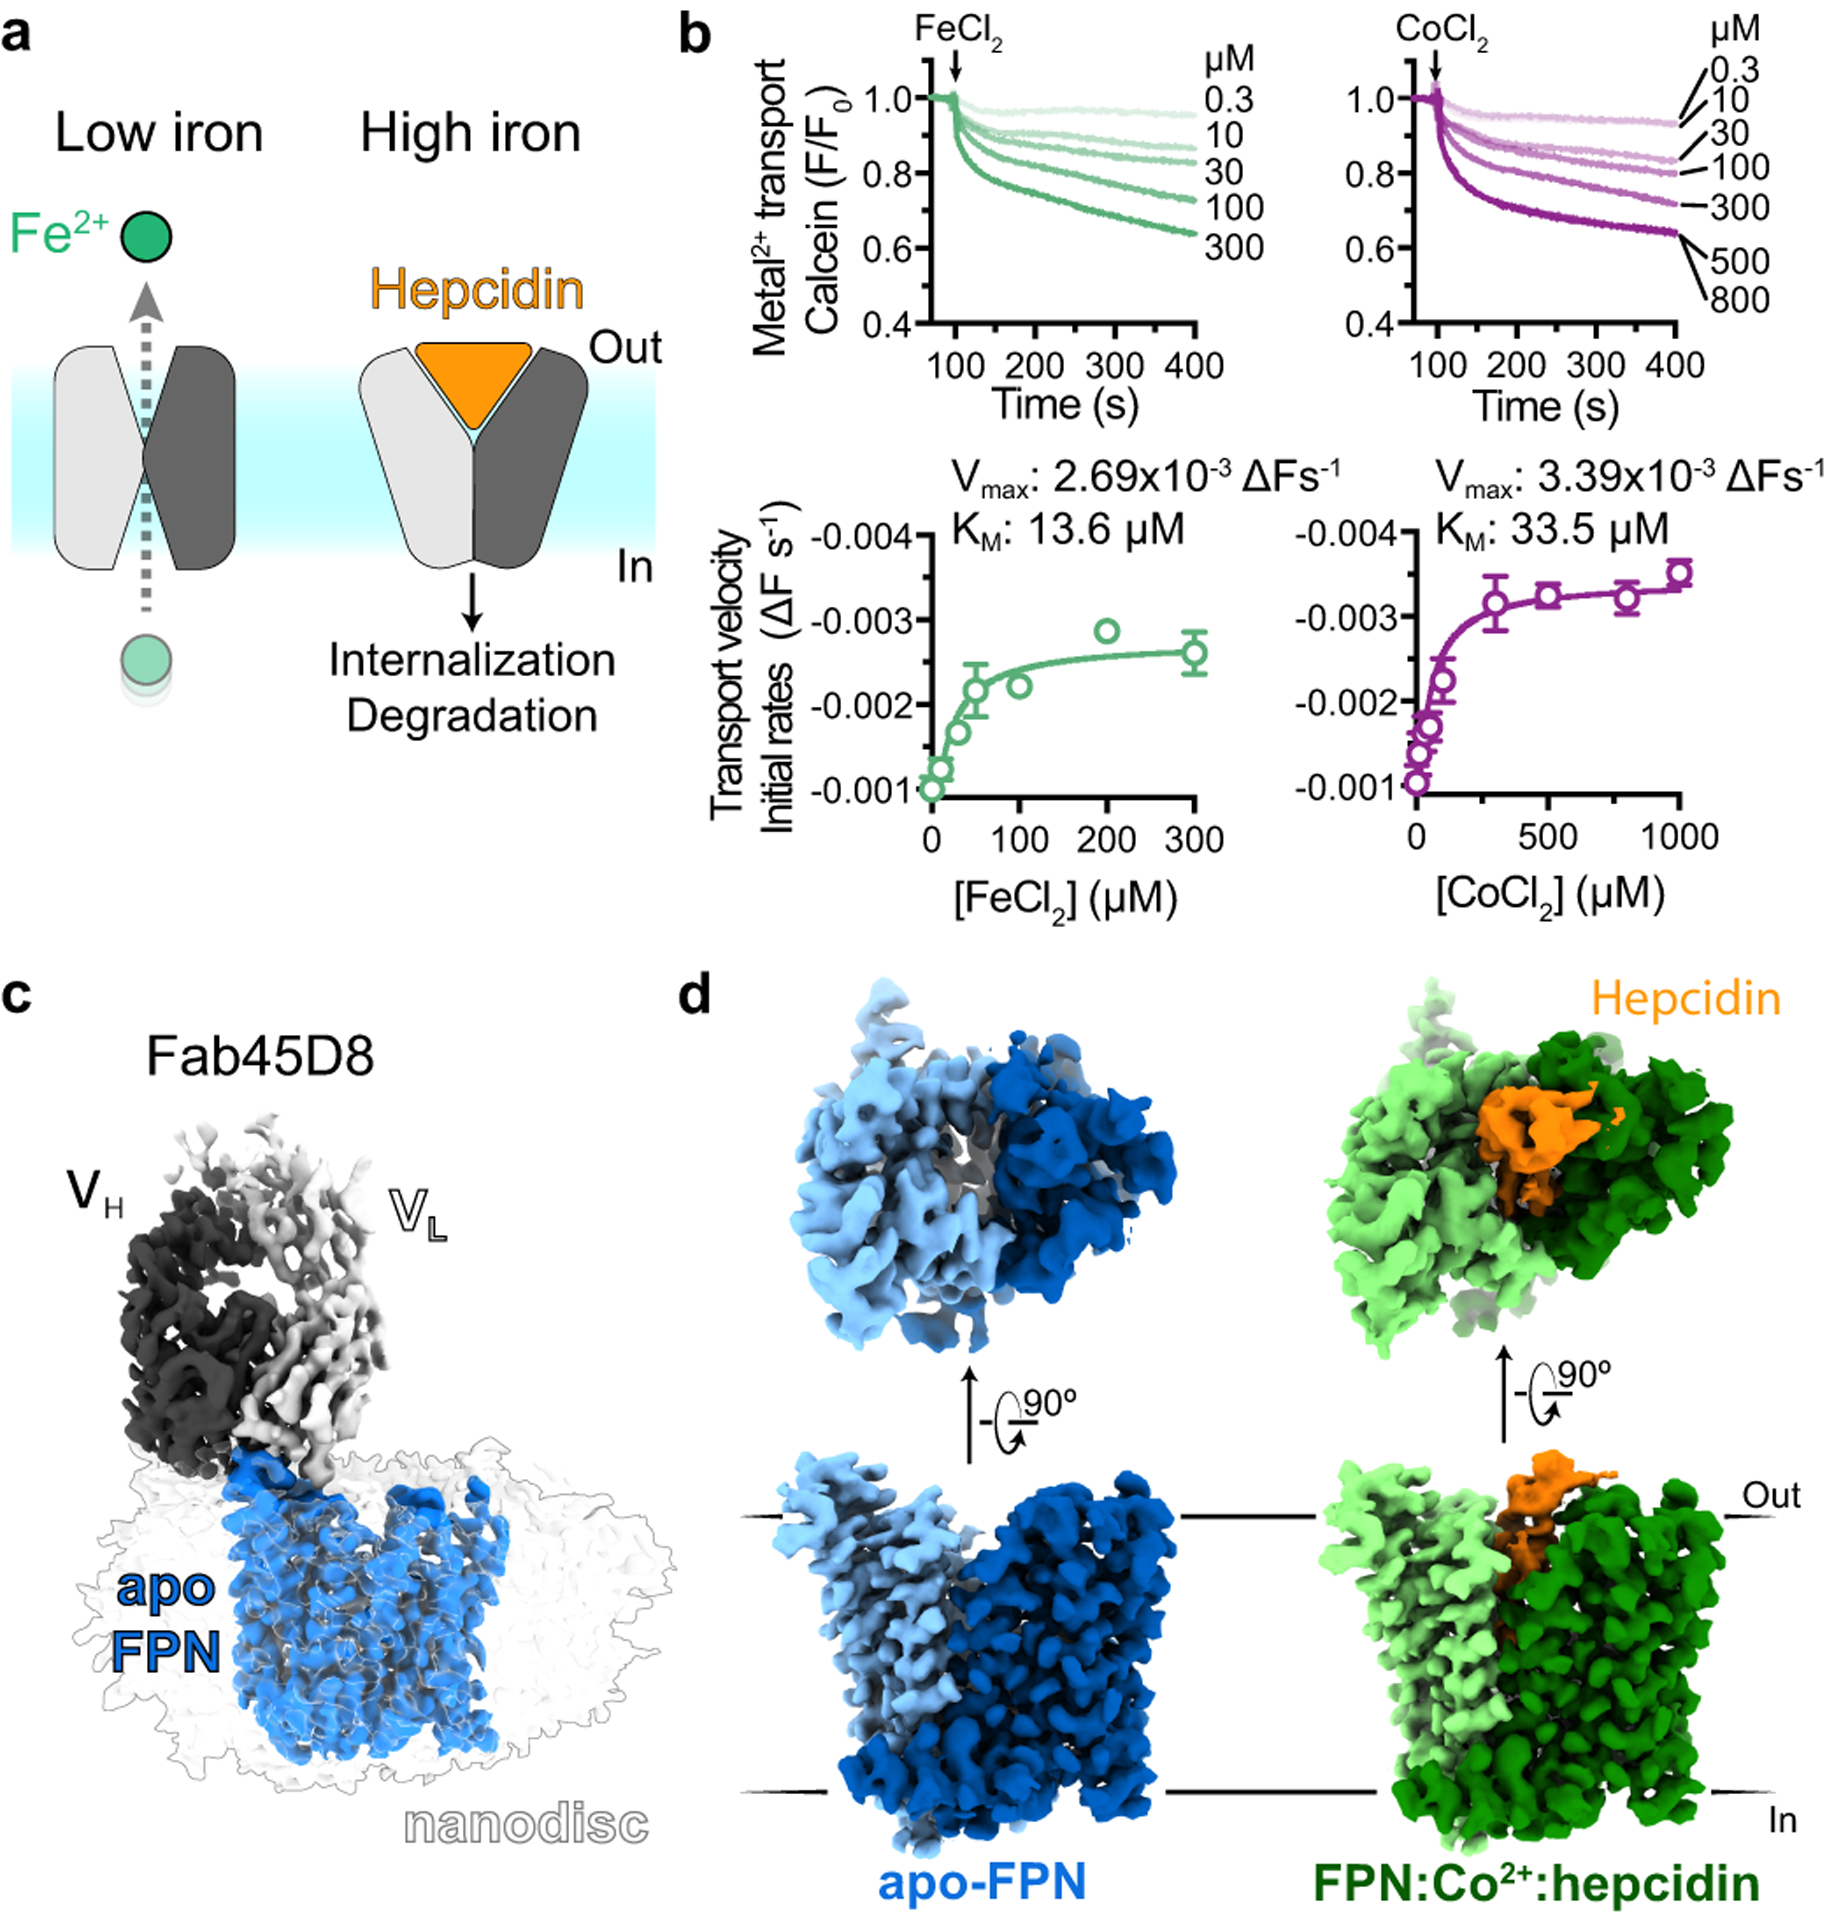
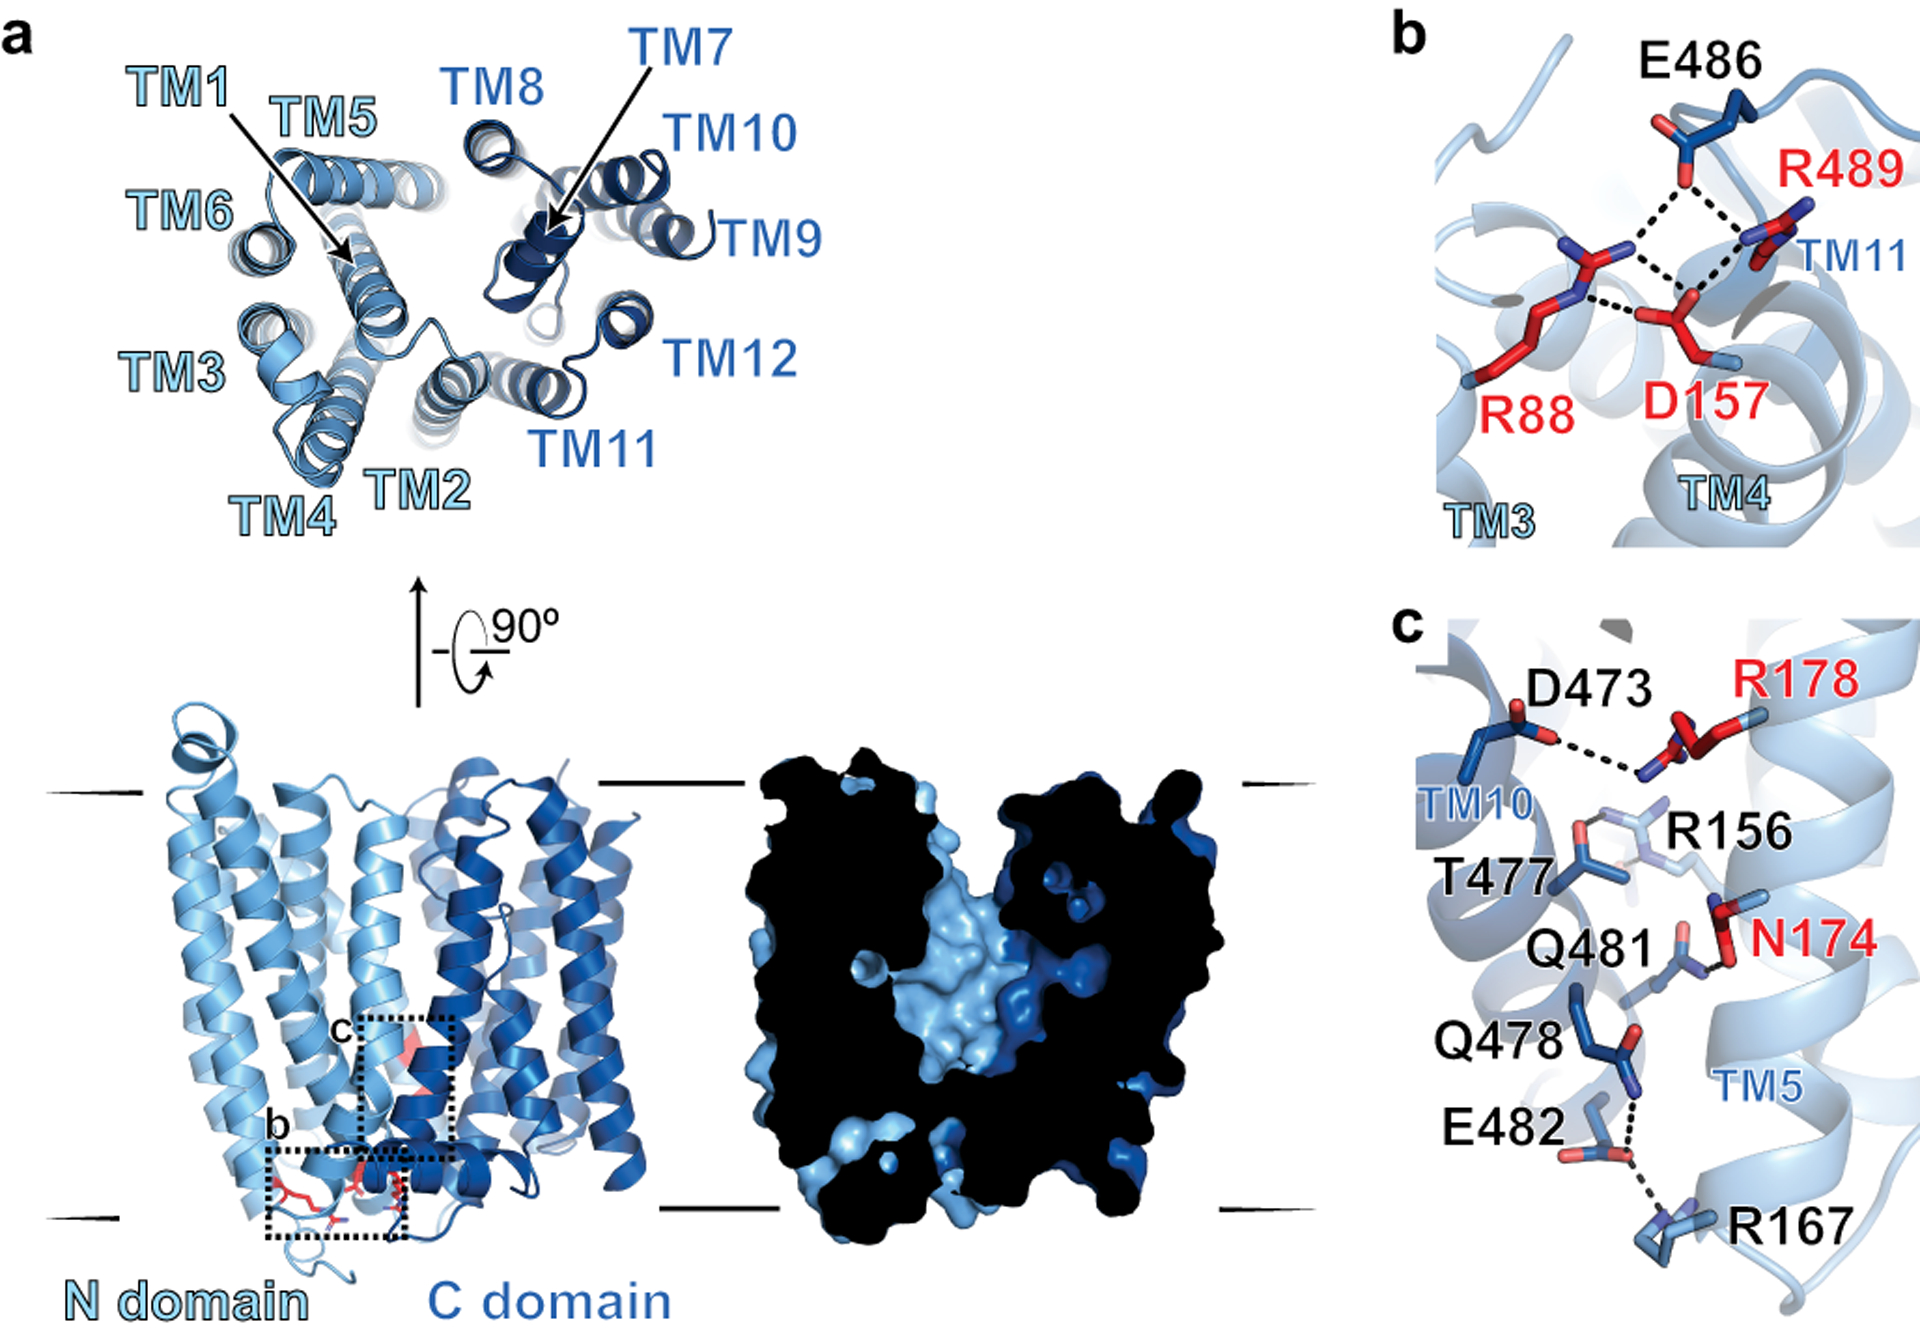
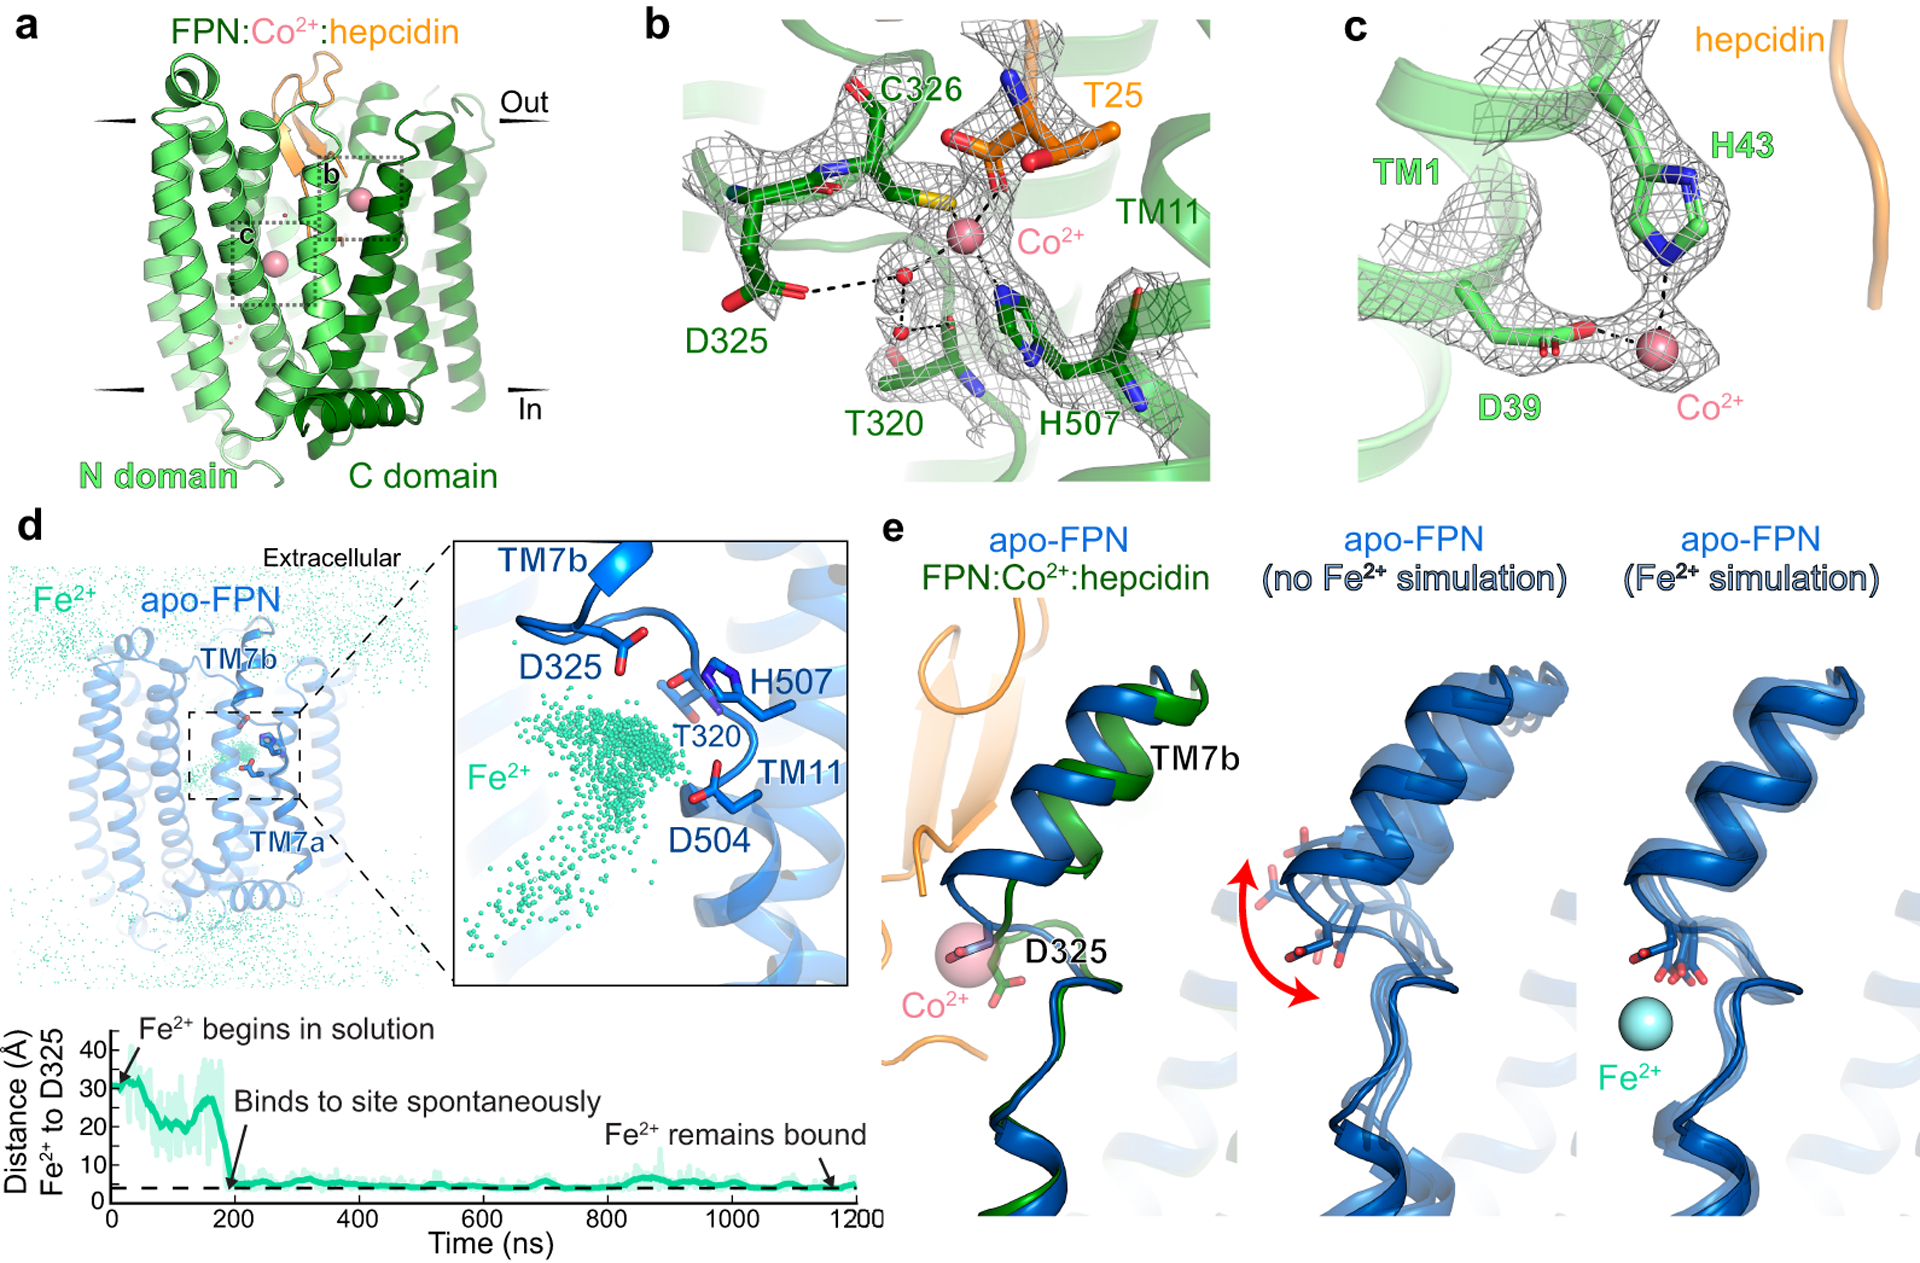
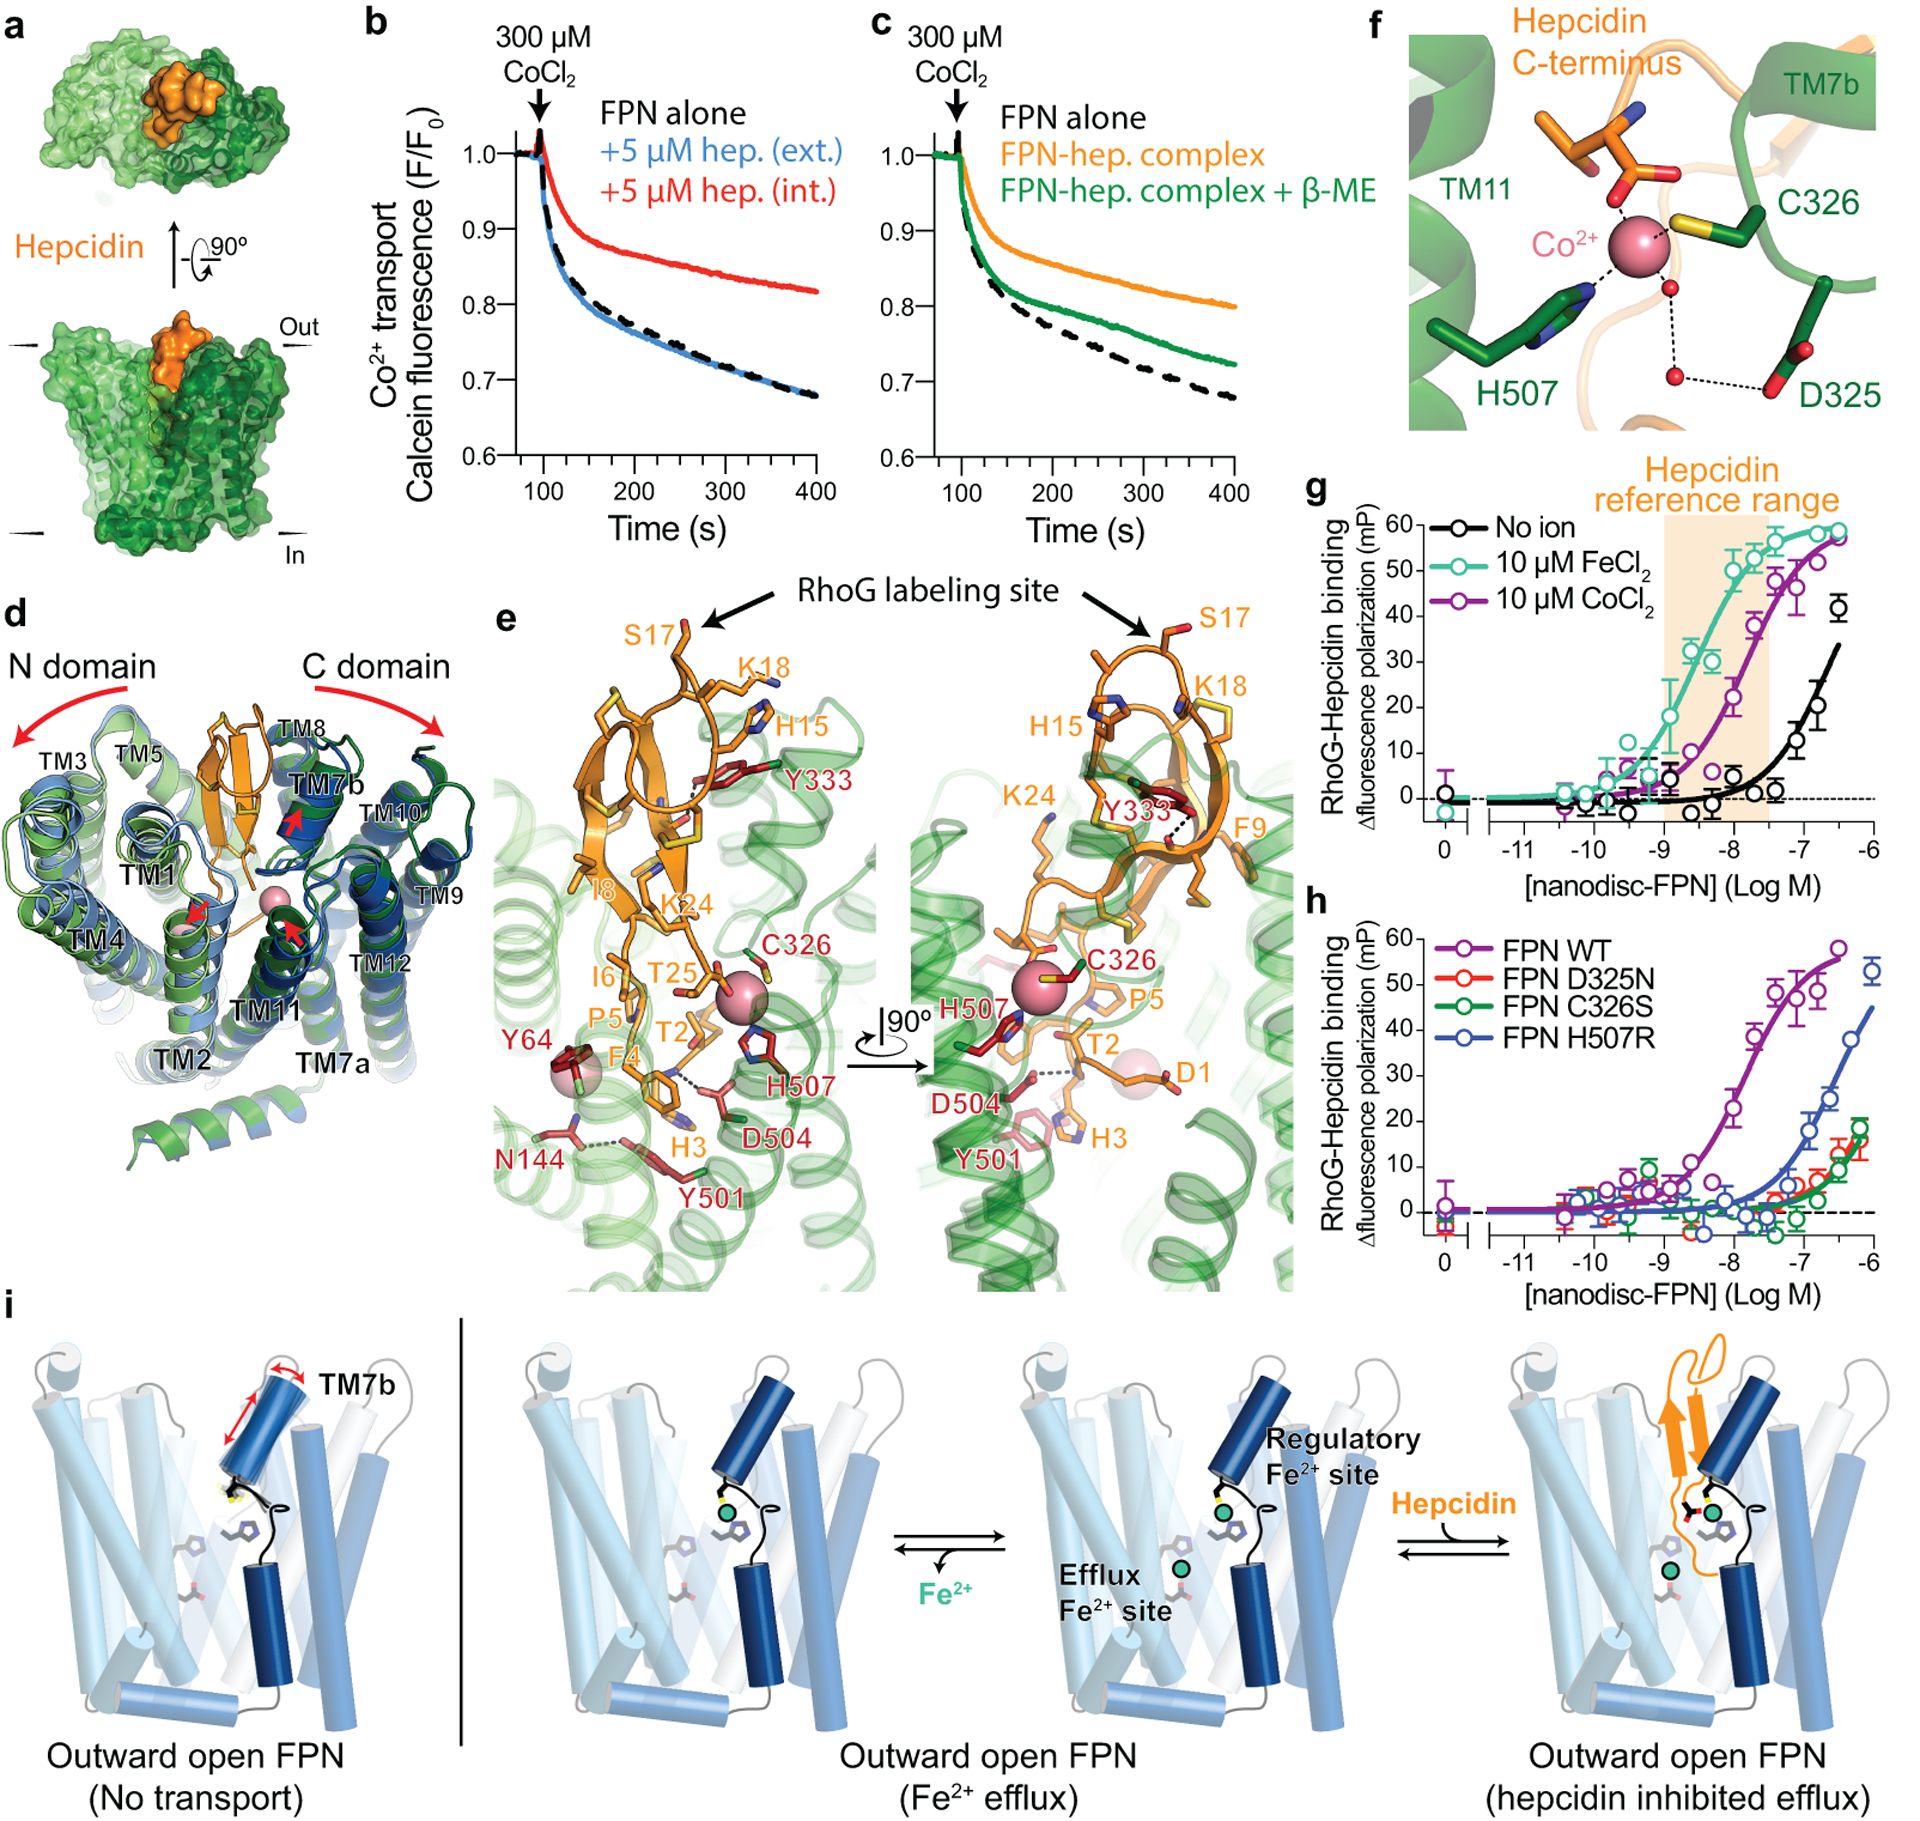
The serum level of iron in humans is tightly controlled by the action of the hormone hepcidin on the iron efflux transporter ferroportin. Hepcidin regulates iron absorption and recycling by inducing the internalization and degradation of ferroportin1. Aberrant ferroportin activity can lead to diseases of iron overload, such as haemochromatosis, or iron limitation anaemias2. Here we determine cryogenic electron microscopy structures of ferroportin in lipid nanodiscs, both in the apo state and in complex with hepcidin and the iron mimetic cobalt. These structures and accompanying molecular dynamics simulations identify two metal-binding sites within the N and C domains of ferroportin. Hepcidin binds ferroportin in an outward-open conformation and completely occludes the iron efflux pathway to inhibit transport. The carboxy terminus of hepcidin directly contacts the divalent metal in the ferroportin C domain. Hepcidin binding to ferroportin is coupled to iron binding, with an 80-fold increase in hepcidin affinity in the presence of iron. These results suggest a model for hepcidin regulation of ferroportin, in which only ferroportin molecules loaded with iron are targeted for degradation. More broadly, our structural and functional insights may enable more targeted manipulation of the hepcidin-ferroportin axis in disorders of iron homeostasis.


Conflict of interest statement

Competing Interests

Tara Arvedson is employed by Amgen and reports Amgen stock. The other authors declare no competing interests.

Figures

Extended Data Fig. 1 |
Extended Data Fig. 1 |. Biochemistry of purified human ferroportin and Fab45D8 complex.
a, Size exclusion chromatography of purified apo and hepcidin/Co2+ bound FPN-Fab45D8 complex. SDS-PAGE gel of purified complex under non-reducing (NR) and reducing (R) conditions. SEC and SDS-PAGE analyses are representative and were performed four and two times for apo and hepcidin/Co2+ bound FPN-Fab45D8 samples respectively. b, Fab45D8 binds nanodisc-reconstituted FPN (nanodisc-FPN), as assessed by size-exclusion chromatography. c, Fluorescence size exclusion chromatography (FSEC) of rhodamine green hepcidin (RhoG-hepcidin). RhoG-hepcidin co-elutes with nanodisc-FPN and with a nanodisc-FPN:Fab45D8 complex in the presence of CoCl2. d, FSEC shows RhoG-hepcidin binding to nanodisc-FPN is competed by excess unlabelled hepcidin used for structural studies. e, Fluorescence polarization of RhoG-hepcidin increases further with Fab45D8, consistent with formation of a larger complex. Importantly, Fab45D8 does not decrease RhoG-hepcidin binding. Data points are means from n = 3 technical replicates. f, RhoG-hepcidin binding to nanodisc-FPN in the presence of 10 μM CoCl2 measured by fluorescence polarization in the absence (KD = 31 nM) and presence of 3 μM Fab45D8 (KD = 39 nM). Data points are means from n = 3 technical replicates. g, RhoG-hepcidin binds to FPN (FPN+hepcidin) but not to Fab45D8 alone (Fab45D8+hepcidin). Order of hepcidin and Fab45D8 addition does not influence the increase in fluorescence polarization for a Fab45D8-FPN-hepcidin complex. Data points are means from n = 4 technical replicates.
Extended Data Fig. 2 |
Extended Data Fig. 2 |. Calcein quenching assay for FPN metal transport.
a, Schematic of calcein-based assay to measure transport of divalent cations. Purified FPN is reconstituted into proteoliposomes containing calcein. Transport of divalent cations leads to quenching of calcein fluorescence, which can also occur through the divalent cation selective ionophore calcimycin. b and c, Specificity of the calcein transport assay. FPN reconstituted liposomes facilitate uptake of 1000 μM Co2+ added (arrows, red trace) to the external bath solution, producing a calcein quenching response that follows a single exponential. Further additions of Co2+ demonstrates the transport process has reached saturation. Calcein fluorescence from empty liposomes (black trace) returns to baseline after multiple additions of 1000 μM Co2+. c, Additions of Co2+ followed by calcimycin results in rapid and almost complete quenching. Fluorescence traces are representative experiments. d, Liposome reconstitution samples analyzed by reducing SDS-PAGE, the analysis is representative and was performed three times for FPN samples and twice for FPN samples containing FPN-Hepcidin or FPN-Fab45D8. e, Calcein transport assay queried against a panel of putative transition metal ion substrates at 100 μM. Notably, the larger ions Ni2+ and Zn2+ are also reported FPN substrates. The smaller ion Mn2+ was previously found not to be effluxed by FPN in oocytes, but appears to be transported in liposomes. Cu2+ interferes with empty and FPN-containing liposomes, leading to non-specific quenching of calcein. Fluorescence traces are representative experiments. f, Fab45D8 decreases cobalt transport Vmax (2.40 × 10⁻³ ± 0.075 × 10⁻³ ΔF s−1) and Km (4.68 ± 0.54 μM). Data points are means ± s.e.m. from n = 3 independent experiments.
Extended Data Fig. 3 |
Extended Data Fig. 3 |. Cryo-EM data processing for FPN-Fab45D8.
a, Representative motion-corrected micrograph collected on the Titan Krios showing monodisperse FPN-Fab45D8 nanodisc particles. Four different FPN-Fab45D8 samples were imaged on GO-coated Quantifoil grids times with similar results. b, Examples of “good” 2D class averages that were used in 3D classification. Similar quality class averages were produced when processing six unique subsets of the final particles used. Scale bar is 50 Å. c, Flowchart showing image processing pipeline for FPN-Fab45D8. Initial processing, through 2D classification, was performed in cryoSPARC. Particles were then transferred, using csparc2star.py, to RELION for 3D classification, then to cryoSPARC for a nonuniform refinement, and finally to cisTEM for refinement. The number of particles moving into each step are noted. d, Final refinements from cryosparc and cisTEM beside their directional FSC curves calculated using dfsc.0.0.1.py. Angular distribution plot from cisTEM is shown.
Extended Data Fig. 4 |
Extended Data Fig. 4 |. Cryo-EM data processing for Co2+-hepcidin-FPN-Fab45D8.
a, Representative motion-corrected micrograph collected on the Titan Krios showing monodisperse Co2+-hepcidin-FPN-Fab45D8 nanodisc particles. Two indepedent Co2+-hepcidin-FPN-Fab45D8 samples were frozen on UltrAufoil grids with similar micrograph quality. b, Examples of “good” 2D class averages that were used in 3D classification. c, Flowchart showing image processing pipeline for Co2+-hepcidinF-PN-Fab45D8. Initial processing was performed in cryoSPARC. Local CTF refinement, with a conservative high-resolution limit of 4 Å, was performed before nonuniform refinement using default parameters. A final subset of particles was transferred to cisTEM for refinement. The number of particles moving into each step are noted. d, Final refinements from cryosparc and cisTEM beside their directional FSC curves calculated using dfsc.0.0.1.py. Angular distribution plot from cisTEM is also shown.
Extended Data Fig. 5 |
Extended Data Fig. 5 |. Cryo-EM map density for FPN.
Local resolution estimation in cryoSPARC for the apo-FPN-Fab45D8 complex (a) and for the Co2+-hepcidin-FPN-Fab45D8 complex (c). Two views of each complex are shown. Shown in grey mesh is cryo-EM map density for individual FPN transmembrane helices for the apo-FPN-Fab45D8 complex (b) and for the Co2+-hepcidin-FPN-Fab45D8 complex (d). Mesh depicts density within a 2.5 Å radius of any modeled atom.
Extended Data Fig. 6 |
Extended Data Fig. 6 |. Structure of Fab45D8 and comparison of FPN with bbFPN.
a, Cryo-EM density of FPN and Fab45D8. Although density is observed for the constant regions of Fab45D8, it is not of sufficient quality to unambiguously model. b, Fab45D8 makes extensive contacts with FPN extracellular loop 2 (ECL2) with both the heavy (VH) and light (VL) chains. c, Crystal structure of Fab45D8 at 2.1 Å. d, Comparison of Fab45D8 alone (transparent cartoon and sticks) and bound to FPN. The binding site residues of Fab45D8 change minimally upon binding FPN. e, Human FPN aligned to the outward-open (PDB: 5AYN) and inward-open (PDB: 5AYO) conformations of bbFPN. f, Unique architecture of TM7 shared between human FPN and bbFPN.
Extended Data Fig. 7 |
Extended Data Fig. 7 |. Effect of pH and ions on metal transport and binding.
a and b, Co2+ transport by FPN is potentiated by an opposing H+-gradient. a, Time-course calcein fluorescence quenching response after addition of 300 μM CoCl2 (arrow) for FPN-liposomes containing 100 mM KCl and HEPES, pH 7.50 that were diluted into buffer comprised of 100 mM NaCl and (i) HEPES pH 6.8, (ii) HEPES pH 7.5, (iii) HEPES pH 8.2, (iv) Tris/MES pH 6.0, or (v) Tris/MES pH 9.0. b, initial rates of transport obtained from the linear phase of time-course fluorescence quenching experiments at the indicated pH values. Data points are means ± s.e.m. from n = 3 experiments. c, Calcein fluorescence responses for FPN-liposomes containing 100 mM KCl and HEPES, pH 7.50 diluted into 100 mM NaCl and HEPES, pH 7.50. A membrane potential (ΔΨ) was generated by addition of the K+ selective ionophore valinomycin prior to the experiment, which creates an outward K+ gradient. Not significant (p = 0.5986, Student’s unpaired t-test, two-tailed) difference was observed for the rate of transport by valinomycin addition. Bars are means ± s.e.m with corresponding data points from n = 3 independent experiments. d-g Calcium modulates the FPN transport mechanism. d, Time-course calcein fluorescence quenching response after addition of 1000 μM CoCl2 (arrow) for FPN-liposomes preloaded with 1.25 mM CaCl2 internally (red) or 1.25 mM CaCl2 added to the external solution (grey). e, Initial rates of Co2+ transport in the presence of internal 1.25 mM CaCl2 (red circles). Data points are means ± s.e.m from n = 3 independent experiments. Quantified transport rates in Supplementary Table 2. f, Calcein fluorescence response for FeCl2. g, Initial rates of Fe2+ transport. Data points are means ± s.e.m from n = 3 independent experiments. h-i, Calcium does not support high affinity hepcidin binding to FPN. h, Binding of 5 nM RhoG-hepcidin to nanodisc-FPN in the presence of 3 mM CaCl2 was determined by fluorescence polarization (EC50 >100 nM). Data points are means ± s.e.m from n = 3 independent experiments. i, Ca2+ stimulates the partial binding of 5 nM RhoG-hepcidin to 100 nM nanodisc-FPN with an EC50 of 47.1 ± 4.1 μM, confirming that the Ca2+ binding site in FPN titrates in the physiological range (~1.25 mM) of free ionized Ca2+. In contrast, Co2+ stimulates binding of 5 nM RhoG-hepcidin to 100 nM nanodisc-FPN with an EC50 of 35.8 ± 3.6 nM. However, depletion of RhoG-hepcidin leads to a nHill = 0.52, and the true affinity of cobalt may be higher than this value. Importantly, these results indicate that binding of physiologically relevant concentrations of hepcidin would be exceedingly ineffective to apo and Ca2+-bound FPN. Data points are means ± s.e.m from n = 3 independent experiments.
Extended Data Fig. 8 |
Extended Data Fig. 8 |. Molecular dynamics simulations of iron binding to apo FPN.
a, Local resolution of FPN cryo-EM density. Insets show local resolution around TM7b. b, Each graph corresponds to an independent simulation where Fe2+ ions start in solution and bind spontaneously to the proposed iron binding site. Distance shown is from the ion to the nearest oxygen atom of the D325 side chain. Thick traces represent a 15-ns sliding mean and thin traces represent unsmoothed values. Timetraces include 30 ns of equilibration. The average time to bind (the time from start of production simulation to when the measured distance is less) was 71 ns. c, Representative conformations of TM7 from simulations with iron bound (blue) or absent (orange). d, In the absence of bound iron, D325 is mobile and can move into the cavity between TM7b and TM1. The top of TM7b can also tilt away from TM1. Four representative frames from simulation are overlaid. e, In simulations with Fe2+ bound, interaction with the ion restricts the mobility of D325 and, in turn, TM7b. f, Iron-bound and iron-absent simulations show differences in the dynamics and position of D325, as measured by the distance between D325 Cγ and S47 Cβ. g, Comparison of conformation and dynamics with and without iron bound. With iron bound, D325 moves away from TM1 into the iron binding site (left), the root-mean-square fluctuation (RMSF) of D325 decreases (middle), and the extracellular end of TM7b moves closer to TM1 (right). For these comparisons, 6 simulations for each condition were used, each 2.0 μs in length. Error bars are s.e.m. and p-values were calculated using Mann-Whitney U test (two-tailed); the p=0.001 (left plot), 0.046 (middle plot), 0.046 (right plot).
Fig. 1 |
Fig. 1 |. Structures of human ferroportin.
a, Ferroportin effluxes cellular iron (Fe2+) by an alternating access mechanism. Hepcidin binds to outward-open ferroportin and induces ubiquitination and degradation. b, Transport of Fe2+ and Co2+ by human ferroportin reconstituted into calcein containing liposomes. Time-course experiments were performed by addition of ions (arrow) and the steady-state kinetic analysis was performed by fitting initial rates, obtained from the linear phase of transport, to the Michaelis-Menten function. Time-course data are representative experiments, and data points are means +/− s.e.m. from n = 3 independent experiments. c, Cryo-EM map of apo-FPN-Fab45D8 complex in lipid nanodisc. d, Cryo-EM density of apo and Co2+/hepcidin bound FPN. The N and C domains are colored in different shades of blue for apo-FPN and green for Co2+/hepcidin bound FPN. Hepcidin (orange) binds to an extracellular facing cavity in FPN.
Fig. 2 |
Fig. 2 |. Structure of apo-FPN.
a, Ribbon diagram of FPN reveals 12 transmembrane helices. The N- and C-domains are colored in different shades of blue. Cutaway surface view (right) shows outward open conformation. b, Intracellular gating residues are shown as sticks. c, TM10 and TM5 form an extensive network of interactions, further stabilizing the outward open conformation. Residues highlighted in red in (b) and (c) are known loss-of-function mutations that lead to ferroportin disease in humans.
Fig. 3 |
Fig. 3 |. Iron binds to the N and C domains of FPN.
a, Ribbon diagram of FPN-Co2+-hepcidin complex. Closeup view of cryo-EM density for Co2+ ion (pink) in the FPN C domain (b) and in the FPN N domain (c). d, Top: In molecular dynamics simulations with Fe2+ initially positioned randomly in bulk water surrounding FPN, the Fe2+ ions spontaneously bind to a region near H507, D325, and D504. The aggregated position of Fe2+ ions from six simulations, each 2 μs in length, is shown superimposed with apo FPN. Bottom: In one representative simulation, an Fe2+ ion binds within 200 ns and remains localized at this site for >1000 ns. Distance shown is from the ion to the nearest oxygen atom of D325. Thick trace is a 15-ns sliding mean. e, Comparison of TM7b conformation in apo-FPN and FPN bound to Co2+ and hepcidin. In simulations without Fe2+, TM7b is dynamic, with significant fluctuation of D325. D325 coordinates Fe2+ in simulations and leads to decreased TM7b motion.
Fig. 4 |
Fig. 4 |. Hepcidin binding to FPN requires iron.
a, Surface representation of the FPN-Co2+-hepcidin complex. b, Hepcidin (hep.) added internally (int.) to calcein-loaded liposomes inhibits FPN transport. External (ext.) hepcidin has no effect on transport. c, Reconstitution of a ferroportin-hepcidin (FPN-hep.) complex shows inhibited transport. Addition of 1 mM β-mercaptoethanol (β-ME) rescues transport activity. All transport traces are averaged values from n = 3 independent experiments. d, Ribbon diagrams of apo-FPN (blue) aligned to FPN-Co2+-hepcidin (green, orange, and pink spheres. Red arrows highlight structural differences. e, Closeup views of the hepcidin binding site. Residues in red are known hepcidin resistance mutations. Rhodamine green (RhoG) - hepcidin labeling site on position 17 is highlighted. f, Closeup of C domain metal binding site. g, Fluorescence polarization increase in rhodamine green-labeled hepcidin (RhoG-hepcidin) as nanodisc-reconstituted FPN is titrated with a KD of 210 nM. Addition of 10 μM FeCl2 or CoCl2 increases the affinity of hepcidin to 2.5 nM and 7.7 nM (pKD = −8.11 ± 0.16), respectively. Hepcidin concentration range in healthy human adults is shown in orange. Data points are means ± s.e.m. from n = 3 independent experiments. h, C domain metal binding site mutants decrease RhoG-hepcidin binding affinity at FPN, even in the presence of 50 μM CoCl2. Data points are means ± s.e.m. from n = 3 independent experiments. i, Model for iron-coupled hepcidin regulation of FPN function. In settings of iron efflux, TM7b is conformationally stabilized by iron coordination in the C domain regulatory site. High affinity hepcidin binding to outward open FPN depends on the direct coordination of iron in the C domain.

References

    1. Nemeth E et al. Hepcidin regulates cellular iron efflux by binding to ferroportin and inducing its internalization. Science 306, 2090–2093 (2004). - PubMed
    1. Drakesmith H, Nemeth E & Ganz T Ironing out Ferroportin. Cell Metab. 22, 777–787 (2015). - PMC - PubMed
    1. Donovan A et al. The iron exporter ferroportin/Slc40a1 is essential for iron homeostasis. Cell Metab. 1, 191–200 (2005). - PubMed
    1. Donovan A et al. Positional cloning of zebrafish ferroportin1 identifies a conserved vertebrate iron exporter. Nature 403, 776–781 (2000). - PubMed
    1. Knutson MD, Oukka M, Koss LM, Aydemir F & Wessling-Resnick M Iron release from macrophages after erythrophagocytosis is up-regulated by ferroportin 1 overexpression and down-regulated by hepcidin. Proc. Natl. Acad. Sci. U. S. A 102, 1324–1328 (2005). - PMC - PubMed

Publication types

MeSH terms