. 2020 Dec;588(7837):344-349.
doi: 10.1038/s41586-020-2673-2. Epub 2020 Aug 19.

Structure of LRRK2 in Parkinson's disease and model for microtubule interaction

Affiliations

Structure of LRRK2 in Parkinson's disease and model for microtubule interaction

C K Deniston et al. Nature. 2020 Dec.

Abstract

Leucine-rich repeat kinase 2 (LRRK2) is the most commonly mutated gene in familial Parkinson's disease1 and is also linked to its idiopathic form2. LRRK2 has been proposed to function in membrane trafficking3 and colocalizes with microtubules4. Despite the fundamental importance of LRRK2 for understanding and treating Parkinson's disease, structural information on the enzyme is limited. Here we report the structure of the catalytic half of LRRK2, and an atomic model of microtubule-associated LRRK2 built using a reported cryo-electron tomography in situ structure5. We propose that the conformation of the LRRK2 kinase domain regulates its interactions with microtubules, with a closed conformation favouring oligomerization on microtubules. We show that the catalytic half of LRRK2 is sufficient for filament formation and blocks the motility of the microtubule-based motors kinesin 1 and cytoplasmic dynein 1 in vitro. Kinase inhibitors that stabilize an open conformation relieve this interference and reduce the formation of LRRK2 filaments in cells, whereas inhibitors that stabilize a closed conformation do not. Our findings suggest that LRRK2 can act as a roadblock for microtubule-based motors and have implications for the design of therapeutic LRRK2 kinase inhibitors.


Figures

Extended Data Figure 1 ∣
Extended Data Figure 1 ∣. Optimization of LRRK2 constructs and cryo-EM analysis of a LRRK2RCKW trimer.
a, We systematically scanned domain boundaries (amino acid numbers of boundaries noted above domain names) to generate LRRK2 constructs that expressed well in baculovirus-infected insect cells and yielded stable and soluble protein. These attempts included full-length LRRK2, the kinase domain alone or with the WD40 domain, and other isolated domains. In this approach, only the GTPase domain on its own expressed well. Next, we gradually shortened LRRK2 from its amino-terminus. Red asterisks indicate constructs that were soluble. b, After identifying domain boundaries yielding constructs that expressed soluble protein, additional fine tuning of boundaries was performed. A Coomassie stained SDS-PAGE gel shows systematic N-terminal truncations at the RoC domain resulting in the identification of a construct with the highest expression levels: amino acids 1327 to 2527 (red asterisk, “LRRK2RCKW” here). c, A Coomassie stained SDS-PAGE gel of purified LRRK2RCKW after elution from an S200 gel filtration column. As predicted by its primary structure, LRRK2RCKW runs at ~140 kDa. d, Electron micrograph of LRRK2RCKW. e, 2D class averages of the LRRK2RCKW trimer. f, 2D/3D classification scheme used to obtain the 3.5Å structure of the LRRK2RCKW trimer. g, h, Fourier Shell Correlations (from Cryosparc) (d) and Euler angle distribution (e) for the LRRK2RCKW trimer.
Extended Data Figure 2 ∣
Extended Data Figure 2 ∣. Cryo-EM analysis of a signal-subtracted LRRK2RCKW trimer and map-to-model fit.
a, Processing strategy used to obtain a 3.8Å structure of LRRK2RCKW generated from a signal-subtracted trimer where only one monomer contains the RoC and COR-A domains. This structure improved the resolution of the RoC and COR-A domains relative to the full trimer (Extended Data Fig. 1). b-d, 2D class averages (b), Fourier Shell Correlations (from Relion) (c), and Euler angle distribution (from Relion) (d) for the 3.8Å-resolution signal-subtracted LRRK2RCKW structure. e, Close-ups (f-l) of different parts of the final model fit into the map. f, Section of the WD40 domain. g, C-terminal helix and its interface with the kinase domain. h, Active site of the kinase. Residues in the DYG motif are labeled. G2019, the site of a major PD-associated mutation (G2019S) and the last residue of the activation loop seen in our structure, is highlighted by a black rounded square. i, Interface between COR-B and the αC helix of the N-lobe of the kinase domain. j, Interface between the RoC and COR-B domains. R1441 and Y1699, two residues mutated in PD, are labeled. k, l, Two different views of the RoC and COR-A domains with GDP-Mg2+ modeled into the density. Side chains were omitted in these two panels, corresponding to the lowest-resolution parts of the map. m, Map-to-model FSC plots for the top-ranked LRRK2RCKW models, with (left) or without GDP-Mg2+ (right) in the RoC domain. The 0.143 FSC values are reported in Extended Data Table 1. n, Size Exclusion Chromatography-Multiple Angle Light Scattering (SEC-MALS) analysis of LRRK2RCKW under the conditions used for cryo-EM (Fig. 1). The table shows the calculated molecular weights (MW) of LRRK2RCKW according to SEC standards (“SEC”) and MALS.
Extended Data Figure 3 ∣
Extended Data Figure 3 ∣. Comparisons between LRRK2 and other kinases and modelling of the Leucine-Rich Repeat (LRR) into LRRK2RCKW.
a, View of the LRRK2RCKW atomic model with COR-A, COR-B and kinase domains colored. The N- and C-lobes of the kinase are labeled, as is the αC helix in the N-lobe. b, c, The FAK-FERM (PDB: 2J0J) (b) and CDK2-Cyclin A (PDB: 2CCH) (c) complexes, shown in the same orientation as the kinase in (a). The αC helix of CDK2 is also labeled. d, Same view as in (a) with only the kinase domain and the C-terminal helix colored. e, Rotated view of LRRK2’s kinase domain with the C-terminal helix facing the viewer. f, g, CDKL3 (PDB: 3ZDU) (f) and RIPK2 (PDB: 4C8B) (g) shown in the same orientation as LRRK2’s kinase in (e), with alpha helices with the same general location as LRRK2’s C-terminal helix colored in green. h, KSR2-MEK1 complex (PDB: 2Y4I), with the kinase oriented as in (e) (left) and after removing KSR2 for clarity (right). The alpha helix associated with the kinase is shown in green. i, HCK (PDB: 2HCK) in complex with its SH2 and SH3 domains with the kinase oriented as in (e) (left), and after removal of the SH2 and SH3 domains for clarity (right). A remaining alpha helix from the SH2 domain is shown in yellow. j, Front view of LRRK2’s kinase with the C-Spine and R-Spine residues colored in grey and white, respectively. k, Close-up of the DYG motif and neighboring R-Spine residues. A putative hydrogen bond between Y2018 and the backbone carbonyl of I1933 is shown (O-O distance: 2.7Å). This interaction provides a structural explanation for the hyperactivation of the kinase resulting from a Y2018F mutation, which would release the activation loop. l, Crystal structure of the LRR-RoC-COR(A/B) domains from C. tepidum Roco (PDB: 6HLU). m, Homology model for human LRR-RoC-COR(A/B) based on the C. tepidum Roco structure (from SWISS-MODEL). n, Chimeric model combining LRRK2RCKW and the homology model for the LRR domain from (m) obtained by aligning their RoC-COR(A/B) domains. o, p, Two views of the hybrid LRRK2LRCKW model. q, Close-up showing the proximity between the active site of the kinase (with the side chains of its DYG motif shown) and the S1292 autophosphorylation site on the LRR. The close-up also highlights the proximity between N2081, a residue implicated in Crohn’s Disease, and the LRR.
Extended Data Figure 4 ∣
Extended Data Figure 4 ∣. Comparison between LRRK2RCKW and integrative models built into cryo-ET maps of LRRK2 filaments in cells and docking of LRRK2RCKW into those maps.
a, Root-mean-square deviation (RMSD) between the atomic model of LRRK2RCKW and each of the 1,167 integrative models generated by Watanabe, Buschauer, Bohning and colleagues. RMSDs were calculated in Chimera using 100% residue similarity and with pruning iterations turned off. RMSD values are grouped into 53 clusters of related models (see for details), with the mean and standard deviation shown whenever the cluster contains two or more models. Integrative models that gave the lowest, median and highest RMSD values are shown. The models are colored according to the per-residue RMSD with the atomic model of LRRK2RCKW. b, The WD40s in the crystal structure of a dimer of LRRK2’s WD40 (PDB: 6DLP) were replaced with the WD40s from our cryo-EM structure of LRRK2RCKW. c, The resulting dimer was fitted into the 14Å cryo-ET map of cellular microtubule-associated LRRK2 filaments. d, Two views of the same fitting shown in (c), displayed with a higher threshold for the map to highlight the fitting of the WD40 β-propellers into the density. The white arrows point towards the holes at the center of the β-propellers densities. e, Four copies of LRRK2RCKW were docked into the cryo-ET map by aligning their WD40 domains to the docked WD40 dimer. f, Model containing the four aligned LRRK2RCKW. g-j, Modeling of the kinase-closed form of LRRK2RCKW. g, h, The structure of ITK bound to an inhibitor (PDB: 3QGY), which is in a closed conformation, was aligned to LRRK2RCKW using only the C-lobes of the two kinases. i, The N-terminal portion of LRRK2RCKW, comprising RoC, COR-A, COR-B and the N-lobe of the kinase, was aligned to ITK using only the N-lobes of the kinases. RoC, COR-A and COR-B were moved as a rigid body in this alignment. j, Kinase-closed model of LRRK2RCKW.
Extended Data Figure 5 ∣
Extended Data Figure 5 ∣. Ab initio models for cryo-EM of LRRK2RCKW dimers and cryo-EM analysis of WD40- and COR-mediated dimers of LRRK2RCKW in the presence of the inhibitor MLi-2.
a, An initial dataset was collected from a sample of LRRK2RCKW incubated in the presence of the kinase inhibitor MLi-2 and dimers were selected. b, Representative two-dimensional class averages used for ab initio model building. c, Ab initio models with the structure of LRRK2RCKW docked in. d, Volumes generated form the molecular models in (b), filtered to 30Å resolution. e, Projections of the volumes in (d) shown in the same order as their corresponding 2D class averages in (b). f, Data processing strategy for obtaining cryo-EM structures of WD40- and COR-mediated dimers of LRRK2RCKW in the presence of the inhibitor MLi-2. The models used during this processing (see Methods) are those shown in (d) along with an additional linear trimer (see Methods) used for particle sorting.
Extended Data Figure 6 ∣
Extended Data Figure 6 ∣. Cryo-EM analysis of a monomer and WD40- and COR-mediated dimers of LRRK2RCKW in the absence of inhibitor (“Apo”) and dimerization of LRRK2RCKW outside the filaments.
a, Data processing strategy for obtaining cryo-EM structures of a monomer and WD40- and COR-mediated dimers of LRRK2RCKW in the absence of inhibitor. The models used during the processing of the dimers (see Methods) are those shown in Extended Data Fig. 5d, along with an additional linear trimer (see Methods) used for particle sorting. The models used for processing of the monomer (see Methods) were the same dimer models as in Extended Data Fig. 5d (used for particle sorting) in addition to a monomer model generated from our LRRK2RCKW model (used for refinement). b, Two-dimensional (2D) class averages of WD40- and COR-mediated LRRK2RCKW dimers obtained in the absence of inhibitors (“Apo”) or in the presence of either Ponatinib or MLi-2. The same molecular models of the two dimers shown in Fig. 3 are shown on the left but in orientations similar to those represented by the 2D class averages shown here. For each class average, a projection from the corresponding model in the best-matching orientation is shown to its left. c, Two copies of the LRRK2RCKW structure were aligned to the RoC-COR domains of the LRR-RoC-COR structure from C. tepidum’s Roco protein (PDB: 6HLU) to replicate the interface observed in the bacterial homolog in the context of the human protein. This panel shows a comparison between the dimer modeled based on the C. tepidum LRR-RoC-COR structure and the dimer observed for LRRK2RCKW in this work. While the bacterial structure shows a dimerization interface that involves the GTPase (RoC), LRRK2RCKW interacts exclusively through its COR-A and -B domains, with the RoC domains located away from this interface. The two arrangements are shown schematically in cartoon form below the structures.
Extended Data Figure 7 ∣
Extended Data Figure 7 ∣. Properties of the microtubule-associated LRRK2RCKW filaments.
a, b, The LRRK2RCKW structure solved in this work (a) was split at the junction between the N- and C-lobes of the kinase domain (L1949-A1950) (b). c, Docking of the two halves of LRRK2RCKW into a cryo-EM map of a LRRK2RCKW dimer solved in the presence of MLi-2. The dimer map is the same one shown in Fig. 3 and Extended Data Figs. 10 and 11. d, The model obtained in (c) was docked into cryo-EM maps of either WD40- or COR-mediated dimers obtained in the presence of MLi-2. e, Molecular models resulting from the docking in (d). f, Aligning, in alternating order, copies of the dimer models generated in (d, e) results in a right-handed filament with dimensions compatible with those of a microtubule, and its RoC domains pointing inwards (see Fig. 3g-i for more details). g, Docking of the two halves of LRRK2RCKW into a cryo-EM map of a LRRK2RCKW monomer solved in the absence of inhibitor (“Apo”). The map is the one shown in Fig. 1h and Extended Data Fig. 6. h, Three-way comparison of LRRK2RCKW (with domain colors) and the models resulting from the dockings into the MLi-2 WD40-mediated dimer map (c) (dark blue) and “Apo” monomer map (g) (light blue). The three structures were aligned using the C-lobes of their kinases and the WD40 domain. The superposition illustrates that the docking into the “Apo” map results in a structure very similar to that obtained from the trimer (Fig. 1) and that the presence of MLi-2 leads to a closing of the kinase. i, Molecular model of the microtubule-associated LRRK2RCKW filament obtained by docking a fragment of a microtubule structure (PDB: 6O2S) into the corresponding density in the sub-tomogram average (Fig. 2a). j, Same view as in (i) with the models shown as surface representations colored by their Coulomb potential. k, l, “Peeling off” of the structure shown in (j), with the LRRK2RCKW filament seen from the perspective of the microtubule surface (k) and the microtubule surface seen from the perspective of the LRRK2RCKW filament (l). Note: the acidic C-terminal tubulin tails are not ordered in the microtubule structure and thus are not included in the surface charge distributions. The Coulomb potential coloring scale is shown on the right.
Extended Data Figure 8 ∣
Extended Data Figure 8 ∣. Inhibition of motor motility by wild-type and I2020T LRRK2RCKW.
a, Example kymographs showing that increasing concentrations of LRRK2RCKW reduce kinesin runs. b, Example kymographs showing that 25 nM LRRK2RCKW reduces dynein runs. c, Representative kymographs of kinesin motility in the presence or absence of WT and I2020T LRRK2RCKW. d, The percentage of motile kinesin events per microtubule in the absence of LRRK2 or in the presence of 25 nM WT or I2020T LRRK2RCKW. Data are mean ± s.d. (n = 12 microtubules per condition quantified from two independent experiments). There is a significant difference between 0 nM and both 25 nM RCKW conditions (p < 0.0001), but no significant (ns) difference between the inhibitory effects of WT LRRK2RCKW versus I2020T LRRK2RCKW as calculated using the Kruskal-Wallis test with Dunn’s posthoc for multiple comparisons (compared to no LRRK2RCKW).
Extended Data Figure 9 ∣
Extended Data Figure 9 ∣. Type II kinase inhibitors rescue kinesin and dynein motility.
a-e, Ponatinib is a Type II, “DFG out” inhibitor. a, Superposition of the structures of Ponatinib-bound RIPK2 (PDB: 4C8B) and IRAK4 (PDB: 6EG9). Ponatinib is shown in yellow, and the DYG motif residues are shown in white. b, c For comparison, the structures of (a) Roco4 bound to LRRK2-IN-1 (PDB: 4YZM), a LRRK2-specific Type I, “DFG in” inhibitor, and (b) a model of Mitogen-activated kinase 1 (MAPK1) bound to MLi-2 (PDB: 5U6I), another LRRK2-specific Type I, “DFG in” inhibitor are shown. The inhibitor and DFG residues are colored as in (a). d, The structures in (a-c), as well as the kinase from LRRK2RCKW are shown superimposed. The color arrowheads point to the N-lobe’s β-sheet to highlight the difference in conformation between kinases bound to the two different types of inhibitors. Note that LRRK2RCKW’s kinase is even more open than the two Ponatinib-bound kinases. e, Rotated view of (d), now highlighting the position of the N-lobe’s αC helix. An additional alpha helix in the N-lobe of MAPK1 was removed from this view for clarity. f, The kinase inhibitors MLi-2 (1 μM), LRRK2-IN-1 (1 μM), Ponatinib (10 μM) and GZD-824 (10 μM) all inhibit LRRK2RCKW’s kinase activity in vitro compared to a DMSO control. A western blot using a phospho-specific antibody to Rab8a at the indicated time points is shown. g, A dose response curve showing the percentage of motile kinesin events per microtubule as a function of Ponatinib concentration with LRRK2RCKW (25 nM) or without LRRK2RCKW. Data are mean ± s.d. (from left to right: n = 12, 18, 16, 14, and 9 microtubules quantified from one experiment). ****p < 0.0001 (Kruskal-Wallis test with Dunn’s posthoc for multiple comparisons, compared to DMSO without LRRK2RCKW). h, Dose response curve of run lengths from data in (g) represented as a cumulative frequency distribution. From top to bottom: n = 654, 173, 584, 293, and 129 motile kinesin events. Mean decay constants (tau) ± confidence interval (CI) are (from top to bottom) 2.736 ± 0.113, 1.291 ± 0.181, 2.542 ± 0.124, 2.285 ± 0.134, and 1.653 ± 0.17. i, Representative kymographs of kinesin and dynein with DMSO or Type II inhibitors with or without LRRK2RCKW. j, The Type II kinase inhibitors Ponatinib and GZD-824 rescue kinesin run length, represented as a cumulative frequency distribution of run lengths with LRRK2RCKW (25 nM) or without LRRK2RCKW. From top to bottom: n = 893, 355, 507, 499, 524, and 529 runs from two independent experiments. Mean decay constants (tau) ± 95% CI are (from top to bottom) 2.070 ± 0.058, 0.8466 ± 0.091, 1.938 ± 0.065, 2.075 ± 0.07, 1.898 ±, 0.065, and 1.718 ± 0.064. Data were resampled with bootstrapping analysis and statistical significance was established using a one-way ANOVA with Dunnett’s test for multiple comparisons. DMSO run lengths were significantly different (p < 0.0001) between conditions (0 vs. 25 nM RCKW). Ponatinib (0 vs. 25 nM RCKW) and GZD-824 (0 vs. 25 nM LRRK2) were not significant. k, Same as in (j) but with dynein. From top to bottom: n = 659, 28, 289, 306, 254, and 339 runs from two independent experiments. Mean decay constants (tau) ± 95% confidence intervals; microns are 4.980 ± 0.147, 0.846 ± 0.415, 4.686 ± 0.142, 4.445 ± 0.172, 3.156 ± 0.09, 3.432 ± 0.188 (from top to bottom). Statistical significance as in (j) and run lengths were significantly different (p < 0.0001) between DMSO conditions (0 vs. 25 nM RCKW), and not significant for Ponatinib or GZD0824 conditions. The DMSO conditions are reproduced from Fig. 4f for comparison. l, Expression levels of GFP-LRRK2 (I2020T) in 293T cells treated with either DMSO or GZD-824 (5 μM). An Immunoblot with anti-GFP (LRRK2) and anti-GADPH (loading control), which is a representative image from three replicates, is shown. m, Quantification of GFP-LRRK2 (I2020T) expression levels from western blots similar to (l). Data are mean ± s.d. (n = 3 per condition). GZD-824 is not significantly different from the DMSO-treated control (Mann-Whitney test). n, 293T cells immunostained for tubulin showing that the microtubule architecture is not affected by GZD-824 or MLi-2 compared to DMSO treatment.
Figure 1 ∣
Figure 1 ∣. Cryo-EM structure of LRRK2RCKW.
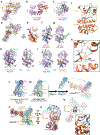
a, Schematic of the construct used in this study. The N-terminal half of LRRK2, absent from our construct, is shown in dim colors. The same color-coding of domains is used throughout the paper. The five major familial Parkinson’s Disease mutations and a Crohn’s Disease-linked mutation are indicated. b, c, 3.5Å cryo-EM map (b) and local resolution (c) of the LRRK2RCKW trimer, with one monomer highlighted. d, e, 3.8Å cryo-EM map (d) and local resolution (e) of a LRRK2RCKW monomer with improved resolution for the RoC and COR-A domains. f, Ribbon diagram of the atomic model of LRRK2RCKW. g, 8.1Å cryo-EM map of monomeric LRRK2RCKW with the model in (f) docked in. h, Location of the Parkinson’s and Crohn’s Disease mutations listed in (a). i, j, Interface between the C-terminal helix and the kinase domain in LRRK2RCKW with residues involved in electrostatic and hydrophobic interactions indicated.
Figure 2 ∣
Figure 2 ∣. Modeling the microtubule-associated LRRK2 filaments.
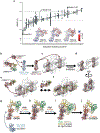
a, 14Å cryo-ET map of a segment of microtubule-associated LRRK2 filament in cells. The microtubule is shown in blue and the LRRK2 filament in grey. b, Microtubule-associated LRRK2RCKW filaments reconstituted in vitro from purified components. (Top) Single cryo-EM images of a naked microtubule (left), and WT (center) and I2020T (right) LRRK2RCKW filaments. (Bottom) Diffraction patterns (power spectra) calculated from the images above. White and hollow arrowheads indicate the layer lines corresponding to the microtubule and LRRK2RCKW, respectively. Scale bar: 20nm c, Fitting of the LRRK2RCKW structure, which has its kinase in an open conformation, into the cryo-ET map. d, Atomic model of the LRRK2RCKW filaments from (c). The white circle highlights the filament interface mediated by interactions between COR domains, where clashes are found. e, Superposition of the LRRK2RCKW structure (colored by domains) and a model of LRRK2RCKW with its kinase in a closed conformation in blue. The dashed blue arrow indicates the closing of the kinase. f, Fitting of the closed-kinase model of LRRK2RCKW into the cryo-ET map. g, Atomic model of the closed-kinase LRRK2RCKW filaments (g) with a white circle highlighting the same interface as in (d). h, i, Cartoon representation of the two filament models, highlighting the clashes observed with open-kinase LRRK2RCKW (h) and resolved with the closed-kinase model (i). 82% of clashes were resolved using the closed-kinase LRRK2RCKW model (see Methods for details).
Figure 3 ∣
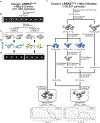
Figure 3 ∣. LRRK2RCKW forms WD40- and COR-mediated dimers outside the filaments.
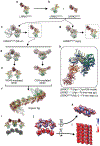
a-d, The filament model shown in Fig. 2j, k is shown here in grey, with either a WD40-mediated (a), or COR-mediated (c) LRRK2RCKW dimer highlighted with domain colors. The corresponding molecular models are shown next to the cartoons (b, d). e, f, Cryo-EM reconstructions of LRRK2RCKW dimers obtained in the absence of inhibitor (“Apo”), or in the presence of MLi-2. For each reconstruction, two orientations of the map are shown: down the two-fold axis at the dimerization interface (left), which matches the orientation of the models shown in (b, d), and perpendicular to it (right). The top row shows the cryo-EM map and the bottom row a transparent version of it with a model docked in. g, Molecular models of the WD40-mediated and COR-mediated LRRK2RCKW dimers obtained in the presence of MLi-2 (e, f) were aligned in alternating order. This panel shows the resulting right-handed helix. h, The helix has dimensions compatible with the diameter of a 12-protofilament microtubule (EMD-5192), which was the species used to obtain the cryo-ET map shown in Fig. 2a, and has its RoC domains pointing towards the microtubule surface.
Figure 4 ∣
Figure 4 ∣. LRRK2RCKW inhibits the motility of kinesin and dynein.
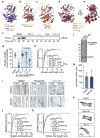
a, Schematic of the single-molecule motility assay. b, c, The percentage (mean ± s.d.) of motile events per microtubule as a function of LRRK2RCKW concentration for kinesin (b) and dynein (c). ****p < 0.0001 (Kruskal-Wallis test with Dunn’s posthoc for multiple comparisons for (b)) and ****p < 0.0001 (Mann Whitney test) for (c)). d, Cumulative frequency distribution of kinesin run lengths as a function of LRRK2RCKW concentration. Mean decay constants (tau) are shown. The 12.5 nM and 25 nM, but not 6.25 nM, conditions were significantly different (p < 0.0001) than the 0 nM condition (one-way ANOVA with Dunnett’s test for multiple comparisons using error generated from a bootstrapping analysis). e, Velocity of kinesin as a function of LRRK2RCKW concentration. Data are mean ± s.d. ****p < 0.0001 (one-way ANOVA with Dunn’s posthoc for multiple comparisons). f, Cumulative frequency distribution of dynein run lengths as a function of LRRK2RCKW concentration. Mean decay constants (tau) are shown. Data was resampled with bootstrapping analysis and was significant. p < 0.0001 (unpaired t-test with Welch’s correction using error generated from a bootstrapping analysis).
Figure 5 ∣
Figure 5 ∣. Type II, but not Type I, kinase inhibitors rescue kinesin and dynein motility and reduce LRRK2 filament formation in cells.
a, b, Effects of different kinase inhibitors on LRRK2RCKW’s inhibition of kinesin (a) and dynein (b) motility. Data shown is the percentage of motile events per microtubule (MT) as a function of LRRK2RCKW concentration in the absence (DMSO) or presence of the indicated inhibitors (Ponatinib and GZD-824: 10 μM; MLi-2 and LRRK2-IN-1: 1 μM). Data are mean ± s.d. ***p < 0.001 and ****p < 0.0001 (Kruskal-Wallis test with Dunn’s posthoc for multiple comparisons within drug only). c, Treatment with MLi-2 (500 nM) for 2 hrs increases WT GFP-LRRK2 filament formation in 293T cells. Data are mean ± s.d. ****p=0.0002 (Mann Whitney test). d, Treatment with GZD-824 (5 μM) for 30 mins decreases GFP-LRRK2 (I2020T) filament formation in 293 cells. Data are mean ± s.d. *p=0.0133 and **p=0.0012 (Kruskal-Wallis with Dunn’s posthoc test for multiple comparisons). e, Schematic representation of our hypothesis. LRRK2’s kinase can be in an open or closed conformation. The different species we observed are represented in the rounded rectangles, but only monomers are shown on the microtubule for simplicity. Our model proposes that the kinase-closed form of LRRK2 favors oligomerization on microtubules.

Comment in

References

    1. Monfrini E & Di Fonzo A Leucine-Rich Repeat Kinase (LRRK2) Genetics and Parkinson’s Disease. Adv Neurobiol 14, 3–30 (2017). - PubMed
    1. Di Maio R, Hoffman EK, Rocha EM, Keeney MT, Sanders LH, De Miranda BR, Zharikov A, Van Laar A, Stepan AF, Lanz TA, Kofler JK, Burton EA, Alessi DR, Hastings TG & Greenamyre JT LRRK2 activation in idiopathic Parkinson’s disease. Sci Transl Med 10, (2018). - PMC - PubMed
    1. Abeliovich A & Gitler AD Defects in trafficking bridge Parkinson’s disease pathology and genetics. Nature 539, 207–216 (2016). - PubMed
    1. Gloeckner CJ, Kinkl N, Schumacher A, Braun RJ, O’Neill E, Meitinger T, Kolch W, Prokisch H & Ueffing M The Parkinson disease causing LRRK2 mutation I2020T is associated with increased kinase activity. Hum Mol Genet 15, 223–232 (2006). - PubMed
    1. Watanabe R, Buschauer R, Bohning J, Audagnotto M, Lasker K, Lu TW, Boassa D, Taylor S & Villa E The in situstructure of Parkinson’s disease-linked LRRK2. bioRxiv 7, (2019). - PMC - PubMed

METHODS AND EXTENDED DATA REFERENCES

    1. Sui H & Downing KH Structural basis of interprotofilament interaction and lateral deformation of microtubules. Structure (London, England : 1993) 18, 1022–1031 (2010). - PMC - PubMed
    1. Pettersen EF, Goddard TD, Huang CC, Couch GS, Greenblatt DM, Meng EC & Ferrin TE UCSF Chimera–a visualization system for exploratory research and analysis. J Comput Chem 25, 1605–1612 (2004). - PubMed
    1. Charrier J-D, Miller A, Kay DP, Brenchley G, Twin HC, Collier PN, Ramaya S, Keily SB, Durrant SJ, Knegtel RMA, Tanner AJ, Brown K, Curnock AP & Jimenez J-M Discovery and structure-activity relationship of 3-aminopyrid-2-ones as potent and selective interleukin-2 inducible T-cell kinase (Itk) inhibitors. J Med Chem 54, 2341–2350 (2011). - PubMed
    1. Woehlke G, Ruby AK, Hart CL, Ly B, Hom-Booher N & Vale RD Microtubule interaction site of the kinesin motor. Cell 90, 207–216 (1997). - PubMed
    1. Suloway C, Pulokas J, Fellmann D, Cheng A, Guerra F, Quispe J, Stagg S, Potter CS & Carragher B Automated molecular microscopy: the new Leginon system. J Struct Biol 151, 41–60 (2005). - PubMed

Publication types

MeSH terms