. 2020 Aug 20;18(1):223.
doi: 10.1186/s12916-020-01687-7.

Seasonal influenza vaccination in Kenya: an economic evaluation using dynamic transmission modelling

Affiliations

Seasonal influenza vaccination in Kenya: an economic evaluation using dynamic transmission modelling

Jeanette Dawa et al. BMC Med. .

Abstract

Background: There is substantial burden of seasonal influenza in Kenya, which led the government to consider introducing a national influenza vaccination programme. Given the cost implications of a nationwide programme, local economic evaluation data are needed to inform policy on the design and benefits of influenza vaccination. We set out to estimate the cost-effectiveness of seasonal influenza vaccination in Kenya.

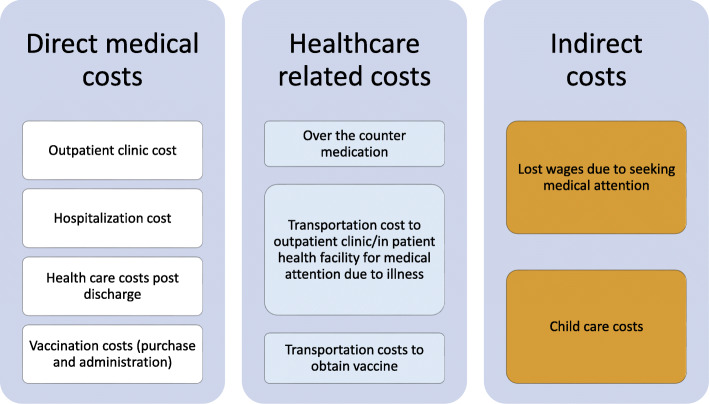
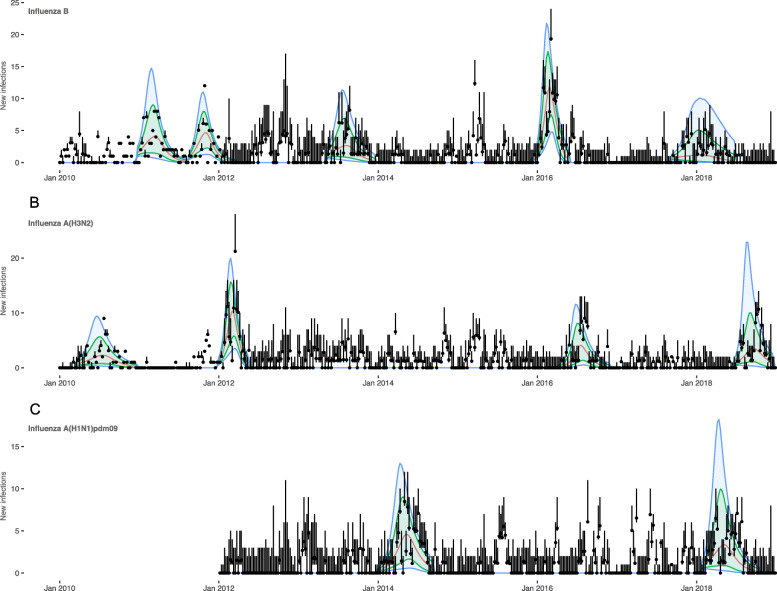
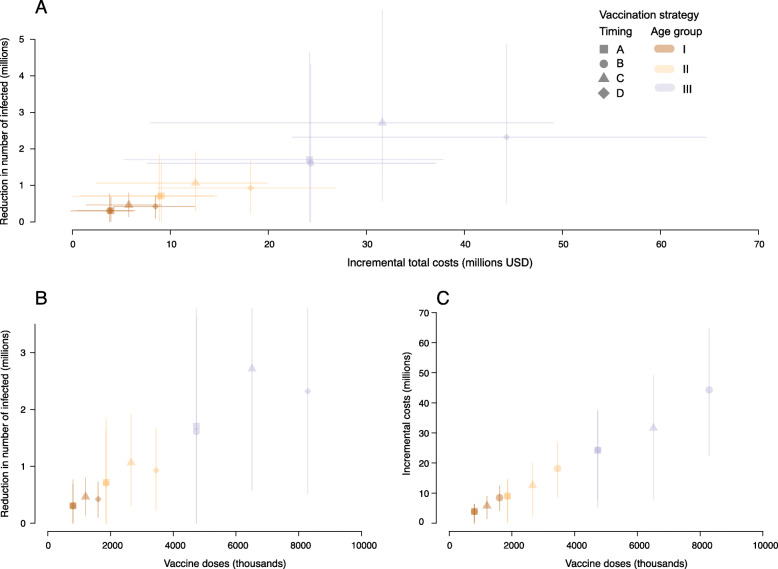
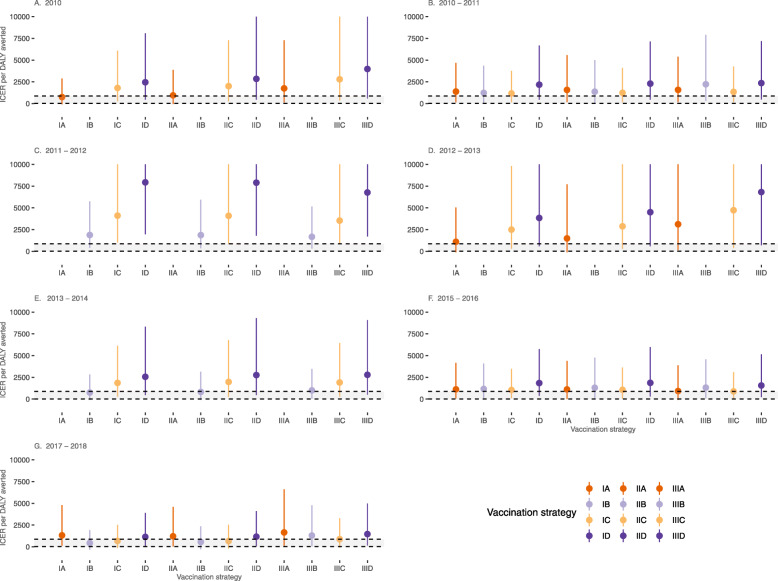
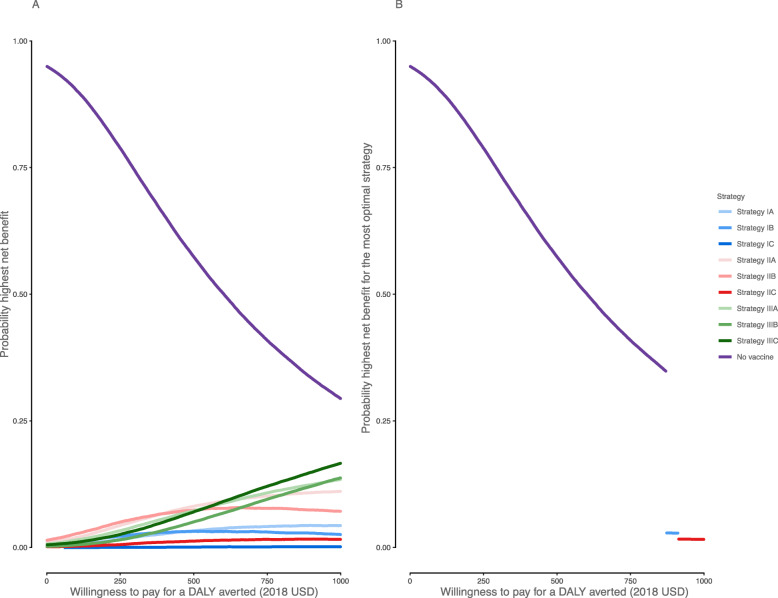
Methods: We fitted an age-stratified dynamic transmission model to active surveillance data from patients with influenza from 2010 to 2018. Using a societal perspective, we developed a decision tree cost-effectiveness model and estimated the incremental cost-effectiveness ratio (ICER) per disability-adjusted life year (DALY) averted for three vaccine target groups: children 6-23 months (strategy I), 2-5 years (strategy II) and 6-14 years (strategy III) with either the Southern Hemisphere influenza vaccine (Strategy A) or Northern Hemisphere vaccine (Strategy B) or both (Strategy C: twice yearly vaccination campaigns, or Strategy D: year-round vaccination campaigns). We assessed cost-effectiveness by calculating incremental net monetary benefits (INMB) using a willingness-to-pay (WTP) threshold of 1-51% of the annual gross domestic product per capita ($17-$872).

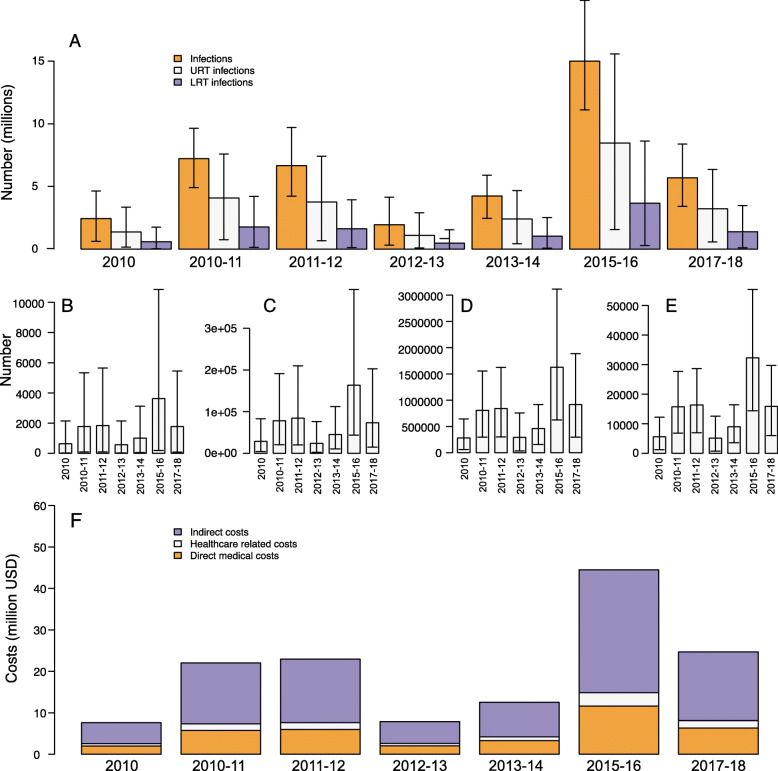
Results: The mean number of infections across all ages was 2-15 million per year. When vaccination was well timed to influenza activity, the annual mean ICER per DALY averted for vaccinating children 6-23 months ranged between $749 and $1385 for strategy IA, $442 and $1877 for strategy IB, $678 and $4106 for strategy IC and $1147 and $7933 for strategy ID. For children 2-5 years, it ranged between $945 and $1573 for strategy IIA, $563 and $1869 for strategy IIB, $662 and $4085 for strategy IIC, and $1169 and $7897 for strategy IID. For children 6-14 years, it ranged between $923 and $3116 for strategy IIIA, $1005 and $2223 for strategy IIIB, $883 and $4727 for strategy IIIC and $1467 and $6813 for strategy IIID. Overall, no vaccination strategy was cost-effective at the minimum ($17) and median ($445) WTP thresholds. Vaccinating children 6-23 months once a year had the highest mean INMB value at $872 (WTP threshold upper limit); however, this strategy had very low probability of the highest net benefit.

Conclusion: Vaccinating children 6-23 months once a year was the most favourable vaccination option; however, the strategy is unlikely to be cost-effective given the current WTP thresholds.

Keywords: Cost-effectiveness; Dynamic transmission model; Economic evaluation; Influenza vaccine; Low- and middle-income countries; Vaccine target group; Vaccine timing.


Conflict of interest statement

The authors declare that they have no competing interests.

Figures

Fig. 1
Fig. 1
Summary of costs associated with influenza illness and vaccination. Shading of boxes: white = direct medical costs paid by government (presupposes a universal healthcare scheme with government as the main healthcare payer), blue = healthcare-related costs paid by individual, orange = indirect costs paid by individual
Fig. 2
Fig. 2
Comparison of the fit of the model to weekly influenza-positive SARI cases in all ages. Positive cases detected in the influenza surveillance system (black) with hypergeometric 95% confidence interval. Lines and shading represent the median (red) and 50% (green) and 75% credible intervals (blue) of the fitted model. Note that the model is fitted to age-specific data, but age groups are aggregated here for clarity. a Influenza B. b Influenza A(H3N2). c Influenza A(H1N1)pdm09). Influenza A(H1N1)pdm09) data from January 2010 to December 2012 were excluded from the analysis
Fig. 3
Fig. 3
Influenza burden in the absence of vaccination in all age groups, 2010–2018. Mean and 95% credible interval shown for each calendar year (September–August). a Influenza infections, upper respiratory tract infections and lower respiratory tract infections. b Deaths. c DALYs. d Outpatient visits. e Hospitalisations. f Costs. Note that y-axes vary. There were three periods of high influenza activity in Sep 2017–Aug 2018, two periods of high influenza activity in Sep 2010–Aug 2011 and Sep 2015–Aug 2016. Years with no detectable periods of high influenza activity are not included in the figure
Fig. 4
Fig. 4
Summary of annual mean incremental cost, reductions in infections and vaccine doses per strategy. a Annual reduction in number of infections and incremental total societal costs per strategy. b Annual reduction in number of infections and vaccine doses per vaccine strategy. c Annual incremental total societal costs and vaccine doses costs per strategy. Strategies are vaccinating children 6–23 months (strategy I), 2–5 years (strategy II) and 6–14 years (strategy III) with either the Southern Hemisphere influenza vaccine (Strategy A) or Northern Hemisphere vaccine (Strategy B) or both (Strategy C: twice yearly 3-month vaccination periods, or Strategy D: year-round vaccination). The points mark posterior mean estimates and lines 95% credible intervals
Fig. 5
Fig. 5
ICER per DALY averted and 95% CI. Results for 2014–15 and 2016–17 are not shown as there were no periods of high influenza activity detected in these years and calculation of ICER values per DALY averted would produce an infinite value as no DALYs would be averted. Similarly, ICER values are not shown for A and B strategies where vaccine administration was mistimed to influenza activity as vaccination was considered ineffective that year. Note the y-axes are cut off at 10,000 while actual values may exceed this value. Section shaded grey between the horizontal dotted lines represents outputs that fall within a willingness-to-pay threshold of 1–51% of the GDP per capita (i.e. between $17 and $872). Values below zero are cost saving. Strategies are vaccinating children 6–23 months (strategy I), 2–5 years (strategy II) and 6–14 years (strategy III) with either the Southern Hemisphere influenza vaccine (Strategy A) or Northern Hemisphere vaccine (Strategy B) or both (Strategy C: twice yearly 3-month vaccination periods, or Strategy D: year-round vaccination)
Fig. 6
Fig. 6
Cost-effectiveness acceptability curve and frontier for strategies with the highest incremental net monetary benefit. a Cost-effectiveness acceptability curve. b Cost-effectiveness acceptability frontier. NB: X axis is limited to 1000 USD per DALY averted. Strategies are vaccinating children 6–23 months (strategy I), 2–5 years (strategy II) and 6–14 years (strategy III) with either the SH influenza vaccine (Strategy A) or NH vaccine (Strategy B) or both (Strategy C: twice yearly 3-month vaccination periods, or Strategy D: year-round vaccination)

References

    1. Dawa JA, Chaves SS, Nyawanda B, Njuguna HN, Makokha C, Otieno NA, et al. National burden of hospitalized and non-hospitalized influenza-associated severe acute respiratory illness in Kenya, 2012-2014. Influenza Other Respir Viruses. 2018;12(1):30–37. - PMC - PubMed
    1. Emukule GO, Paget J, van der Velden K, Mott JA. Influenza-Associated Disease Burden in Kenya: A Systematic Review of Literature. PLoS One. 2015;10(9):1–14. - PMC - PubMed
    1. Office of Director of Medical Services Ministry of Health . Communication to stakeholders: Progress update on plans to introduce influenza vaccine into routine immunization in Kenya. Nairobi: Ministry of Health, Kenya; 2016.
    1. Dawa J, Chaves SS, Ba Nguz A, Kalani R, Anyango E, Mutie D, et al. Developing a seasonal influenza vaccine recommendation in Kenya: process and challenges faced by the National Immunization Technical Advisory Group (NITAG) Vaccine. 2019;37(3):464–472. - PubMed
    1. Ott JJ, Klein Breteler J, Tam JS, Hutubessy RC, Jit M, de Boer MR. Influenza vaccines in low and middle income countries: a systematic review of economic evaluations. Hum Vaccines Immunotherapeutics. 2013;9(7):1500–1511. - PMC - PubMed

Publication types

Substances