. 2020 Aug 20;5(16):e138034.
doi: 10.1172/jci.insight.138034.

Lipid mediators and biomarkers associated with type 1 diabetes development

Affiliations

Lipid mediators and biomarkers associated with type 1 diabetes development

Alexander J Nelson et al. JCI Insight. .

Abstract

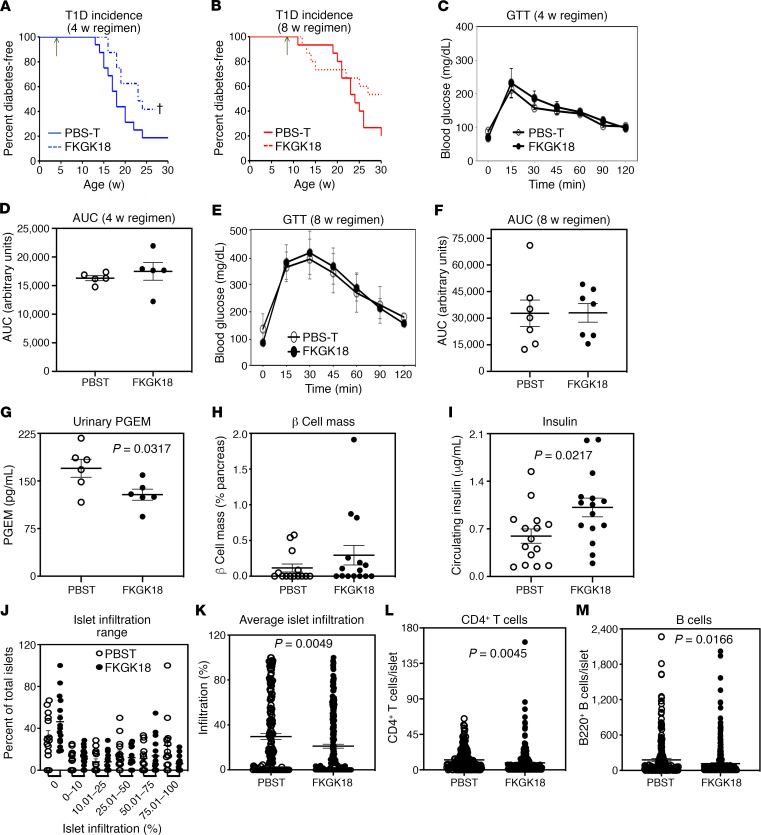
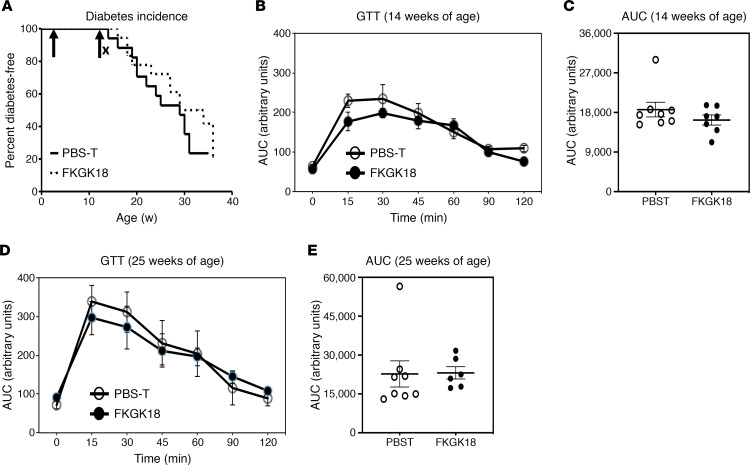
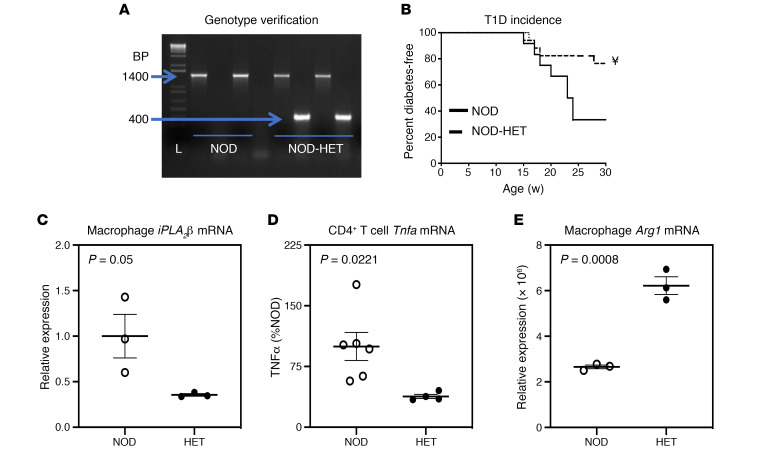
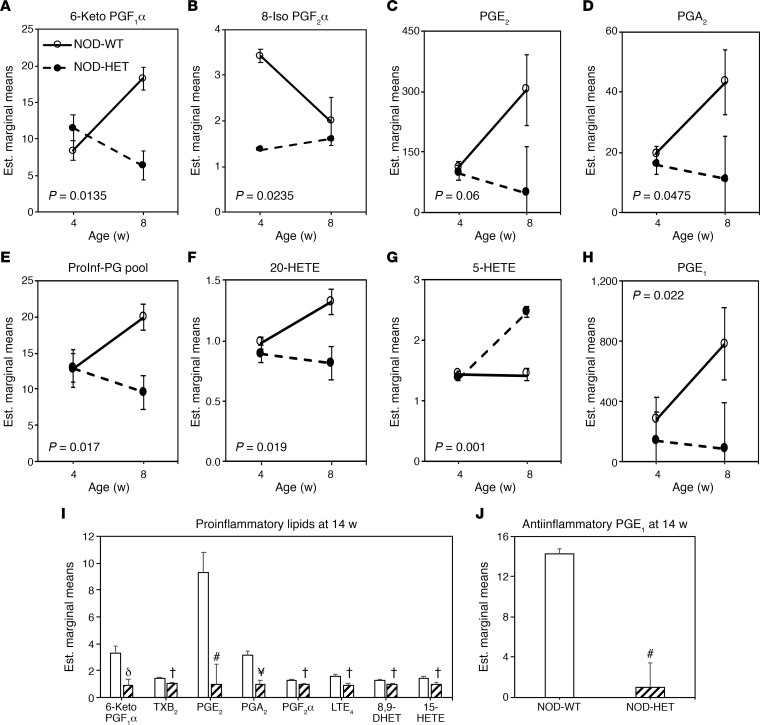
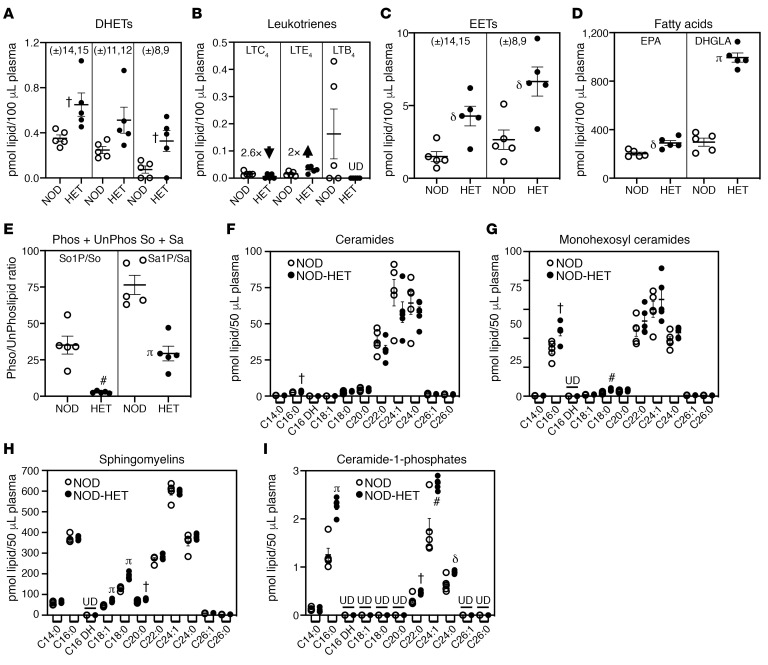
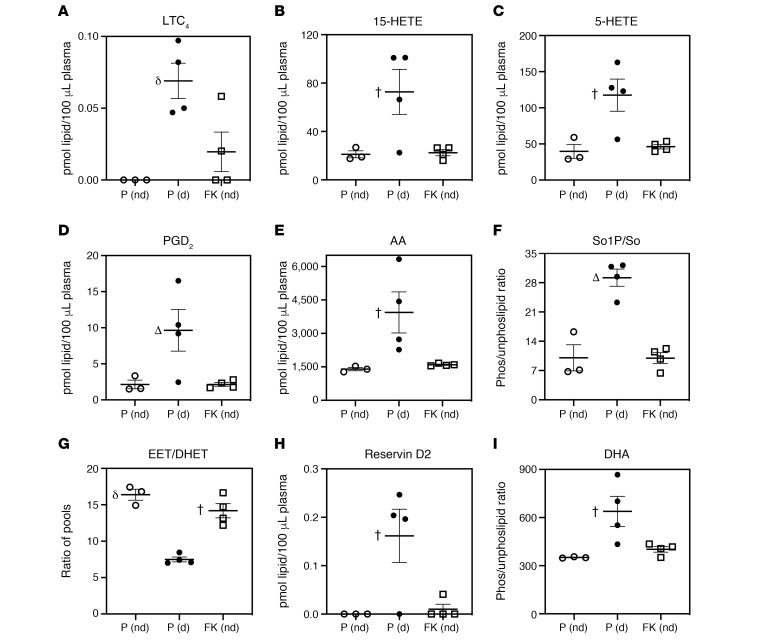
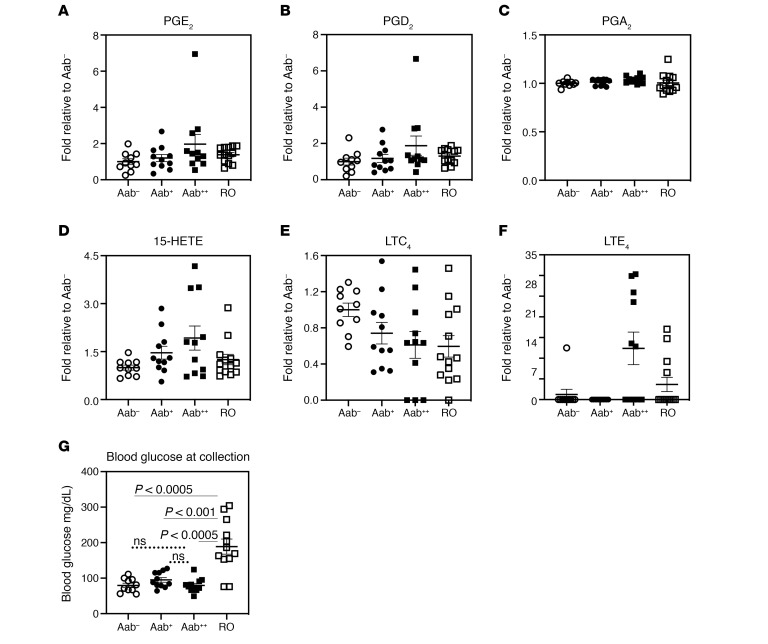
Type 1 diabetes (T1D) is a consequence of autoimmune β cell destruction, but the role of lipids in this process is unknown. We previously reported that activation of Ca2+-independent phospholipase A2β (iPLA2β) modulates polarization of macrophages (MΦ). Hydrolysis of the sn-2 substituent of glycerophospholipids by iPLA2β can lead to the generation of oxidized lipids (eicosanoids), pro- and antiinflammatory, which can initiate and amplify immune responses triggering β cell death. As MΦ are early triggers of immune responses in islets, we examined the impact of iPLA2β-derived lipids (iDLs) in spontaneous-T1D prone nonobese diabetic mice (NOD), in the context of MΦ production and plasma abundances of eicosanoids and sphingolipids. We find that (a) MΦNOD exhibit a proinflammatory lipid landscape during the prediabetic phase; (b) early inhibition or genetic reduction of iPLA2β reduces production of select proinflammatory lipids, promotes antiinflammatory MΦ phenotype, and reduces T1D incidence; (c) such lipid changes are reflected in NOD plasma during the prediabetic phase and at T1D onset; and (d) importantly, similar lipid signatures are evidenced in plasma of human subjects at high risk for developing T1D. These findings suggest that iDLs contribute to T1D onset and identify select lipids that could be targeted for therapeutics and, in conjunction with autoantibodies, serve as early biomarkers of pre-T1D.

Keywords: Autoimmune diseases; Diabetes; Endocrinology; Inflammation; Macrophages.


Conflict of interest statement

Conflict of interest: The authors have declared that no conflict of interest exists.

Figures

Figure 1
Figure 1. Effects of temporal FKGK18 regimen on T1D incidence and islet phenotype.
Female NOD mice were administered FKGK18 (20 mg/kg, 3 × weekly) or vehicle (PBS-T) starting at 4 or 8 weeks of age. (A and B) Diabetes incidence. Blood glucose was monitored weekly in the 4-week (A; n = 17 and 15 for PBS-T and FKGK18 groups, respectively) and 8-week (B; n = 15 each in the PBS-T and FKGK18 groups) regimen groups for up to 30 weeks. Two consecutive readings of ≥ 275 mg/dL were recorded as onset of T1D (P < 0.05). (C–F) Glucose tolerance test (GTT). Overnight fasted mice were administered glucose (2 g/kg, i.p.), glucose levels in blood from tail vein were monitored over a 2-hour period, and AUC were generated. (C and D) Four-week group at 14 weeks of age; n = 5 each in the PBS-T and FKGK18 groups. (E and F) Eight-week group at 25 weeks of age; n = 7 and 5 for PBS-T and FKGK18 groups, respectively. (G–I) Phenotype parameters in the 8-week regimen group. (G) Urinary PGE2 metabolites (PGEMs, n = 6 in each group, 18 weeks of age). (H and I) β Cell mass (PBS-T, n = 15; FKGK18, n = 14) (H) and circulating insulin (n = 15 in each group) (I) were determined at sacrifice (PBS-T, 14–30 weeks of age; FKGK18, 16–36 weeks of age). (J and K) Islet infiltration. Paraffin sections (10 μm) of pancreas were prepared and stained with H&E. Percent infiltration for each islet was calculated as the value of noninfiltrated area subtracted from total islet area (% infiltrate = 100 × [(total area – noninfiltrated area)/(total area)]) using ImageJ software. (PBS-T, n = 14 and 166 islets; FKGK18, n = 15 and 260 islets). (J) Islet Infiltration Range. (K) Average islet infiltration. (L and M) Islet immune cell phenotype. Paraffin sections (10 μm) of pancreas were prepared and stained for CD4+-T cells or B (B220) cells. Data presented are mean ± SEM of CD4+ T cells or B cells per islet. (L) Quantitation of CD4± T cells per islet (PBS-T, n = 14 and 223 islets; FKGK18, n = 15 and 290 islets). (M) Quantitation of B cells per islet (PBS-T, n = 14 and 213 islets; FKGK18, n = 15 and 328 islets). Statistical analyses: (A and B) Mantel-Cox test; (D–M) Student’s t test.
Figure 2
Figure 2. Effects of FKGK18-withdrawal regimen on T1D incidence and glucose tolerance.
Female NOD mice were administered FKGK18 (20 mg/kg, 3 × weekly, n = 18) or vehicle (PBS-T, n = 17) starting at 10 days of age and until 14 weeks of age. (A) T1D incidence. Blood glucose was monitored weekly for up to 30 weeks, and 2 consecutive readings of ≥ 275 mg/dL were recorded as onset of T1D. (B and D) Glucose tolerance test (GTT). Assessed at 14 (B) and 25 (D) weeks of age (data are presented as mean ± SEM), as described in Figure 1. (C and E) Corresponding AUC. N values for PBS-T & FKGK18: 8 and 8 (B and C); , 8 and 6 (D and E), respectively. Statistical analyses: (A) Mantel-Cox test; (C and E) Student’s t test.
Figure 3
Figure 3. NOD.iPLA2β+/– genotype and diabetes phenotype.
(A) Genotype. DNA was generated from tail clips and progeny were genotyped by PCR analyses. Reactions were performed in the presence of primers for the WT sequence (NOD) or for the disrupted sequence (NOD-HET) for each mouse. The expected bands for the WT (1400 bp) and HET (1400 and 400 bp) in 2 mice each are presented. L, bp ladder. (B) T1D incidence. Blood glucose was monitored weekly for up to 30 weeks, and 2 consecutive readings of ≥ 275 mg/dL were recorded as onset of diabetes (n = 12 and 17 for NOD and NOD-HET groups, respectively). NOD-HET significantly different from NOD; ¥P < 0.001. (C) RNA was isolated from NOD (n = 3) and NOD-HET (n = 3) macrophages and cDNA prepared for iPLA2β mRNA analyses by qPCR. (D) Production of TNF-α by CD4+ T cells. Splenocytes were prepared from the NOD and NOD-HET, and CD4+ T cells were isolated and activated, as described in Methods. The media was collected at 72 hours, and TNF-α concentration was determined by ELISA (n = 3 per group). (E) RNA was isolated from NOD (n = 3) and NOD-HET (n = 3) macrophages and cDNA prepared for Arg1. Statistical analyses: (B) Mantel-Cox test; (C–E) Student’s t test.
Figure 4
Figure 4. Comparison of eicosanoid production by MΦNOD and MΦNOD-HET.
Peritoneal MΦ isolated from female NOD and NOD-HET mice were treated with vehicle control (DMSO) or classically activated with IFN-γ + LPS, and the media was collected for eicosanoid analyses at 16 hours. The data (estimated marginal mean ± SEM) represent fold-change in activated lipids, relative to corresponding control. MΦNOD (n = 9 and 5) and MΦNOD-HET (n = 4 and 3) at 4 and 8 weeks, respectively. (A) 6-Keto PGF1α. (B) 8-Iso PGF2α. (C) PGE2. (D) PGA2. (E) Proinflammatory prostaglandin (PG) pool. (F) 20-HETE. (G) 5-HETE. (H) PGE1. (I and J) Proinflammatory (I) and antiinflammatory PGE1 (J) at 14 weeks. NOD-HET significantly different from NOD, P < 0.05; δP < 0.01; #P < 0.005; ¥P < 0.001, n = 9 in each group. Statistical analyses: (A–H) multivariate 2-way ANOVA and time-course ANOVA; (I and J) Student’s t test.
Figure 5
Figure 5. Comparison of select plasma lipids during the prediabetic phase.
(A–I) Plasma was prepared from NOD (n = 5) and NOD-HET (n = 5) and processed for lipidomics analyses of eicosanoids (A–C), fatty acids (D), and sphingolipids (E–I). The data (mean ± SEM) represent pmol of each lipid species in 100 μL (A–D) or 50 μL (E–I) plasma. (A) DHETs. (B) Leukotrienes. (C) EETs. (D) EPA and DHGLA. (E) Sphingosine and sphinganine (phosphorylated/nonphosphorylated). (F) Ceramides. (G) Monohexosyl Ceramides. (H) Sphingomyelins. (I) Ceramide-1-phosphates. NOD-HET significantly different from NOD, P < 0.05; δP < 0.01; #P < 0.005; πP < 0.0005. Statistical analyses: Student’s t test. UD, undetected.
Figure 6
Figure 6. Comparison of select plasma lipids at T1D onset.
NOD mice were treated with PBS-T or with FKGK18, starting at 10 days of age, and sacrificed at the onset of T1D (d) or at 30 weeks if they remained nondiabetic (nd). Plasma was prepared from these mice and processed for lipidomics analyses. The data (mean ± SEM) represent pmol of each lipid species in 100 or 50 μL plasma. (A) LTC4. (B) 15-HETE. (C) 5-HETE. (D) PGD2. (E) AA. (F) So1P/So. (G) EET/DHET. (H) Resolvin D2. (I) DHA. n = 3, 4, and 4 for PBS-T (P [nd]), PBS-T (P [d]), and FKGK18 (FK [nd]), respectively. P (d) significantly different from the other groups, P < 0.05; δP < 0.01; ΔP < 0.000001. One-way ANOVA.
Figure 7
Figure 7. Diabetic and nondiabetic human plasma lipidome.
Lipidomics analyses were performed in plasma from euglycemic autoantibody negative (Aab), 1 Aab-positive (Aab+), and 2 Aab-positive (Aab++), and recent T1D onset (3.34 ± 0.24 months T1D duration) (RO) subjects. The number of subjects, sex (female [F]/male [M]) distribution, and age (years) at visit are: Aab, 10, 2F/8M, 9.26 ± 1.68; Aab+, 11, 6F/5M, 14.60 ± 1.38; Aab++, 11, 8F/3M, 12.43 ± 1.66; RO, 13, 9F/4M, 8.99 ± 1.33. (A–F) Fold-abundances in lipids, relative to Aab, are presented with mean ± SEM. (G) Blood glucose at sample collection. Statistical analyses: (A–F) Pearson, Kendall, and Spearman’s rank order correlation; G, Student’s t test. All n is the same as previous panels, except RO = 12.

References

    1. Anderson MS, Bluestone JA. The NOD mouse: a model of immune dysregulation. Annu Rev Immunol. 2005;23:447–485. doi: 10.1146/annurev.immunol.23.021704.115643. - DOI - PubMed
    1. Gijón MA, Leslie CC. Phospholipases A2. Semin Cell Dev Biol. 1997;8(3):297–303. doi: 10.1006/scdb.1997.0151. - DOI - PubMed
    1. Luo P, Wang MH. Eicosanoids, β-cell function, and diabetes. Prostaglandins Other Lipid Mediat. 2011;95(1-4):1–10. doi: 10.1016/j.prostaglandins.2011.06.001. - DOI - PMC - PubMed
    1. Tessaro FH, Ayala TS, Martins JO. Lipid mediators are critical in resolving inflammation: a review of the emerging roles of eicosanoids in diabetes mellitus. Biomed Res Int. 2015;2015:568408. - PMC - PubMed
    1. Rahnema P, Shimoni Y, Nygren A. Reduced conduction reserve in the diabetic rat heart: role of iPLA2 activation in the response to ischemia. Am J Physiol Heart Circ Physiol. 2011;300(1):H326–H334. doi: 10.1152/ajpheart.00743.2010. - DOI - PubMed

Publication types

MeSH terms