. 2020 Aug 20;5(16):e138729.
doi: 10.1172/jci.insight.138729.

CD28 costimulation drives tumor-infiltrating T cell glycolysis to promote inflammation

Affiliations

CD28 costimulation drives tumor-infiltrating T cell glycolysis to promote inflammation

Kathryn E Beckermann et al. JCI Insight. .

Abstract

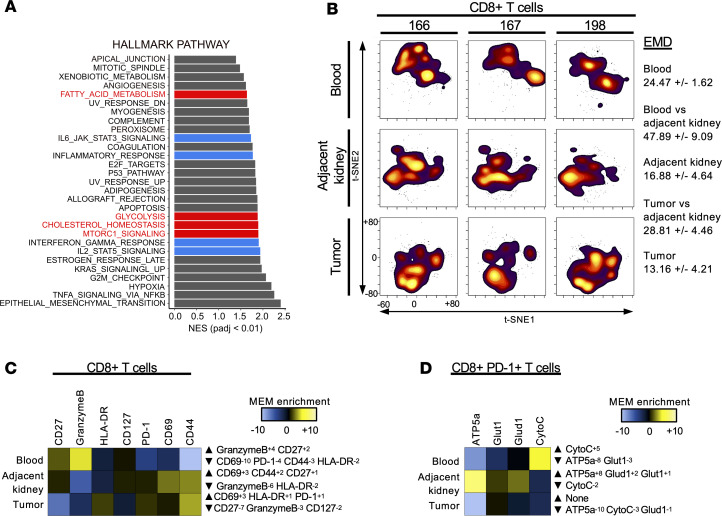
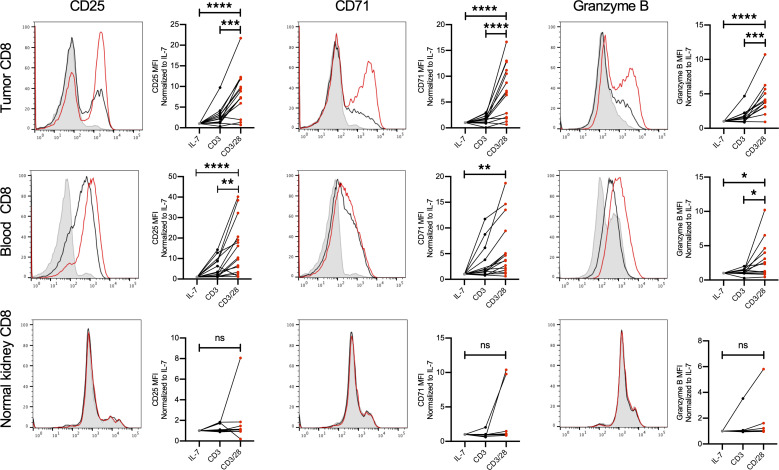
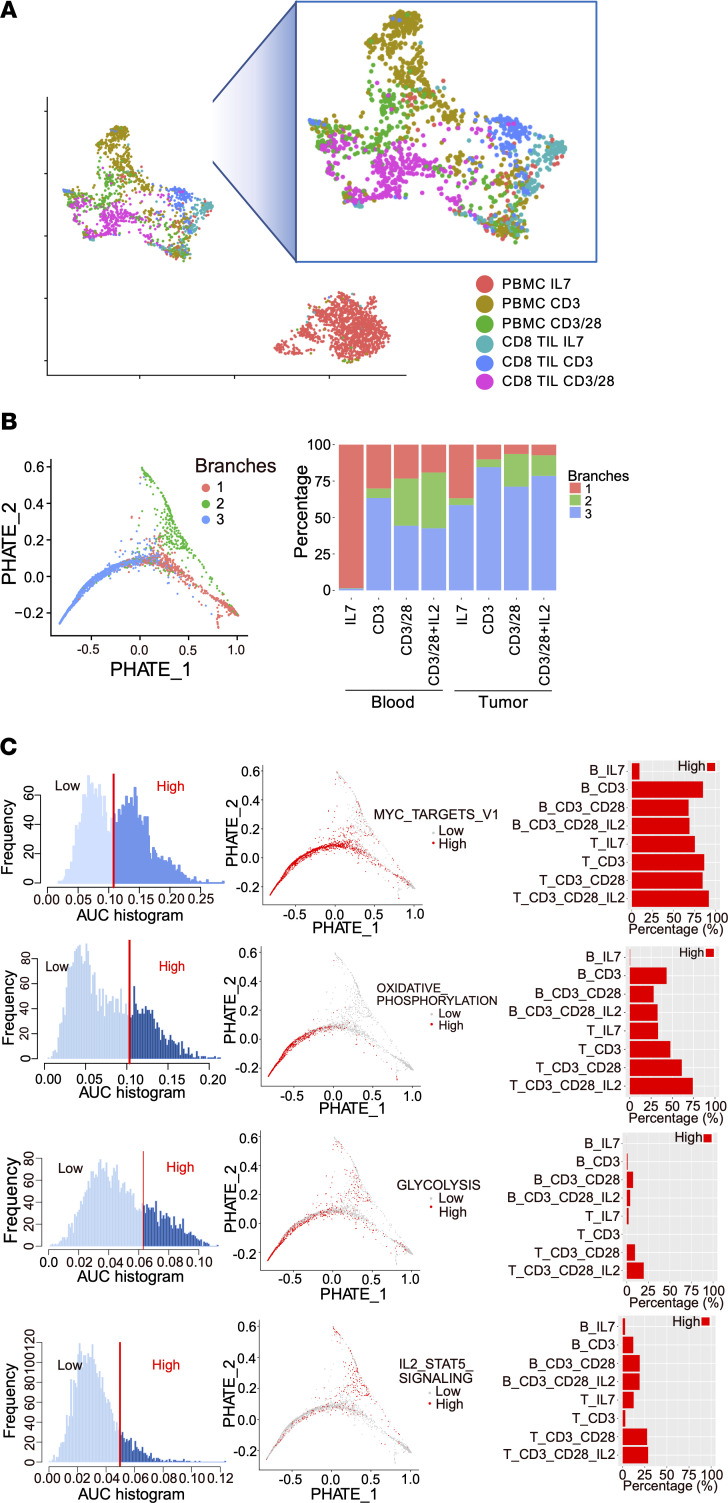
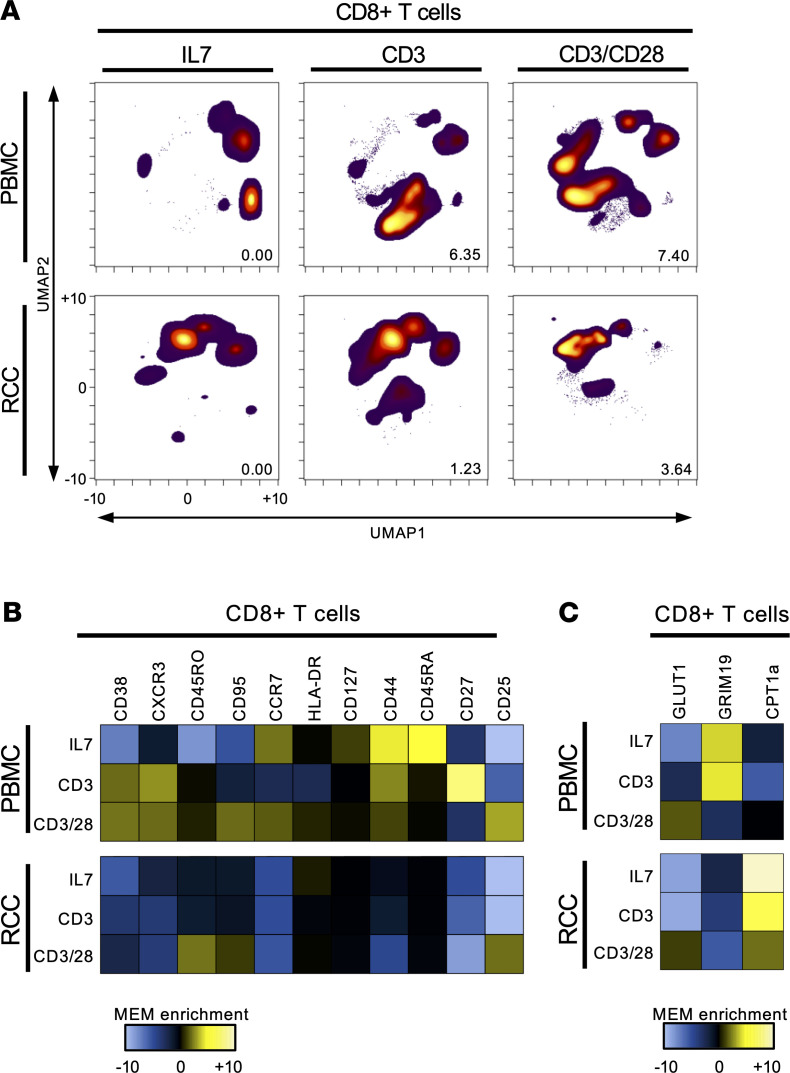
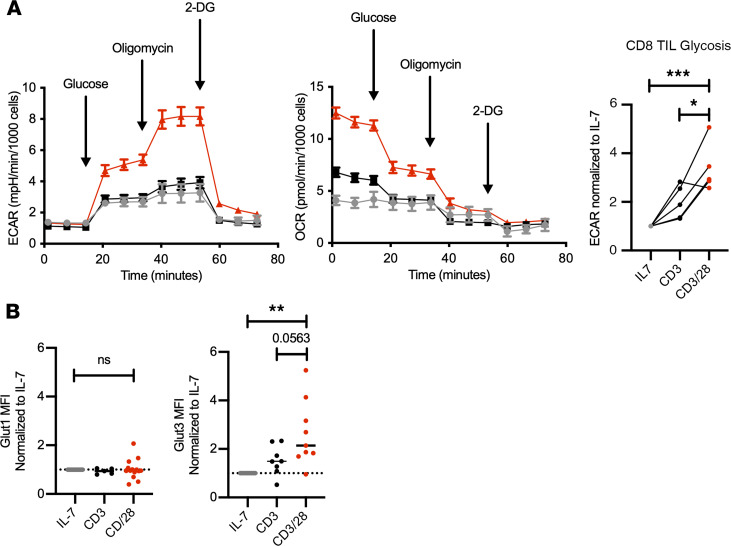
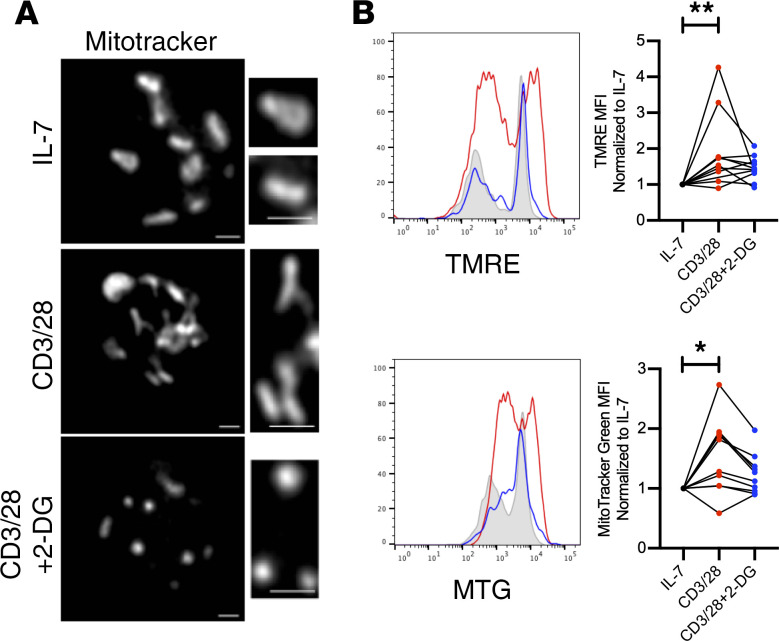
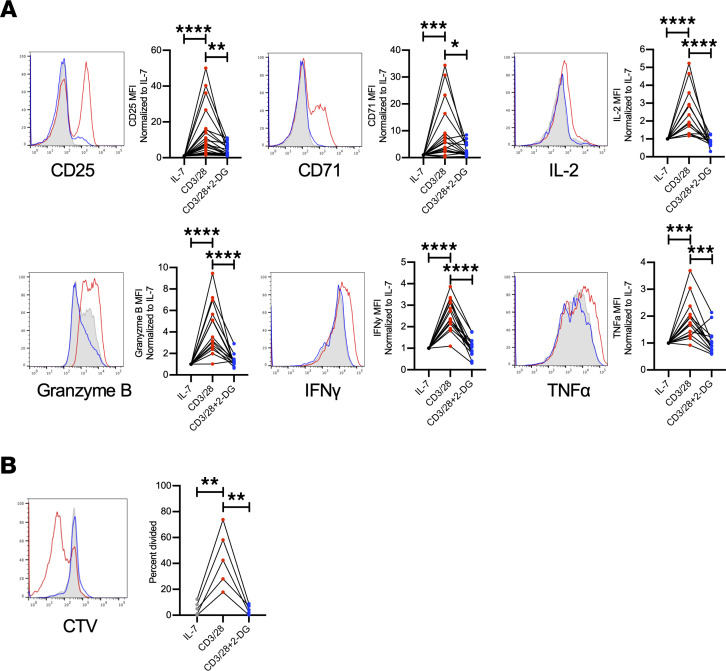
Metabolic reprogramming dictates the fate and function of stimulated T cells, yet these pathways can be suppressed in T cells in tumor microenvironments. We previously showed that glycolytic and mitochondrial adaptations directly contribute to reducing the effector function of renal cell carcinoma (RCC) CD8+ tumor-infiltrating lymphocytes (TILs). Here we define the role of these metabolic pathways in the activation and effector functions of CD8+ RCC TILs. CD28 costimulation plays a key role in augmenting T cell activation and metabolism, and is antagonized by the inhibitory and checkpoint immunotherapy receptors CTLA4 and PD-1. While RCC CD8+ TILs were activated at a low level when stimulated through the T cell receptor alone, addition of CD28 costimulation greatly enhanced activation, function, and proliferation. CD28 costimulation reprogrammed RCC CD8+ TIL metabolism with increased glycolysis and mitochondrial oxidative metabolism, possibly through upregulation of GLUT3. Mitochondria also fused to a greater degree, with higher membrane potential and overall mass. These phenotypes were dependent on glucose metabolism, as the glycolytic inhibitor 2-deoxyglucose both prevented changes to mitochondria and suppressed RCC CD8+ TIL activation and function. These data show that CD28 costimulation can restore RCC CD8+ TIL metabolism and function through rescue of T cell glycolysis that supports mitochondrial mass and activity.

Keywords: Glucose metabolism; Immunology; Immunotherapy; Oncology; T cells.


Conflict of interest statement

Conflict of interest: This work was supported in part by Incyte Biosciences (JCR, WKR). JCR has held stock equity in Sitryx, and within the past 2 years has received research support, travel, and honorarium from Sitryx, Caribou, Kadmon, Calithera, Tempest, Merck, and Pfizer. Within the past 2 years, WKR has received clinical research support Bristol-Meyers Squib, Merck, Pfizer, Peloton, Calithera, and Incyte.

Figures

Figure 1
Figure 1. RCC CD8+ TILs differentially express costimulatory, checkpoint inhibitor, and metabolic pathways compared with matched peripheral blood CD8+ cells.
(A) Gene set enrichment analysis was performed, and enrichment scores are shown for pathway enrichment in CD8+ RCC TILs compared with peripheral blood. Red highlights enriched metabolic pathways. Blue highlights T cell effector signaling pathways. Normalized enrichment scores (NES) are shown for pathways with BH-adjusted P < 0.01. n = 5. (B) t-SNE analysis of 3 independent patients with RCC showing matching patient peripheral blood, RCC tumor, and adjacent kidney tissue. Average EMD (n = 3) compared across sample types: blood versus adjacent kidney, and tumor versus adjacent kidney. (C) MEM used to quantitatively determine the phenotype of CD8+ T cells for patients 166, 167, and 198 within a given tissue type as compared with all other samples. (D) MEM applied to assess CD8+PD-1+ cells, determining metabolic phenotype across all samples. CytoC, cytochrome c.
Figure 2
Figure 2. CD28 costimulation increases RCC CD8+ TIL activation and markers for effector function.
Single-cell suspensions were cultured with IL-7 (gray) to maintain homeostasis, CD3 alone (black) for TCR engagement, or CD3 and CD28 costimulation (red) for 5 days before being subjected to flow cytometry. We assessed CD8+ RCC TILs, CD8+ cells from matched peripheral blood, and adjacent kidney CD8+ cells for markers of activation (CD25 and CD71) as well as effector function (granzyme B). n ≥ 13 patient blood and TIL; n ≥ 7 adjacent kidney tissue) *P < 0.05, **P < 0.01, ***P < 0.001, ****P < 0.0001 by 1-way ANOVA with Tukey’s post hoc test.
Figure 3
Figure 3. Single-cell gene expression analysis shows that CD28 costimulation increases CD8+ RCC TIL activity and metabolism.
(A) UMAP analysis of single-cell RNA-Seq analysis of CD8 from peripheral blood and RCC TILs showing each sample treated with IL-7, CD3 alone, and CD3 with CD28 costimulation. (B) PHATE and monocle analysis using gene expression matrix revealed 2 distinct trajectories (green and blue) stemming from resting CD8+ T cells (red). Branches 1 (red), 2 (green), and 3 (blue) represent the 2 trajectories and the root resting state. Percentages of cells assigned to each branch in each sample are shown on the right. (C) Top pathways from hallmark gene sets that distinguish the 2 trajectories by pathway activities (AUC score). Pathway activities (AUCell score) for all cells are shown in the left panel as histogram by AUC score; pathway activity in cells past the threshold (vertical red line) was placed on the PHATE map trajectory (middle panel), with high-activity cells in red and low-activity cells in gray; bar graphs show the percentages of cells in each treatment that have high activity in each pathway.
Figure 4
Figure 4. CD28 costimulation increases CD8+ TIL activity and metabolism.
(A) UMAP of CD8+ T cells from healthy donor PBMCs and RCC TILs using mass cytometry analysis after 5 days of treatment with IL-7, CD3 alone, or CD3 with CD28 costimulation. (B) MEM used to quantitatively determine the phenotype of CD8+ T cells from healthy donor PBMCs and RCC CD8+ TILs following treatment with IL-7, CD3 alone, or CD3 with CD28 costimulation. (C) MEM applied to assess the metabolic phenotype of CD8+ T cells from healthy donor PBMCs and RCC TILs treated with IL-7, CD3 alone, or CD3 with CD28 costimulation.
Figure 5
Figure 5. CD28 costimulation increases glycolysis and glucose transporters.
(A) Glycolytic stress test results showing representative ECAR and OCR (±SEM) normalized to cell count using Cytation 5 (BioTek). CD8+ RCC TIL glycolysis following IL-7 (gray), CD3 alone (black), CD3 with CD28 costimulation (red). n = 5. *P < 0.05, ***P < 0.001 by 1-way ANOVA with Tukey’s post hoc test. (B) Flow cytometry analysis showing MFI of GLUT1 and GLUT3 normalized to IL-7 and comparing CD3 with CD28 costimulation (red). n ≥ 9. **P < 0.01 by 1-way ANOVA with Tukey’s post hoc test.
Figure 6
Figure 6. Mitochondrial structure and function are enhanced by CD28 costimulation.
(A) Mitochondrial structure assessed by immunofluorescence using MitoTracker Deep Red for labeling of mitochondria of cells treated with IL-7, CD3 and CD28 costimulation, or CD3 and CD28 costimulation with the inhibitor 2-DG. Images are representative of cells from n = 3 patients. Scale bars: 1 mm. (B) Assessment of mitochondrial function by flow cytometry measuring electron membrane potential using TMRE and mitochondrial mass using MitoTracker Green (MTG) in RCC TILs treated with costimulation, or costimulation with 2-DG, with lines connecting individual patient samples for each condition. n ≥ 10. *P < 0.05, **P < 0.01 by 1-way ANOVA with Tukey’s post hoc test.
Figure 7
Figure 7. CD28 costimulation increased CD8+ RCC TIL activation requires glycolysis.
(A) Flow cytometry analysis of surface markers of activations (CD25, CD71) and effector function (IL-2, granzyme B, IFN-γ, and TNF-α) following 5 days of RCC TIL coculture, normalized to IL-7 and compared with CD3 with CD28 costimulation or treated with costimulation and 2-DG. n ≥ 13. *P < 0.05, **P < 0.01, ***P < 0.001, ****P < 0.0001 by 1-way ANOVA with Tukey’s post hoc test. (B) Replication of CD8+ RCC TILs assessed following staining with CellTrace Violet and analyzed on day 5 following treatment with either CD3/CD28 costimulation or CD3/CD28 costimulation and 2-DG. n = 5. *P < 0.05, **P < 0.01, ***P < 0.001, ****P < 0.0001 by 1-way ANOVA with Tukey’s post hoc test.

References

    1. Swamy M, et al. Glucose and glutamine fuel protein O-GlcNAcylation to control T cell self-renewal and malignancy. Nat Immunol. 2016;17(6):712–720. doi: 10.1038/ni.3439. - DOI - PMC - PubMed
    1. Jacobs SR, et al. Glucose uptake is limiting in T cell activation and requires CD28-mediated Akt-dependent and independent pathways. J Immunol. 2008;180(7):4476–4486. doi: 10.4049/jimmunol.180.7.4476. - DOI - PMC - PubMed
    1. Siska PJ, Rathmell JC. T cell metabolic fitness in antitumor immunity. Trends Immunol. 2015;36(4):257–264. doi: 10.1016/j.it.2015.02.007. - DOI - PMC - PubMed
    1. Michalek RD, et al. Cutting edge: distinct glycolytic and lipid oxidative metabolic programs are essential for effector and regulatory CD4+ T cell subsets. J Immunol. 2011;186(6):3299–3303. doi: 10.4049/jimmunol.1003613. - DOI - PMC - PubMed
    1. Frauwirth KA, et al. The CD28 signaling pathway regulates glucose metabolism. Immunity. 2002;16(6):769–777. doi: 10.1016/S1074-7613(02)00323-0. - DOI - PubMed

Publication types

MeSH terms