. 2020 Aug 19;11(8):658.
doi: 10.1038/s41419-020-02884-1.

NLRP7 plays a functional role in regulating BMP4 signaling during differentiation of patient-derived trophoblasts

Affiliations

NLRP7 plays a functional role in regulating BMP4 signaling during differentiation of patient-derived trophoblasts

Aybuke Alici-Garipcan et al. Cell Death Dis. .

Abstract

Complete hydatidiform mole (HM) is a gestational trophoblastic disease resulting in hyperproliferation of trophoblast cells and absence of embryo development. Mutations in the maternal-effect gene NLRP7 are the major cause of familial recurrent complete HM. Here, we established an in vitro model of HM using patient-specific induced pluripotent stem cells (iPSCs) derived trophoblasts harboring NLRP7 mutations. Using whole transcriptome profiling during trophoblast differentiation, we showed that impaired NLRP7 expression results in precocious downregulation of pluripotency factors, activation of trophoblast lineage markers, and promotes maturation of differentiated extraembryonic cell types such as syncytiotrophoblasts. Interestingly, we found that these phenotypes are dependent on BMP4 signaling and BMP pathway inhibition corrected the excessive trophoblast differentiation of patient-derived iPSCs. Our human iPSC model of a genetic placental disease recapitulates aspects of trophoblast biology, highlights the broad utility of iPSC-derived trophoblasts for modeling human placental diseases and identifies NLRP7 as an essential modulator of key developmental cell fate regulators.


Conflict of interest statement

The authors declare that they have no conflict of interest.

Figures

Fig. 1
Fig. 1. Characterization of HM specific iPSCs carrying NLRP7 mutations.
a Schematic and coordinates of the deletion and the single base pair duplication on NLRP7 gene in HM cells used in this study. b Colony morphologies of reprogrammed cells on MEFs under light microscopy. Images were acquired at 4X magnification. c Immunostaining for pluripotency markers OCT3/4 and NANOG. DAPI was used as a nuclear stain. d RT-PCR showing the expression of pluripotency markers in WT and HM iPSCs and their fibroblast counterparts. e NLRP7 mRNA levels in WT and HM iPSCs and their fibroblast counterparts. Relative mRNA levels were normalized to GAPDH. n = 3 biological replicates. The bars represent mean ± SD. ***P < 0.005 by two-way ANOVA followed by Sidak’s multiple comparison test. f NLRP7 protein levels in WT and HM iPSCs as detected by immunoblotting. β-actin was used as a loading control.
Fig. 2
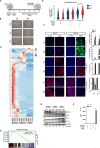
Fig. 2. Impaired NLRP7 expression promotes trophoblast differentiation.
a Diagram of the trophoblast differentiation protocol. b Changes in colony morphologies upon BAP exposure. Images were acquired at 4X magnification. c Heatmap showing the expression of trophoblast markers across the time course of differentiation of WT and HM iPSCs (n = 2 biological replicates). Color represents row-wise scaled expression using Z-score based on the raw gene expression. d Gene set enrichment analysis (GSEA) of Placenta module. Genes were ranked according to log2 fold changes in gene expressions comparing HMBAP cells to WTBAP cells on day 4. e Violin plot displaying log-transformed expression of trophoblast genes in 2c (n = 2, p < 0.05, Wilcoxon rank-sum test). f, g Immunostaining and immunobloting for trophoblast markers CDX2, HLA-G, KRT7, and stem cell marker, OCT3/4. f Percentage of the cells immunostained for CDX2, HLA-G, KRT7, and OCT3/4. Scale bars; 10 μM. g Representative immunoblots for CDX2, HLA-G, KRT7, and OCT3/4. h 24-h PGF production as assessed by ELISA. f, h ± SD, n = 3, *p ≤ 0.05, ***p < 0.005, ****p < 0.001 by two-way ANOVA followed by Sidak’s multiple comparison test.
Fig. 3
Fig. 3. Reduced NLRP7 expression obviates the requirement for exogenous BMP4 during trophoblast differentiation.
Cells were treated with either FGF2 as a control or AP a Heatmap depicting the expression of trophoblast markers during time course of WT and HM iPSC differentiation. Color represents row-wise scaled expression using Z-score based on the raw gene expression. (n = 2 biological replicates). b GSEA of Placenta module. Genes were ranked according to log2 fold changes in expression comparing HMAP cells to WTAP cells on day 4. c Violin plot displaying log-transformed expression levels of trophoblast genes in Fig. 3a (n = 2, p value < 0.05, Wilcoxon rank-sum test). d RT-qPCR for trophoblast and stem cell markers. e, f Immunostaining and immunoblotting for CDX2, HLA-G, KRT7, and OCT3/4. e Percentage of the cells immunostained for CDX2, HLA-G, KRT7, and OCT3/4. Scale bars; 10 μM. f Representative immunoblots for CDX2, HLA-G, KRT7, and OCT3/4. g 24-h PGF production as assessed by ELISA. d, e, g *p ≤ 0.05, ***p < 0.005, ****p < 0.001 by two-way ANOVA followed by Sidak’s multiple comparison test. The bars represent mean ± SD, n = 3 biological replicates.
Fig. 4
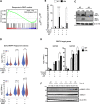
Fig. 4. NLRP7 modulates BMP signaling under AP conditions.
a GSEA showing the enrichment of response to BMP gene set in HMAP cells in comparison to HMiPSC. Genes were ranked according to log2 fold changes in gene expressions comparing HMAP cells to HMiPSC cells on day 2. b RT-qPCR showing the expression of BMP4. n = 3 biological replicates. c Western blotting of BMP4. SN Supernatant, WCL whole cell lysate. d Violin plots for early BMP4 responsive genes in WT and HM cells across the time course of differentiation (p < 0.05, Wilcoxon rank-sum test). e Log-transformed expression of BMP4 target genes, GATA2 and GATA3. a, d, e n = 2 biological replicates. The bars represent mean ± SD. b, e *p ≤ 0.05, **p < 0.01, ***p < 0.005, ****p < 0.001 by two-way ANOVA followed by Sidak’s multiple comparison test. f Western blotting of pSMAD1/5/9 and total SMAD1.
Fig. 5
Fig. 5. Rescue of elevated trophoblast differentiation in HMiPSC by inhibition of BMP signaling.
Cells were exposed to vehicle (DMSO) or BMP signaling inhibitor LDN193189 (100 nM) under AP conditions. a Changes in colony morphologies upon LDN193189exposure. Images were acquired at 4X magnification. b Heatmap showing the expression of trophoblast markers across the time course of differentiation of HM and WT iPSCs. Color represents row-wise scaled expression using Z-score based on the raw gene expression. c, d Violin plots for pluripotency (c) and trophoblast (d) markers. (n = 2, ****p < 0.001, Wilcoxon rank-sum test). e RT-qPCR for trophoblast and stem cell markers. *p ≤ 0.05 **p < 0.01 ***p < 0.005 ****p < 0.001 by two-way ANOVA followed by Sidak’s multiple comparison test. f Representative immunoblots for CDX2, HLA-G, KRT7, and OCT3/4.

References

    1. Li R, Albertini DF. The road to maturation: somatic cell interaction and self-organization of the mammalian oocyte. Nat. Rev. Mol. Cell Biol. 2013;14:141–152. - PubMed
    1. Nüsslein-Volhard C, Wieschaus E. Mutations affecting segment number and polarity in Drosophila. Nature. 1980;287:795–801. - PubMed
    1. Lu X, Gao Z, Qin D, Li L. A maternal functional module in the mammalian oocyte-to-embryo transition. Trends Mol. Med. 2017;23:1014–1023. - PubMed
    1. Nguyen NMP, Slim R. Genetics and epigenetics of recurrent hydatidiform moles: basic science and genetic counselling. Curr. Obstet. Gynecol. Rep. 2014;3:55–64. - PMC - PubMed
    1. Hui P, Buza N, Murphy KM, Ronnett BM. Hydatidiform moles: genetic basis and precision diagnosis. Annu. Rev. Pathol. Mech. Dis. 2017;12:449–485. - PubMed

Publication types

MeSH terms

Substances