. 2020 Aug 19;11(1):4153.
doi: 10.1038/s41467-020-18013-7.

Histone methyltransferase DOT1L coordinates AR and MYC stability in prostate cancer

Affiliations

Histone methyltransferase DOT1L coordinates AR and MYC stability in prostate cancer

R Vatapalli et al. Nat Commun. .

Abstract

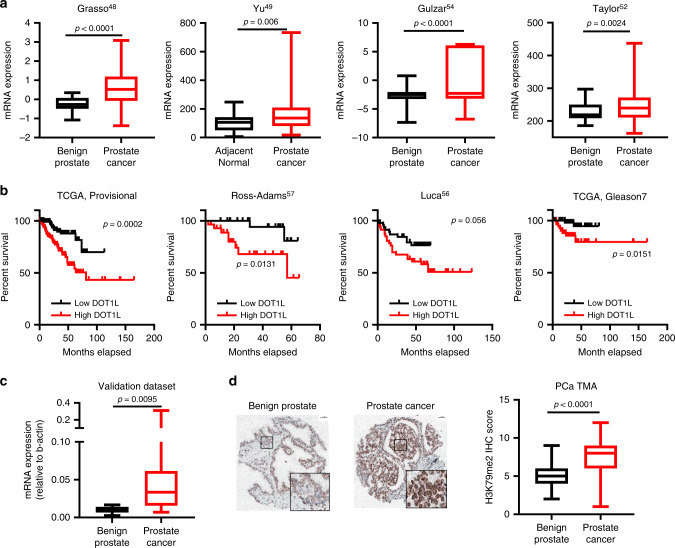
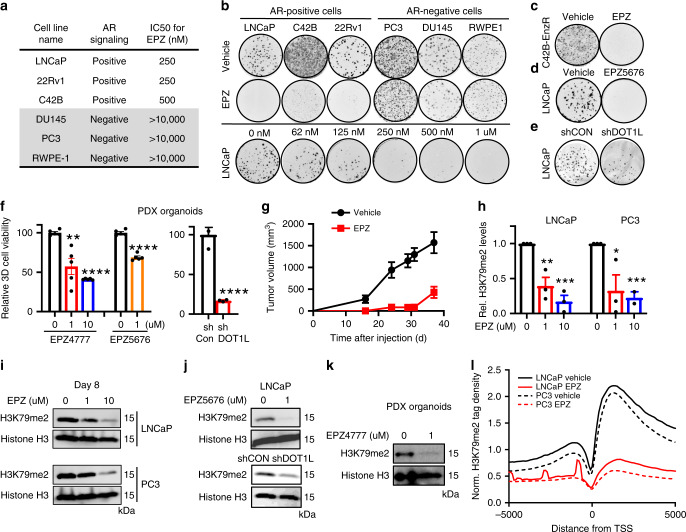
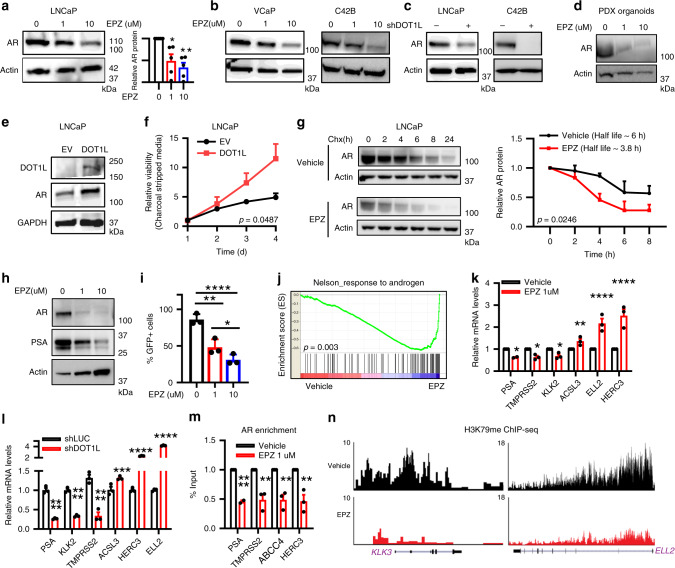
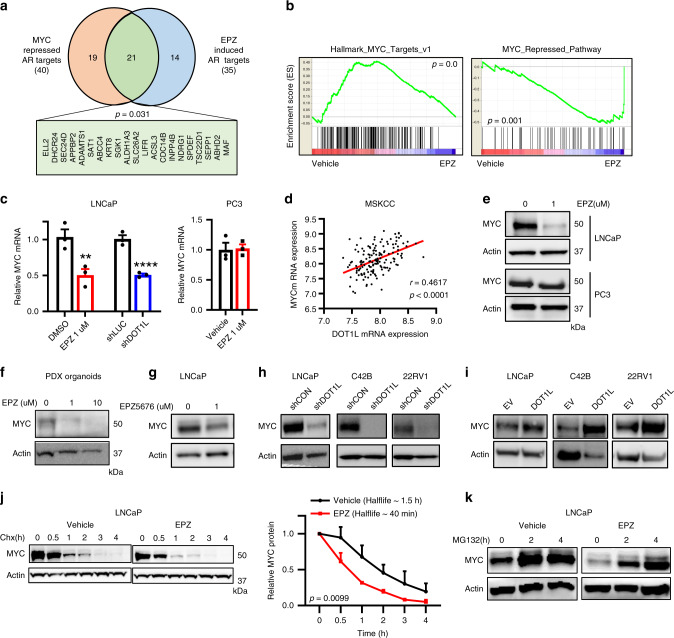
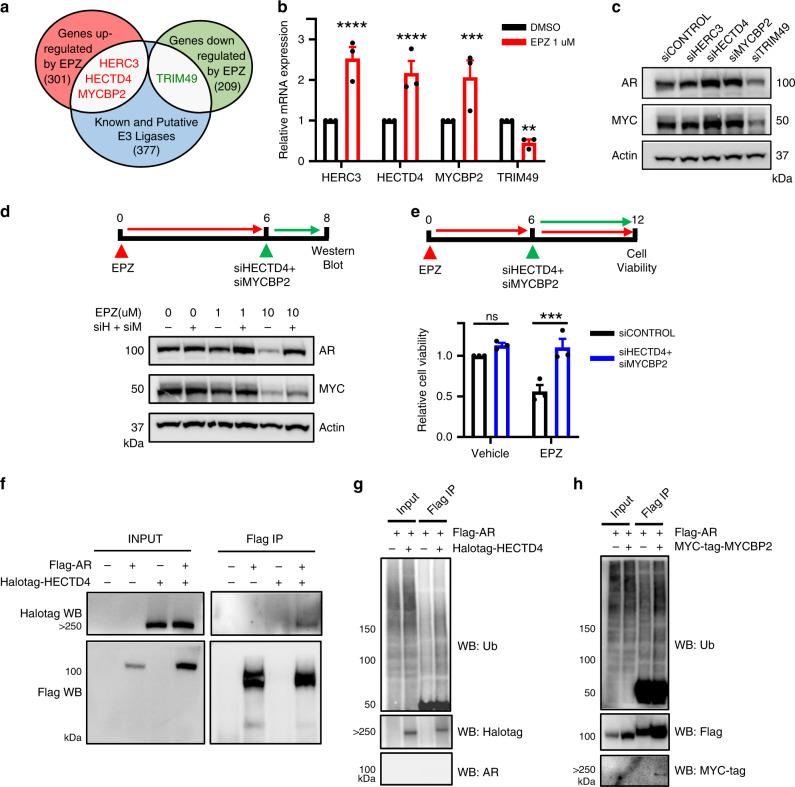
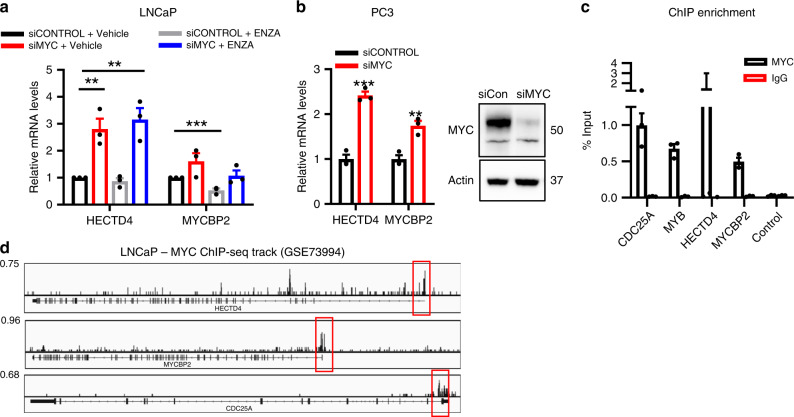
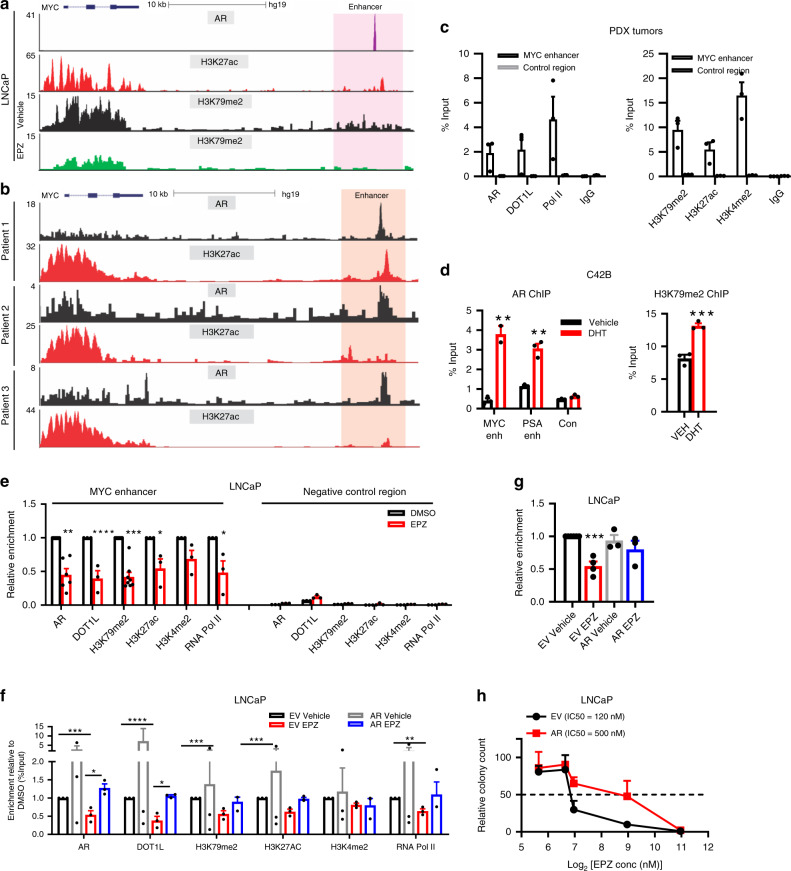
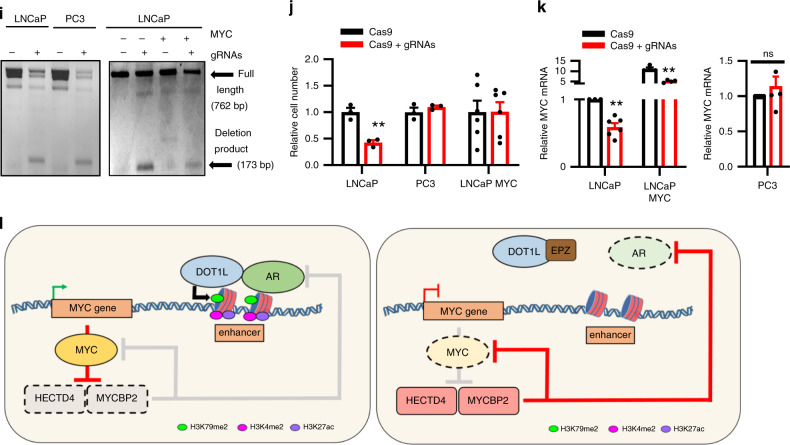
The histone methyltransferase DOT1L methylates lysine 79 (K79) on histone H3 and is involved in Mixed Lineage Leukemia (MLL) fusion leukemogenesis; however, its role in prostate cancer (PCa) is undefined. Here we show that DOT1L is overexpressed in PCa and is associated with poor outcome. Genetic and chemical inhibition of DOT1L selectively impaired the viability of androgen receptor (AR)-positive PCa cells and organoids, including castration-resistant and enzalutamide-resistant cells. The sensitivity of AR-positive cells is due to a distal K79 methylation-marked enhancer in the MYC gene bound by AR and DOT1L not present in AR-negative cells. DOT1L inhibition leads to reduced MYC expression and upregulation of MYC-regulated E3 ubiquitin ligases HECTD4 and MYCBP2, which promote AR and MYC degradation. This leads to further repression of MYC in a negative feed forward manner. Thus DOT1L selectively regulates the tumorigenicity of AR-positive prostate cancer cells and is a promising therapeutic target for PCa.


Conflict of interest statement

The authors declare no competing interests.

Figures

Fig. 1
Fig. 1. DOT1L expression is upregulated in prostate cancers and high expression correlates with poor disease-free survival.
a Comparison of DOT1L expression in four cohorts of prostate cancer patients’ datasets. Data for this analysis were used from the Grasso PCa dataset [benign (n = 28), PCa (n = 94)], Yu PCa dataset [normal (n = 60), PCa (n = 81)], Gulzar Prostate cancer dataset [normal (n = 66), prostate cancers (n = 83) and Taylor PCa dataset [normal (n = 29), PCa (n = 150)]. b Disease-free Survival analysis of three independent cohorts of prostate cancer patients divided by expression of DOT1L using 25 percentile and 75 percentile cutoffs. Data was used from the Luca CancerMap prostate cancer dataset [n = 46 per group], TCGA prostate cancer dataset [n = 122 per group], Ross-Adams Discovery dataset [n = 27 per group] and TCGA Gleason 7 patients [n = 61 per group]. c Comparison of DOT1L expression in an independent dataset with PCa patient specimens [benign (n = 15), PCa (n = 45)]. d Representative images (left) and comparison of average H3K79me2 staining scores in tissue sections from a PCa TMA [normal (n = 80), PCa (n = 80)] Scale bar indicates 50 μM. Statistical tests: p value determined by two-sided Welsh’s t test (a, c, d) and Log-rank test. For box plots, minima and maxima values are shown (a, c, d).
Fig. 2
Fig. 2. DOT1L inhibition leads to selective loss in cell viability in AR-positive cells.
a Comparison of Half maximum inhibitory concentration (IC50) for EPZ in 6 prostate cancer cell lines. b (Top) Representative images of clonogenic assays performed for 6 prostate cancer cell lines treated with Vehicle or 10 μM of EPZ for 12 days from 3 independent experiments. (Bottom) Representative images of clonogenic assay in LNCaP cells treated with increasing doses of EPZ for 12 days from 3 independent experiments. Colony formation assays performed in (c) C42B-ENZR cells treated with Vehicle or 10 μM EPZ for 12 days. (d) LNCaP cells treated with Vehicle or 10 μM EPZ5676 for 12 days. e LNCaP cells transduced with shControl or shDOT1L followed by clonogenic assays evaluated after 12 days. f PDX organoids were treated with Vehicle, EPZ (left) or shControl or shDOT1L (middle) and Vehicle or EPZ5676 (right). g LNCaP cells were treated in vitro with Vehicle or 10 μM EPZ and 2 million viable cells were injected subcutaneously in NOD-SCID mice and tumor growth was monitored (n = 5 per arm). h, i H3K79me2 western blot analysis performed after 8 days of treatment with Vehicle or EPZ with quantitation of protein levels. j H3K79me2 western blot analysis in LNCaP after 8 days of treatment with (top) Vehicle or EPZ5676, (bottom) shControl or shDOT1L (Representative experiment shown). k H3K79me2 western blot analysis in PDX organoids after 8 days of treatment with Vehicle or 1 μM EPZ. l Histogram of H3K79me2 tags (within 10 kb) centered on the TSS in LNCaP and PC3 Vehicle and EPZ-treated samples. ChIP-seq performed after cells were treated for 8 days with Vehicle or 1 μM EPZ. Statistical tests: p value determined by two-tailed Student’s t test (fh). n = 5 (f, g) and n = 3 (hj) independent experiments. Error bars represent S.E.M. *p < 0.05; **p < 0.01; ***p < 0.001; ****p < 0.0001.
Fig. 3
Fig. 3. DOT1L inhibition leads to loss in AR protein levels by decreasing its protein stability.
AR protein levels in (a) LNCaP cells treated with EPZ followed by quantitation (n = 5). b AR protein in VCaP and C42B cells after EPZ treatment. c shControl or shDOT1L transfected LNCaP and C42B cells. d PDX organoids treated with EPZ. e AR protein levels in EV or DOT1L overexpressing LNCaP cells. f Proliferation assay of LNCaP cells with and without DOT1L expression in charcoal stripped media measured using MTS assays for 4 days. g AR western analysis after 50 μg/ml Cycloheximide treatment in LNCaP cells treated with Vehicle or EPZ for 8 days (left). Representative experiment shown. Quantitation of AR protein levels from 3 independent experiments (right). h PSA and AR western blot analysis in LNCaP treated with Vehicle and EPZ for 8 days. Representative image shown. i Percentage of RFP + GFP + cells counted by Flow cytometry after 8 days of Vehicle or EPZ treatment in LNCaP cells transfected with ARE-GFP reporter construct. j GSEA plot of Nelson_Response_to_Androgen geneset enriched in LNCaP cells treated with 1 μM EPZ for 8 days compared to Vehicle treatment. mRNA expression of 6 AR target genes measured by qRT-PCR in LNCaP cells after 8 days of (k) 1 μM EPZ treatment and (l) transduction with shDOT1L or shControl lentivirus. m Relative enrichment of AR at 4 target genes measured by ChIP followed by qPCR in LNCaP cells treated with Vehicle or 1 μM EPZ for 8 days. n ChIP-seq plots of H3K79me2 at two AR target genes in LNCaP cells treated with Vehicle or 1 μM EPZ. Statistical tests: p value determined by two-tailed t test (a, fi, km) corrected for multiple comparisons in (km). n = 3 independent experiments (b, c, f, hm). FDR < 25% (j). Error bars represent S.E.M. *p < 0.05; **p < 0.01; ***p < 0.001; ****p < 0.0001.
Fig. 4
Fig. 4. DOT1L inhibition leads to impairment of MYC pathway.
a Comparison of leading-edge genes from Nelson_Response_To_Androgen dataset in the present study (n = 35) and Barfeld study (n = 40). b GSEA plots of two MYC related datasets enriched in either Vehicle treated (left) or EPZ-treated (right) LNCaP cells. Cells were treated with 1 μM Vehicle or EPZ for 8 days prior to microarray analysis (n = 3). c mRNA expression of MYC in (left) LNCaP cells treated with Vehicle or 1 μM EPZ and LNCaP cells transduced with shControl or shDOT1L lentivirus; (right) PC3 cells treated with Vehicle or 1 μM EPZ for 8 days. d Positive correlation between DOT1L and MYC expression in the MSKCC dataset (n = 150). Data were obtained from cbioportal.org. e Western blot analysis of MYC protein in LNCaP and PC3 cells treated with Vehicle or EPZ 1 μM for 8 days. Representative images shown. Western blot analysis of MYC protein in (f) PDX organoids treated with EPZ for 8 days, g LNCaP cells treated with EPZ5676 for 8 days, h LNCaP, C42B, and 22rv1 cells with DOT1L knockdown and i LNCaP, C42B, and 22rv1 cells with DOT1L overexpression. Representative images shown. j Western blot analysis and quantitation of MYC protein after treatment with 50 ug/ml Cycloheximide in LNCaP cells treated with vehicle or 1 μM EPZ for 8 days. k Western blot analysis of MYC protein after treatment with 10 μM MG-132 in LNCaP cells treated with vehicle or 1 μM EPZ for 8 days. Representative images shown. Statistical tests: p value determined by Hypergeometric test (a), Spearman’s rank correlation (d), and two-tailed Student’s t test (c, j). Error bars represent S.E.M. n = 3 independent experiments (c, ek). **p < 0.01; ****p < 0.0001.
Fig. 5
Fig. 5. EPZ-regulated E3 ligases target AR and MYC stability.
a Comparison of genes that are differentially expressed by EPZ (n = 510) and known E3 Ubiquitin ligases. b mRNA expression of HERC3, HECTD4, MYCBP2, and TRIM49 in LNCaP treated with vehicle or 1 μM EPZ for 8 days. c AR and MYC protein levels in LNCaP cells 2 days after being transfected by Control, HERC3, HECTD4, MYCBP2, and TRIM49 targeting siRNA. Representative images shown. d AR and MYC protein levels in LNCaP cells treated with Vehicle or EPZ for 6 days followed by transfection of Control or HECTD4 and MYCBP2 targeting siRNA for 2 days. Representative images shown. e Viability of LNCaP cells treated with Vehicle or EPZ for 6 days followed by transfection of Control or HECTD4 and MYCBP2 targeting siRNA measured by CCK8 assay at day 12. f Co-immunoprecipitation assays performed with Flag-AR pulldown followed by western blot analysis in 293T cells transfected with Flag-AR and Halotag-HECTD4 constructs after 2 days. g Flag-AR pulldown followed by Ubiquitin western analysis in 293T cells transfected with both Flag-AR and HECTD4 constructs. h Co-immunoprecipitation assays performed with Flag-AR pulldown followed by western blot analysis in 293T cells transfected with Flag-AR and MYC-tag-MYCBP2 constructs after 2 days. Statistical tests: p value determined by Student’s t test (b, e). Error bars represent S.E.M. n = 3 independent experiments (be), n = 2 independent experiments (g, h). **p < 0.01; ***p < 0.001; ****p < 0.0001.
Fig. 6
Fig. 6. MYC loss induces expression of HECTD4 and MYCBP2.
a mRNA expression of HECTD4, MYCBP2 in LNCaP cells transfected with Control or MYC targeting siRNA (2 days) followed by treatment with Vehicle or 20 μM ENZA (2 days). b mRNA expression of HECTD4, MYCBP2 and TRIM49 in PC3 cells transfected with Control or MYC targeting siRNA for 2 days. c MYC ChIP followed by qPCR in LNCaP cells at the promoters of the indicated genes. d MYC ChIP-seq plots in LNCaP cells (GSE73994) at the indicated genes. Statistical tests: p value determined by two-tailed t test (a, b). Error bars represent S.E.M. n = 3 independent experiments (ac). **p < 0.01; ***p < 0.001.
Fig. 7
Fig. 7. DOT1L and AR co-regulate MYC expression through a distant enhancer.
a ChIP-seq tracks of AR in LNCaP cells treated with R1881 (GSM353644), H3K27ac in LNCaP cells (GSM686937), H3K79me2 in Vehicle and EPZ-treated LNCaP cells (EPZ 1μM, 8 days), (top—bottom). b ChIP-seq tracks of AR and H3K27ac in 3 patient samples (GSE120738) at the MYC enhancer. c Enrichment of AR, DOT1L, H3K79me2, H3K27ac, H3K4me2 and RNA Pol II at MYC enhancer in PDX tumors. d AR and H3K79me2 enrichment at MYC enhancer in LNCaP cells treated with Vehicle or DHT for 3 h. e Enrichment of AR, DOT1L, H3K79me2, H3K27ac, H3K4me2 and RNA Pol II at the MYC enhancer in LNCaP cells treated with Vehicle or 1 μM EPZ for 8 days. f Enrichment of AR, DOT1L, H3K79me2, H3K27ac, H3K4me2 and RNA Pol II at the MYC enhancer in LNCaP cells transduced with EV or AR and treated with Vehicle or 1 μM EPZ for 8 days. g MYC expression in LNCaP EV or AR cells treated with Vehicle or EPZ for 8 days. h Quantitation of colony formation assays in LNCaP EV or AR cells treated with Vehicle or 1 μM EPZ for 12 days. i Results of genomic DNA PCR following CRISPR-Cas9-mediated deletion of AR-binding region in LNCaP, PC3, and LNCaP-MYC cells leading to a wild type full length band product and a deletion product. Representative image shown from 3 independent experiments. j Cells per FOV plotted for LNCaP, PC3 and LNCaP MYC (n = 5) transfected with gRNAs for CRISPR-Cas9-mediated deletion of the AR-binding site at the MYC enhancer after 5 days relative to Cas9 alone cells. k Relative MYC mRNA expression in LNCaP, PC3 (n = 5), and LNCaP-MYC (n = 5) transfected with or without gRNAs for CRISPR-Cas9 deletion of MYC enhancer after 3 days. l Graphical summary of DOT1L dependent regulation of MYC expression and its association with AR and MYC protein stability. Dashed lines represent decreased abundance. Gray lines represent inactive pathways. Statistical tests: P value determined by two-tailed t test (ch, j, k). Error bars represent S.E.M. n = 3 biological replicates. *p < 0.05; **p < 0.01; ***p < 0.001; ****p < 0.0001.

Comment in

  • DOT1L in prostate cancer.
    Thomas T. Thomas T. Nat Rev Urol. 2020 Oct;17(10):544. doi: 10.1038/s41585-020-0374-0. Nat Rev Urol. 2020. PMID: 32895552 No abstract available.
  • Uro-Science.
    Atala A. Atala A. J Urol. 2021 May;205(5):1517-1519. doi: 10.1097/JU.0000000000001658. Epub 2021 Feb 24. J Urol. 2021. PMID: 33625915 No abstract available.

References

    1. Mohammad HP, Barbash O, Creasy CL. Targeting epigenetic modifications in cancer therapy: erasing the roadmap to cancer. Nat. Med. 2019;25:403–418. - PubMed
    1. Feng Q, et al. Methylation of H3-lysine 79 is mediated by a new family of HMTases without a SET domain. Curr. Biol. 2002;12:1052–1058. - PubMed
    1. Huyen Y, et al. Methylated lysine 79 of histone H3 targets 53BP1 to DNA double-strand breaks. Nature. 2004;432:406–411. - PubMed
    1. Okada Y, et al. hDOT1L links histone methylation to leukemogenesis. Cell. 2005;121:167–178. - PubMed
    1. Bitoun E, Oliver PL, Davies KE. The mixed-lineage leukemia fusion partner AF4 stimulates RNA polymerase II transcriptional elongation and mediates coordinated chromatin remodeling. Hum. Mol. Genet. 2007;16:92–106. - PubMed

Publication types

MeSH terms