. 2020 Sep;585(7824):283-287.
doi: 10.1038/s41586-020-2630-0. Epub 2020 Aug 19.

Age-induced accumulation of methylmalonic acid promotes tumour progression

Affiliations

Age-induced accumulation of methylmalonic acid promotes tumour progression

Ana P Gomes et al. Nature. 2020 Sep.

Abstract

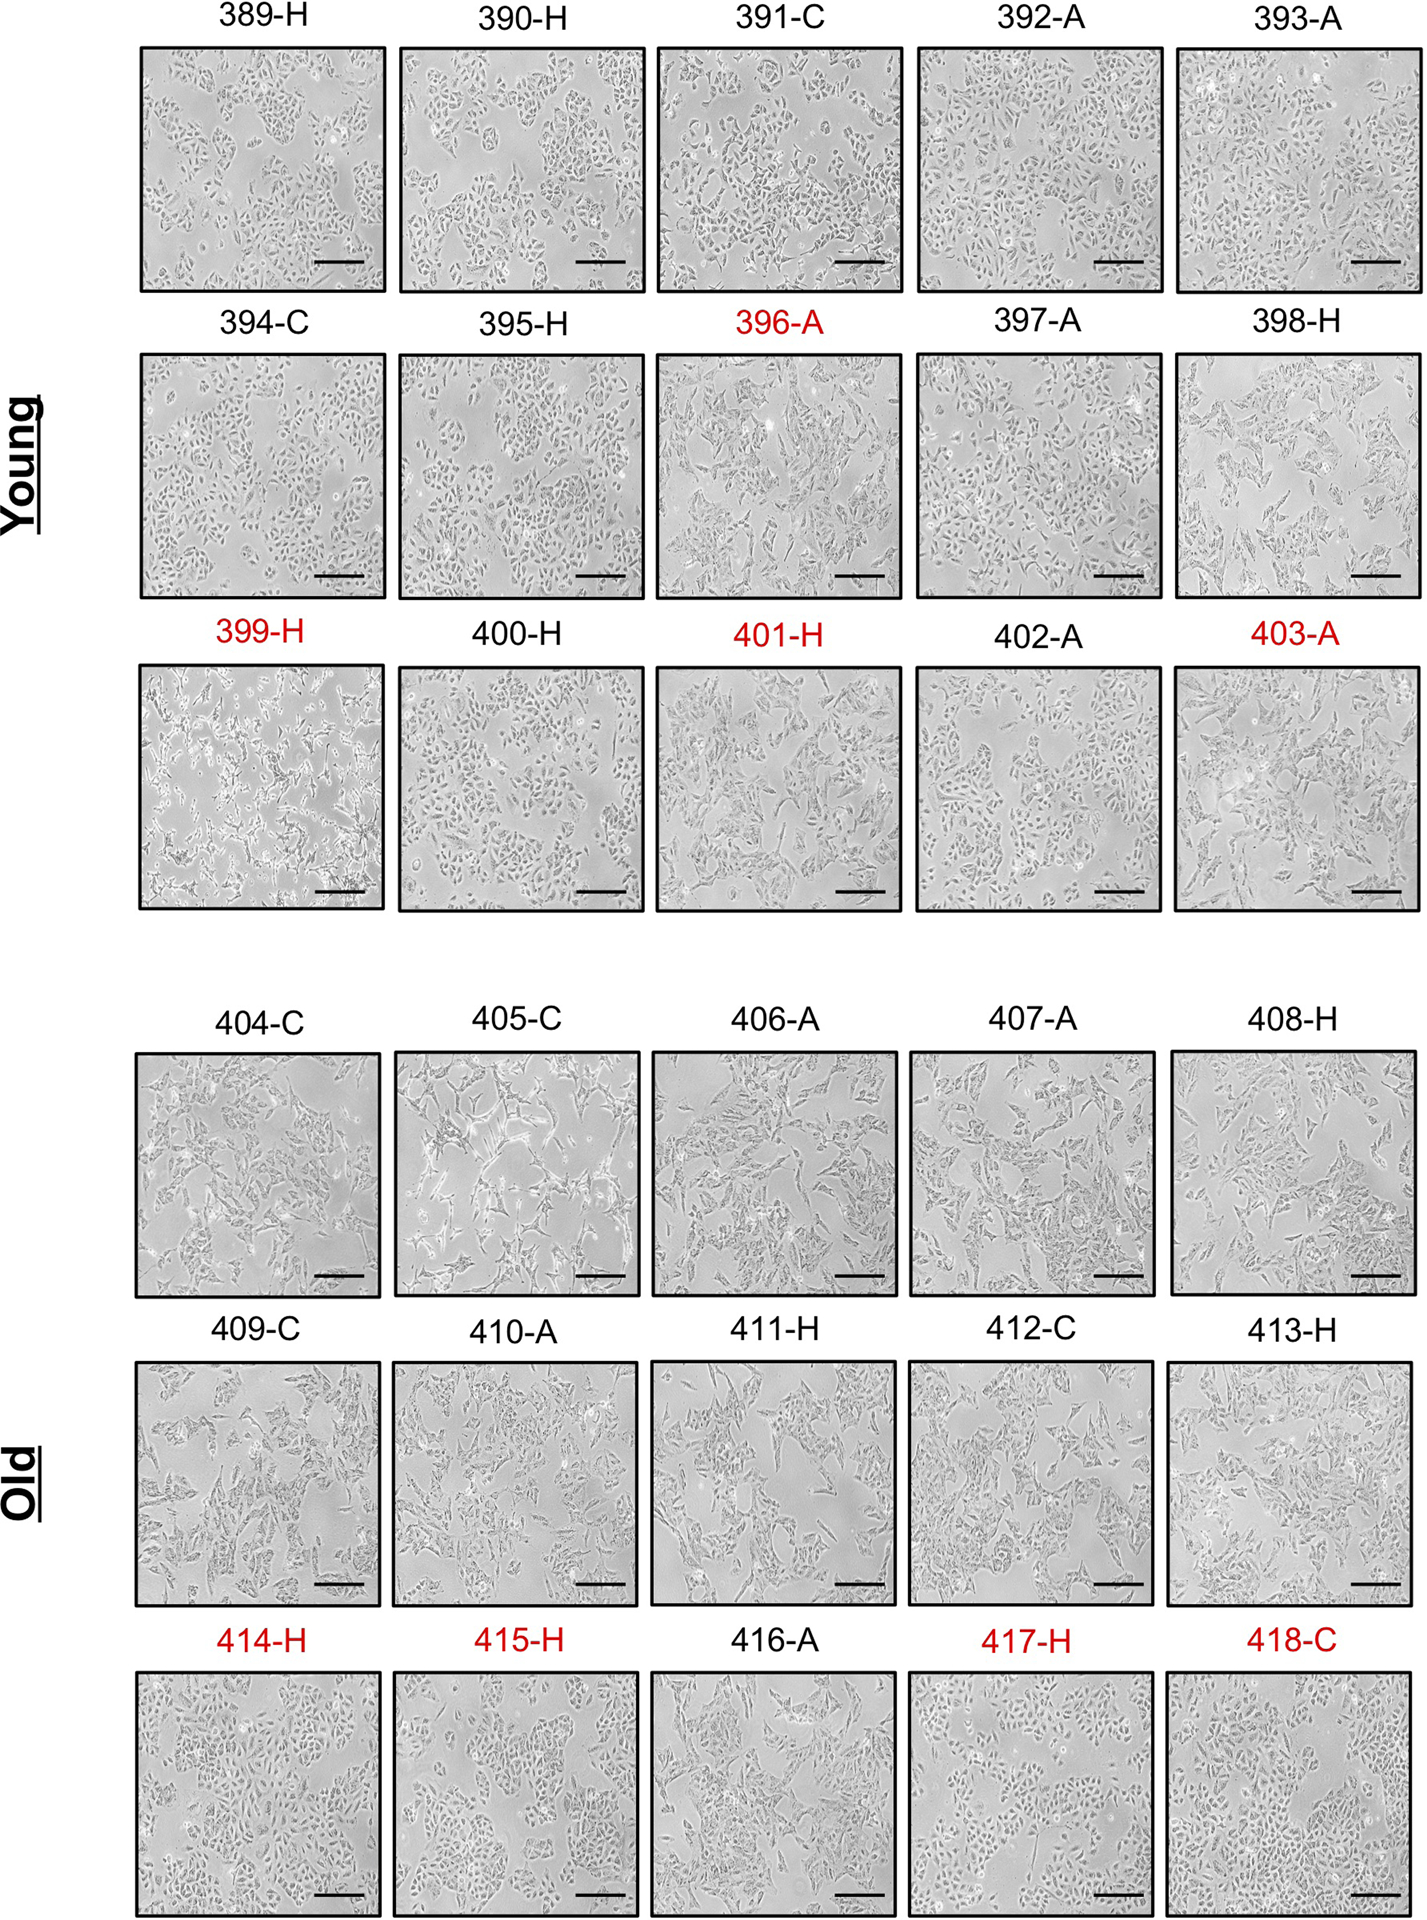
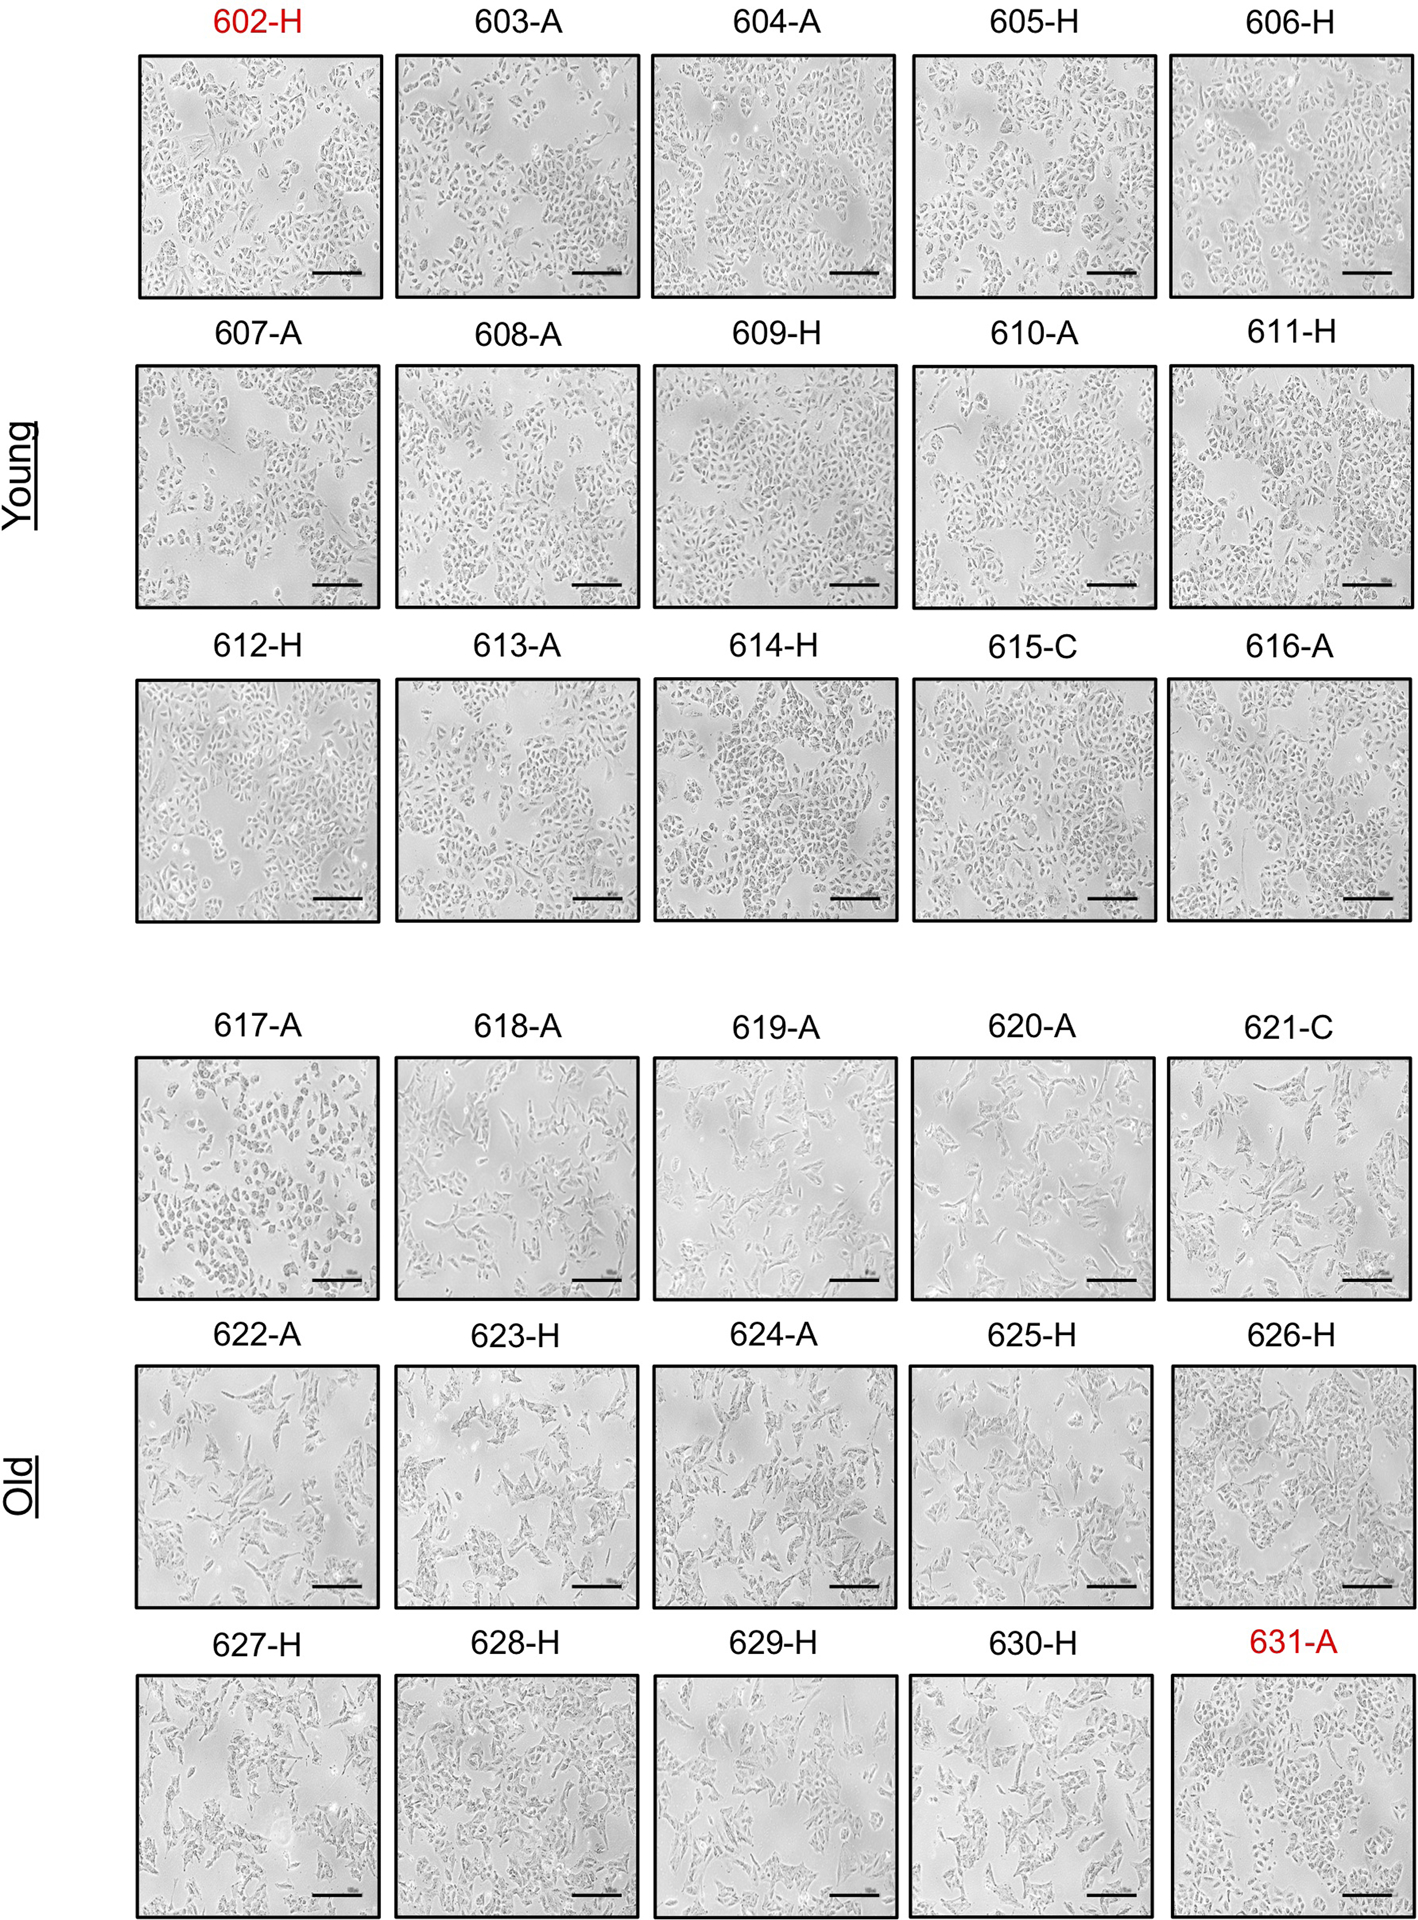
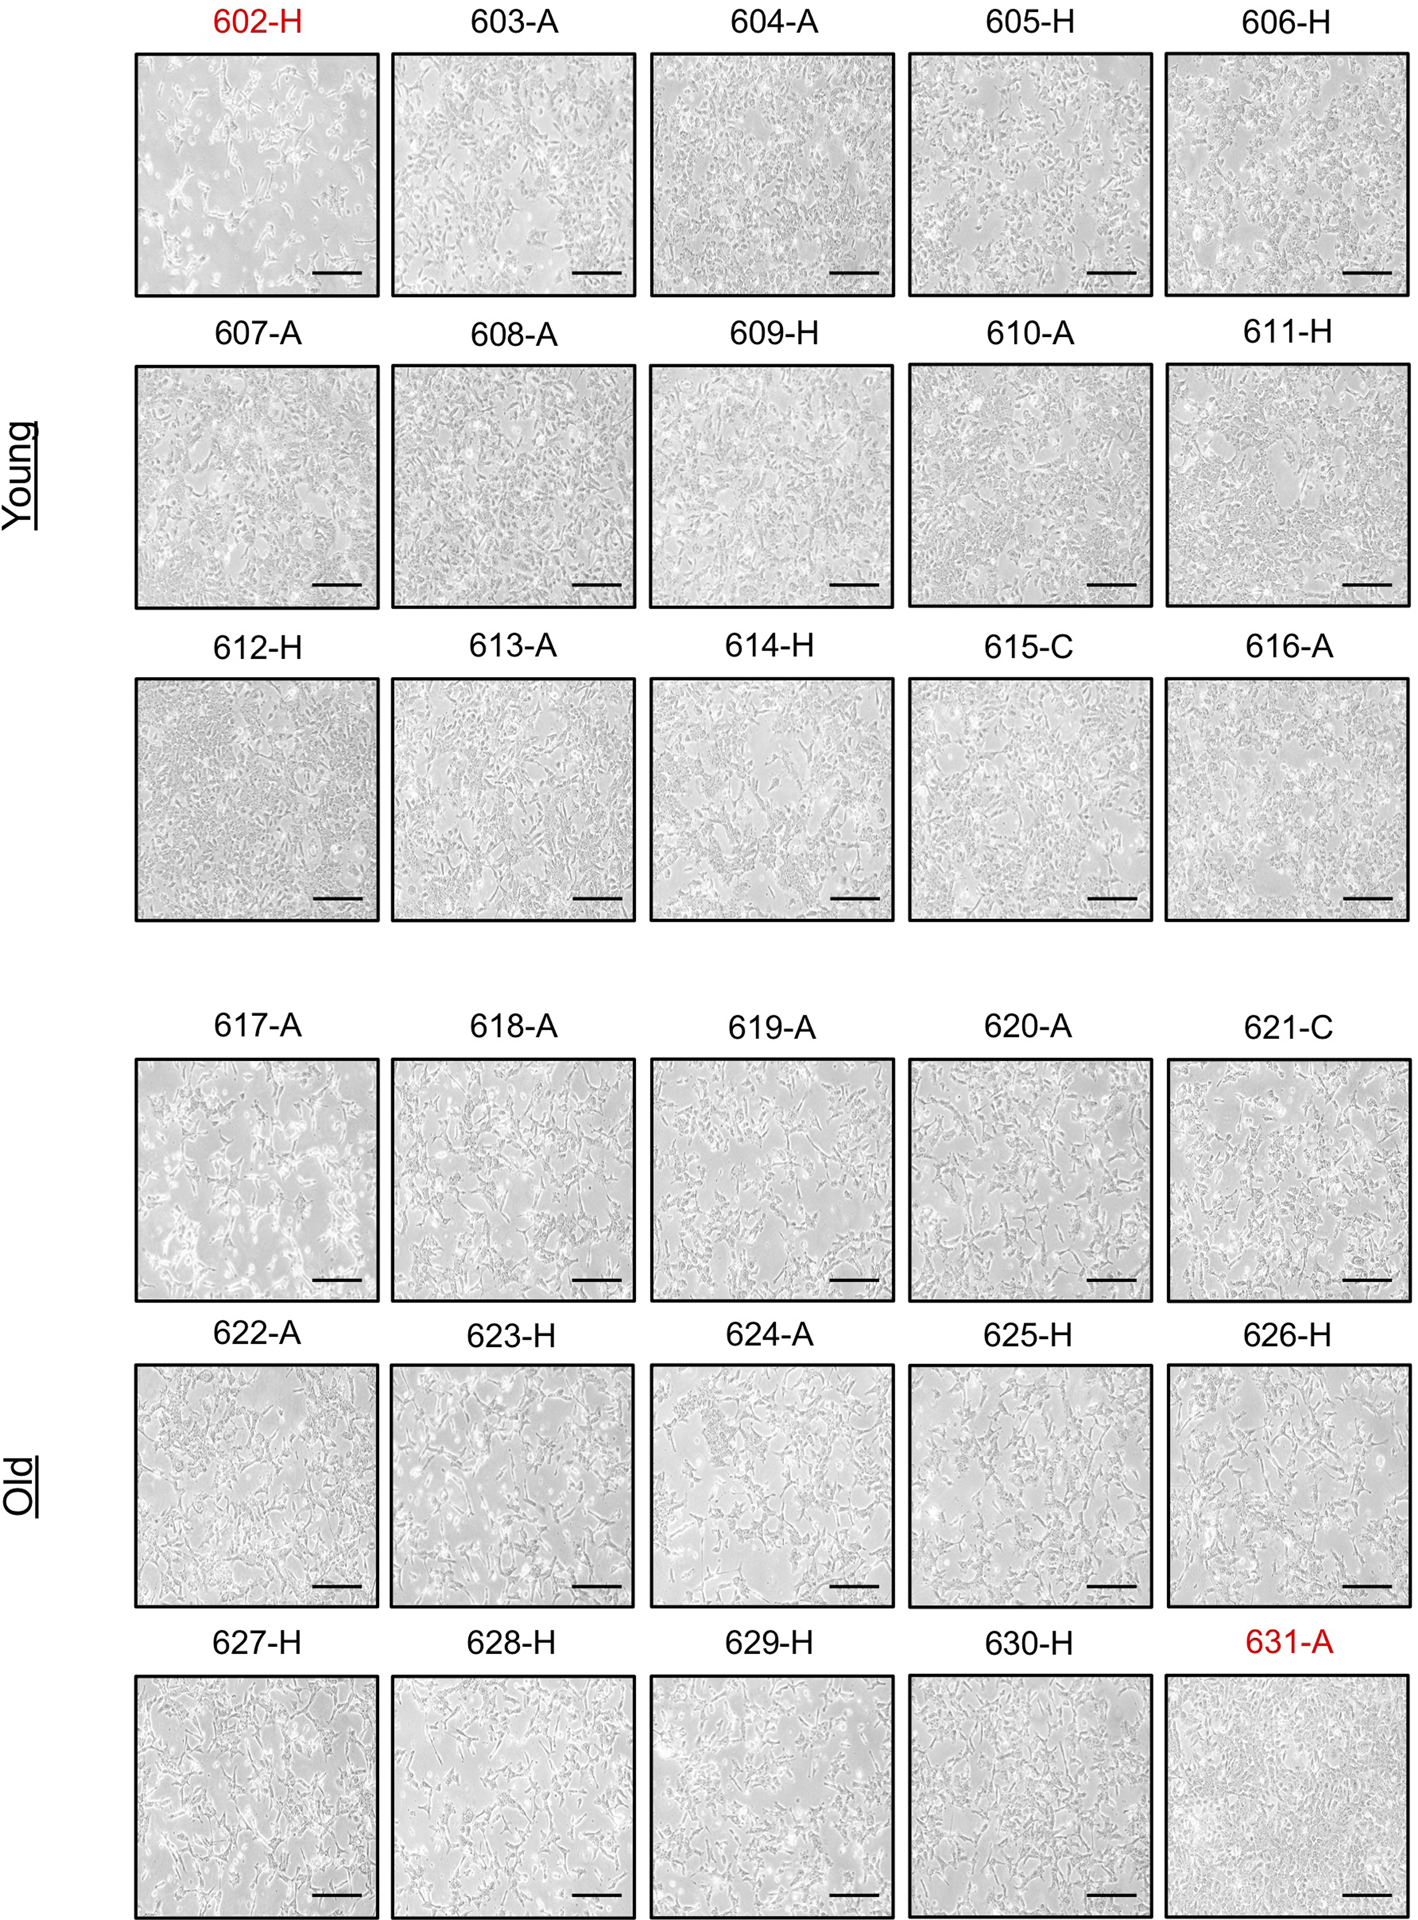
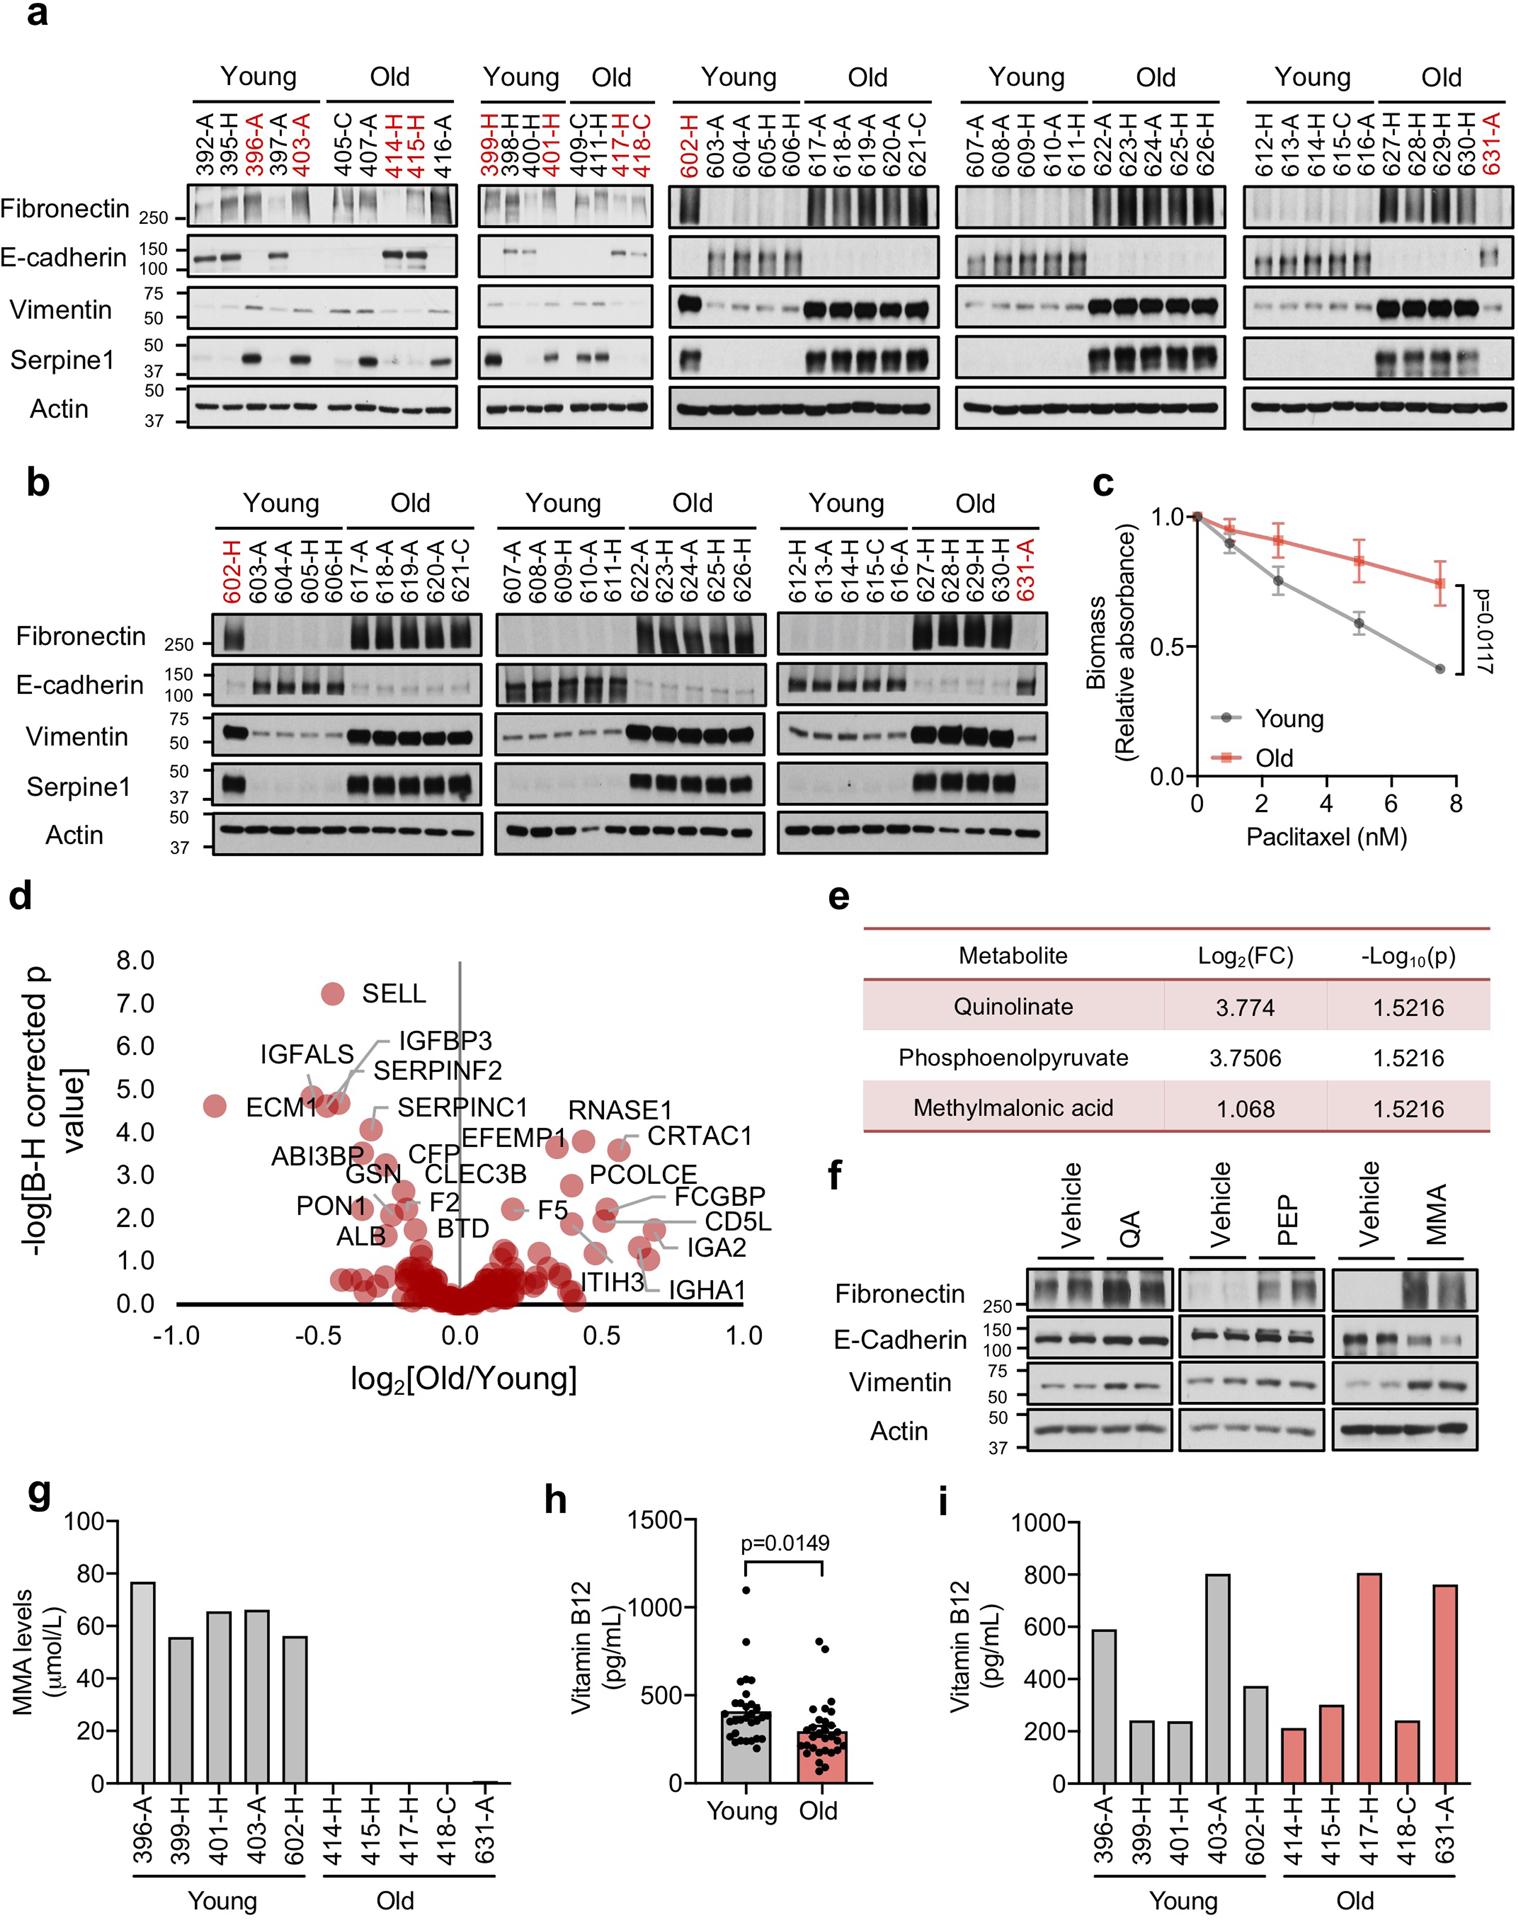
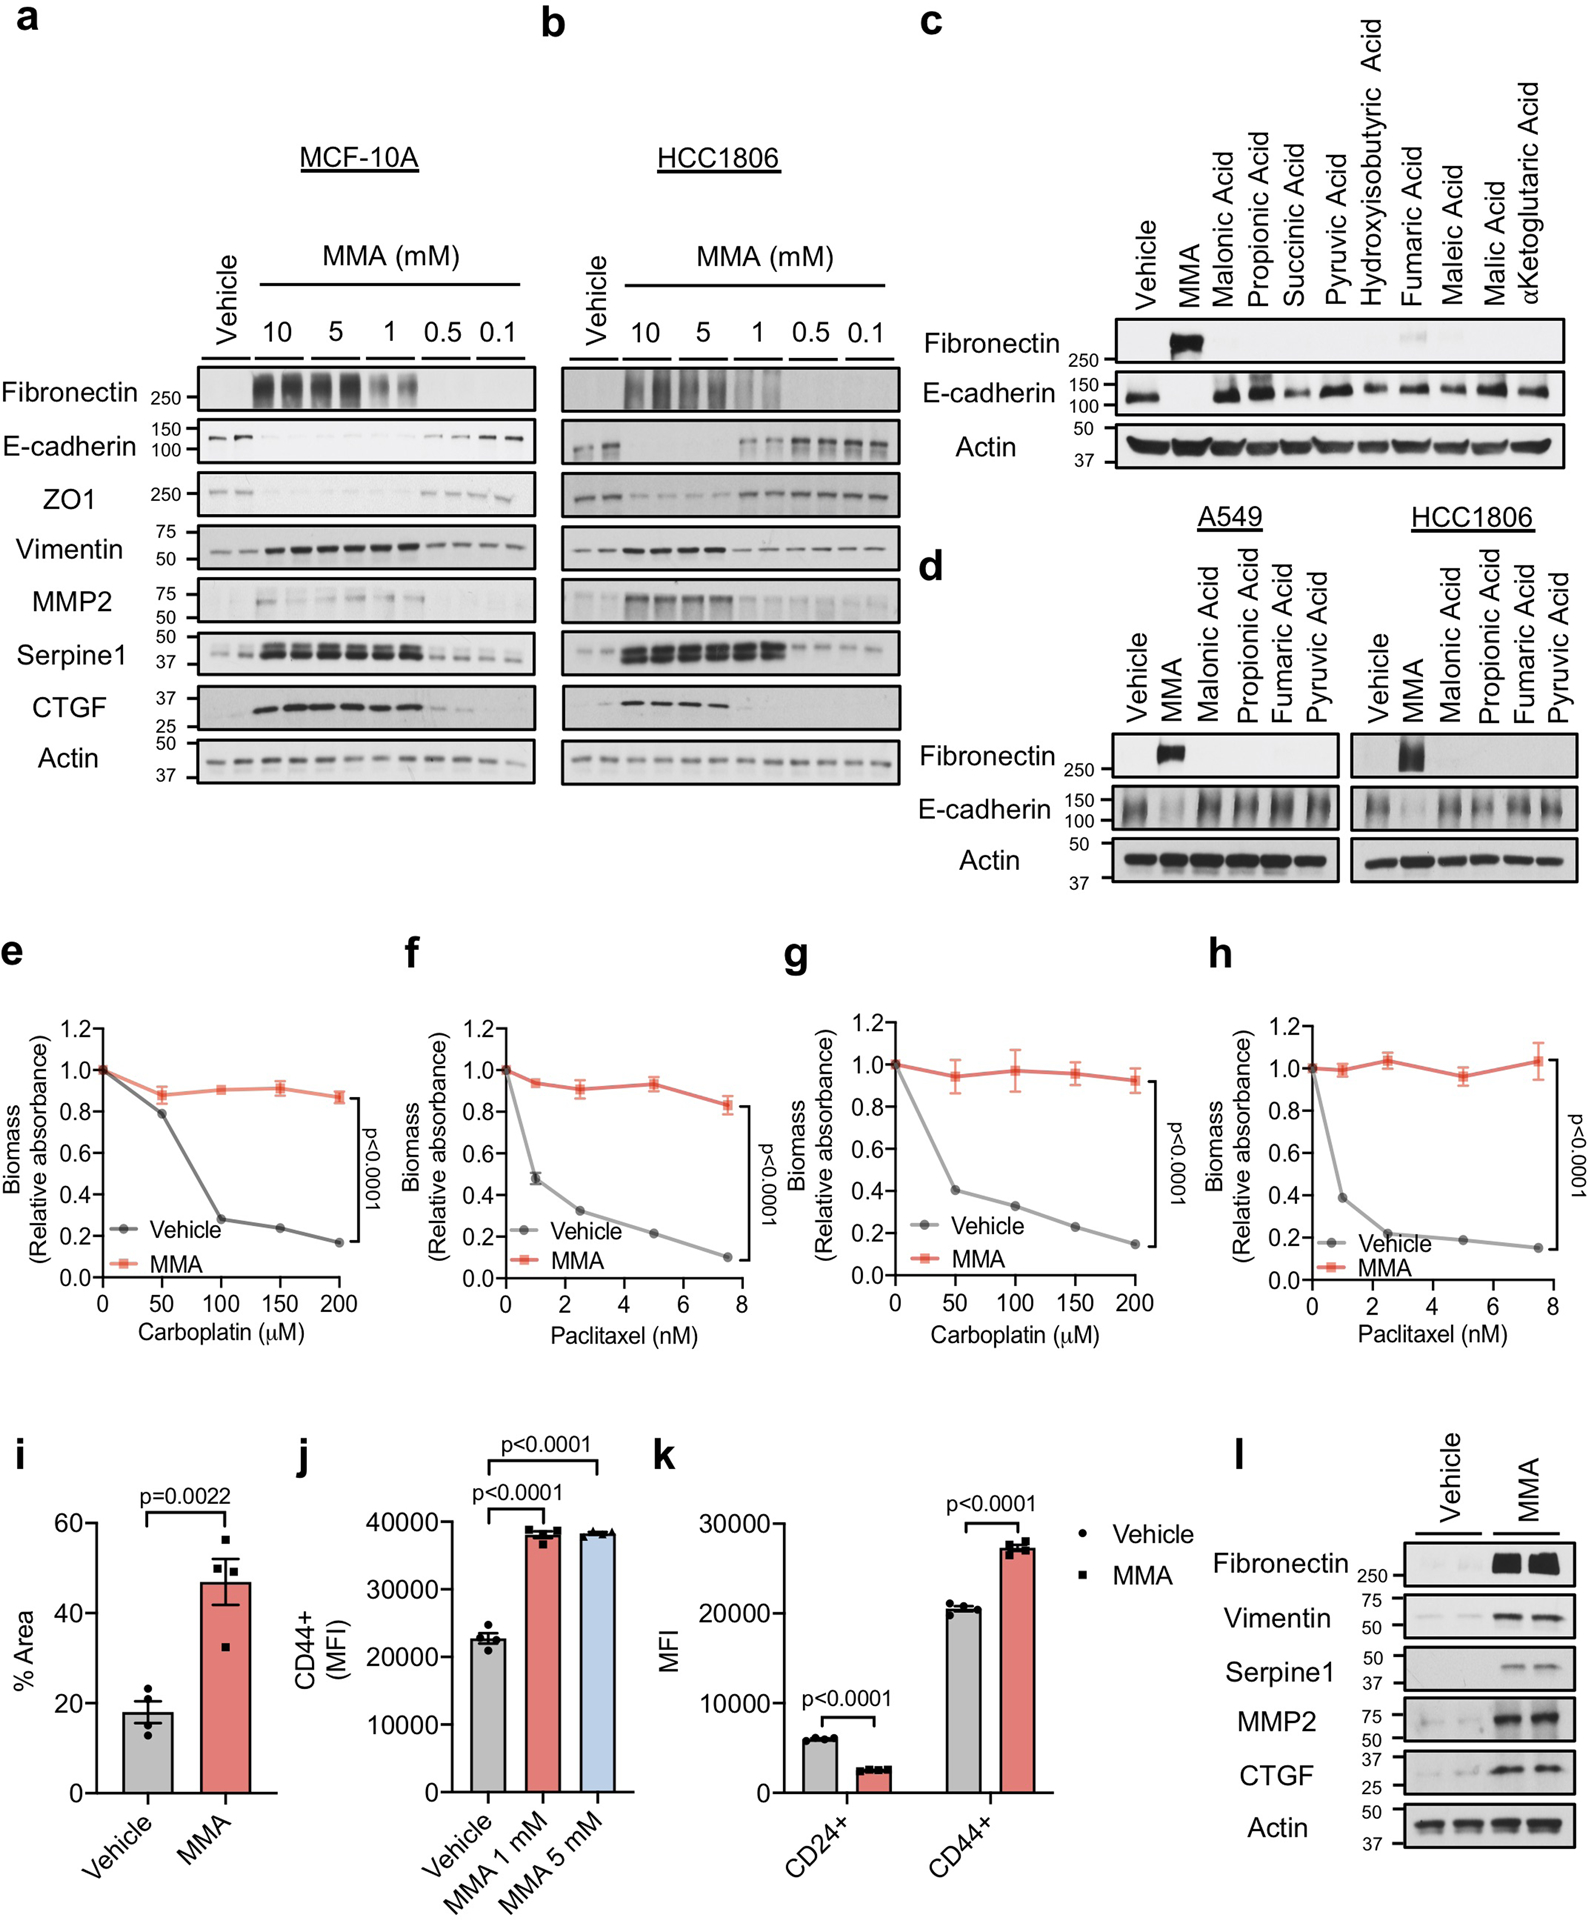
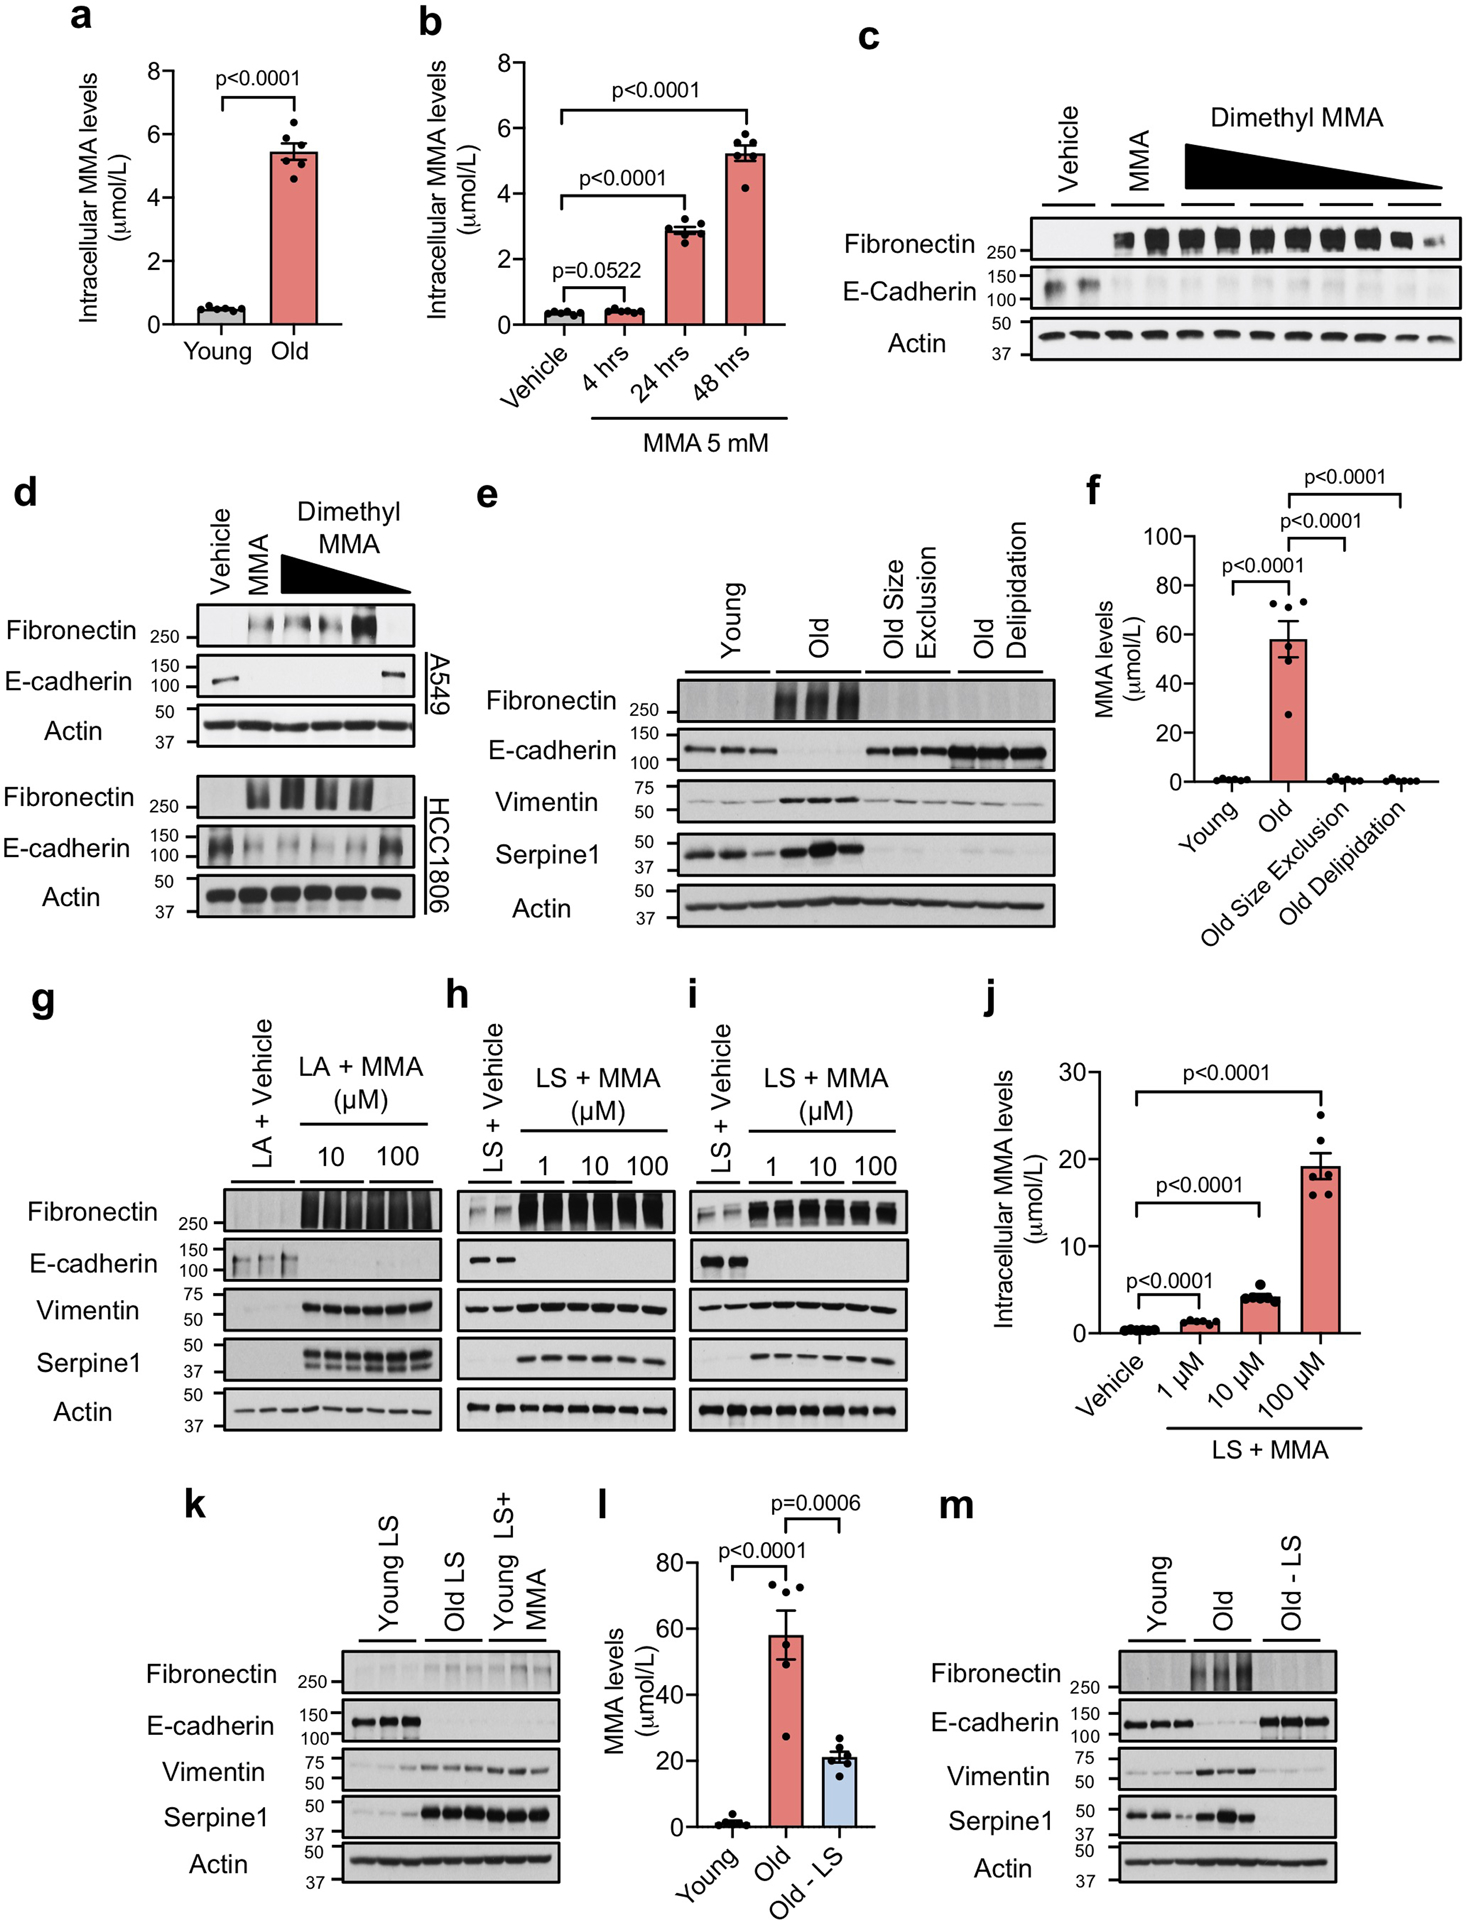
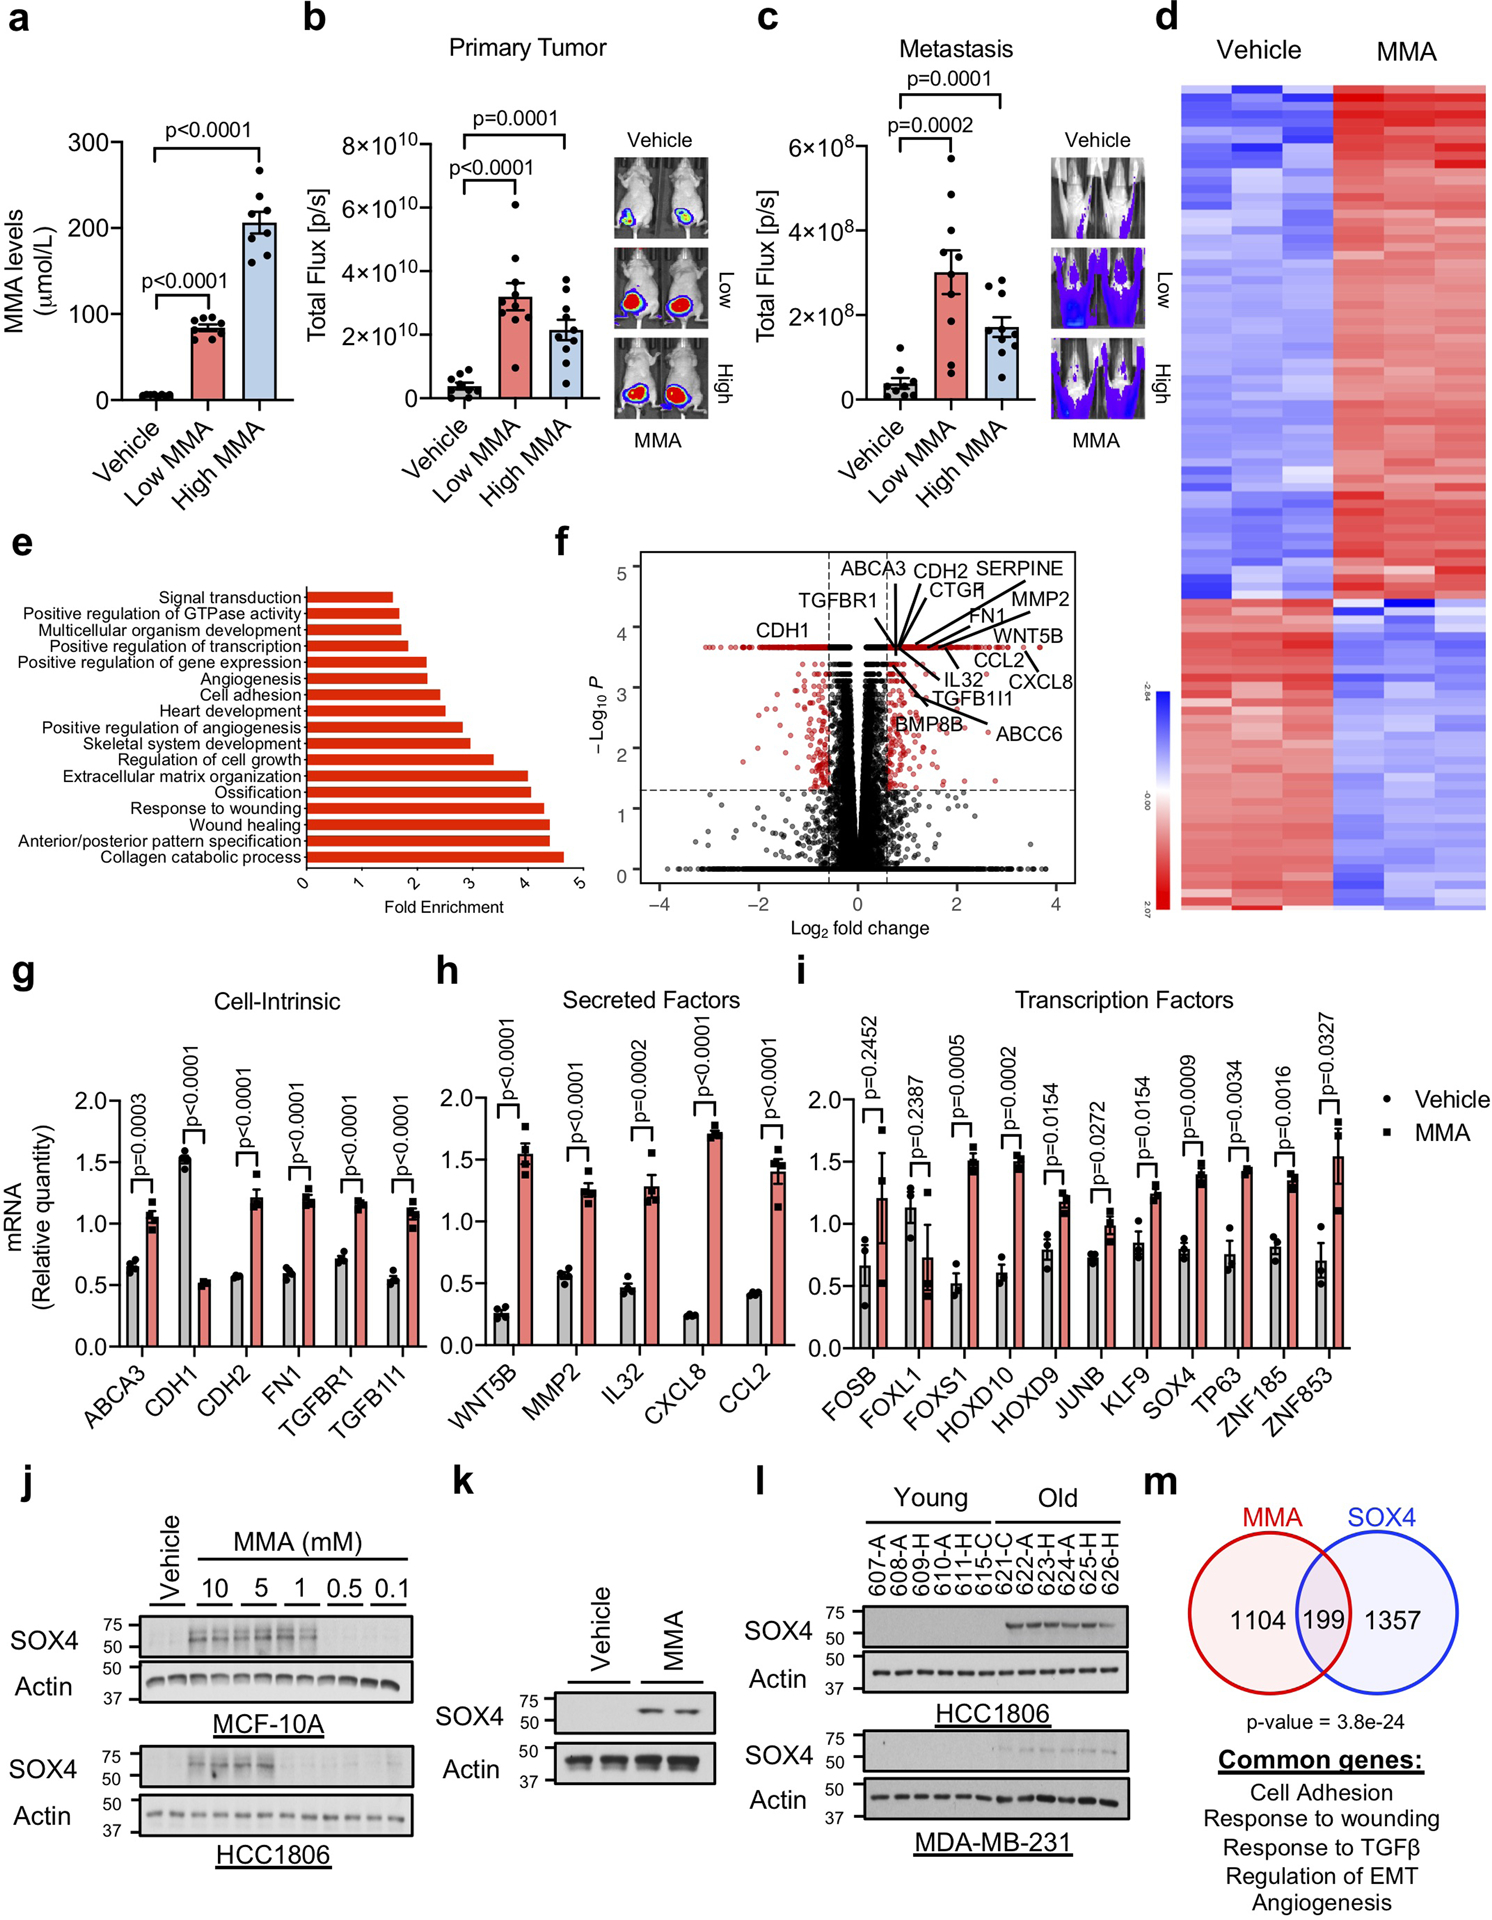
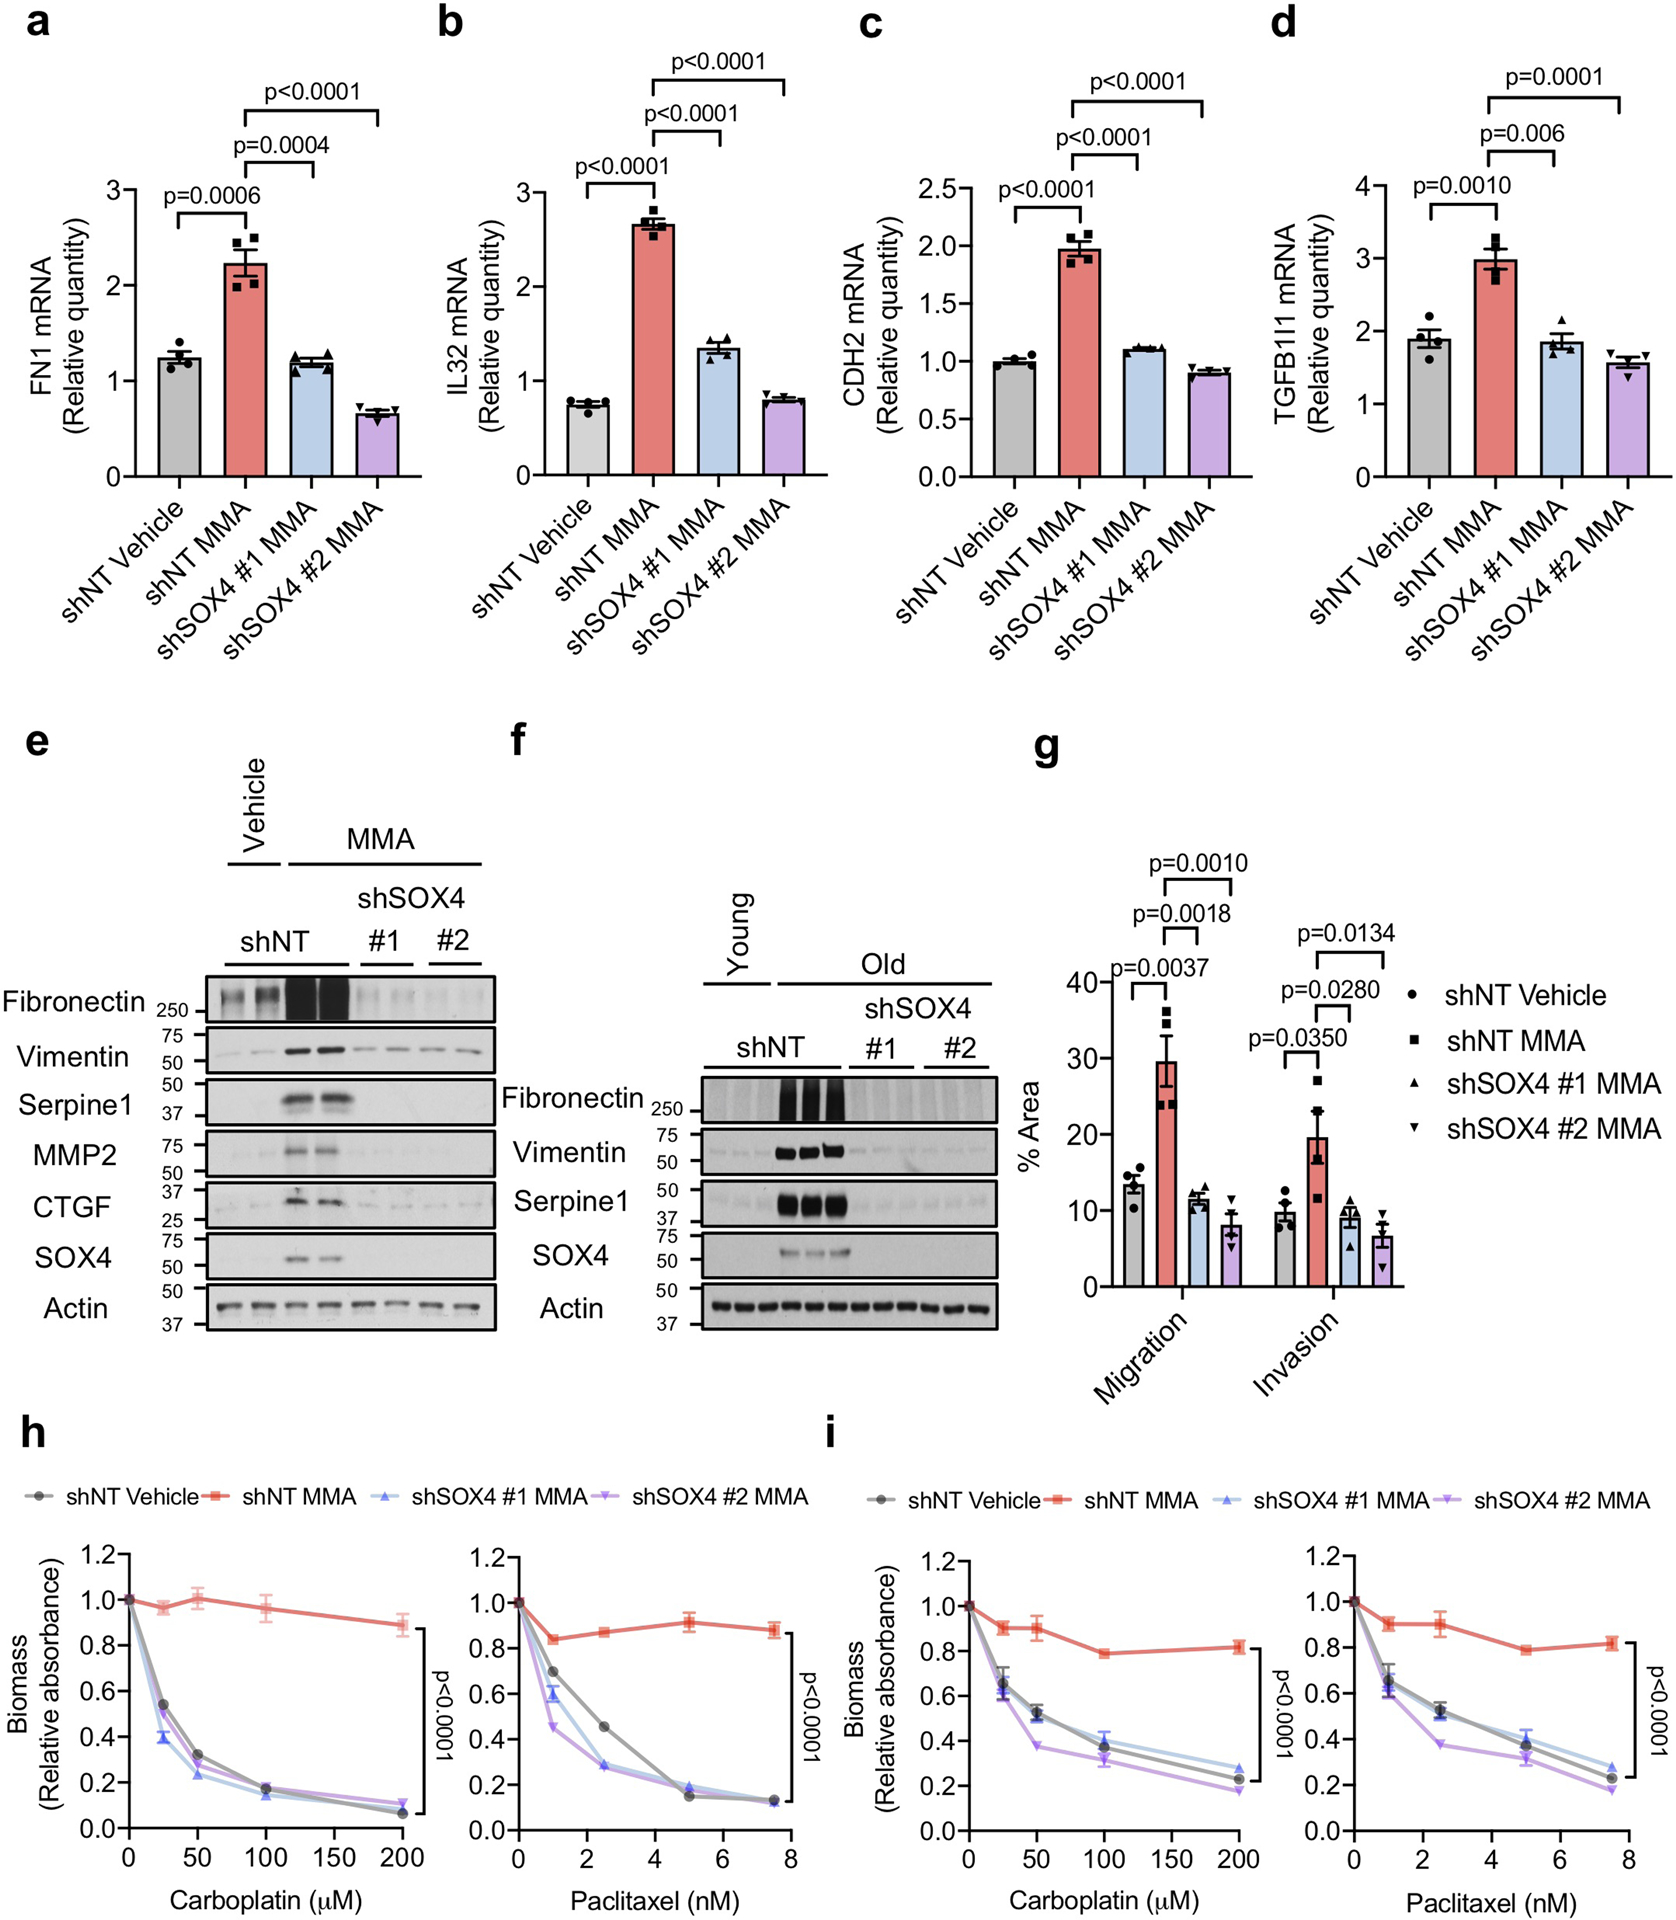
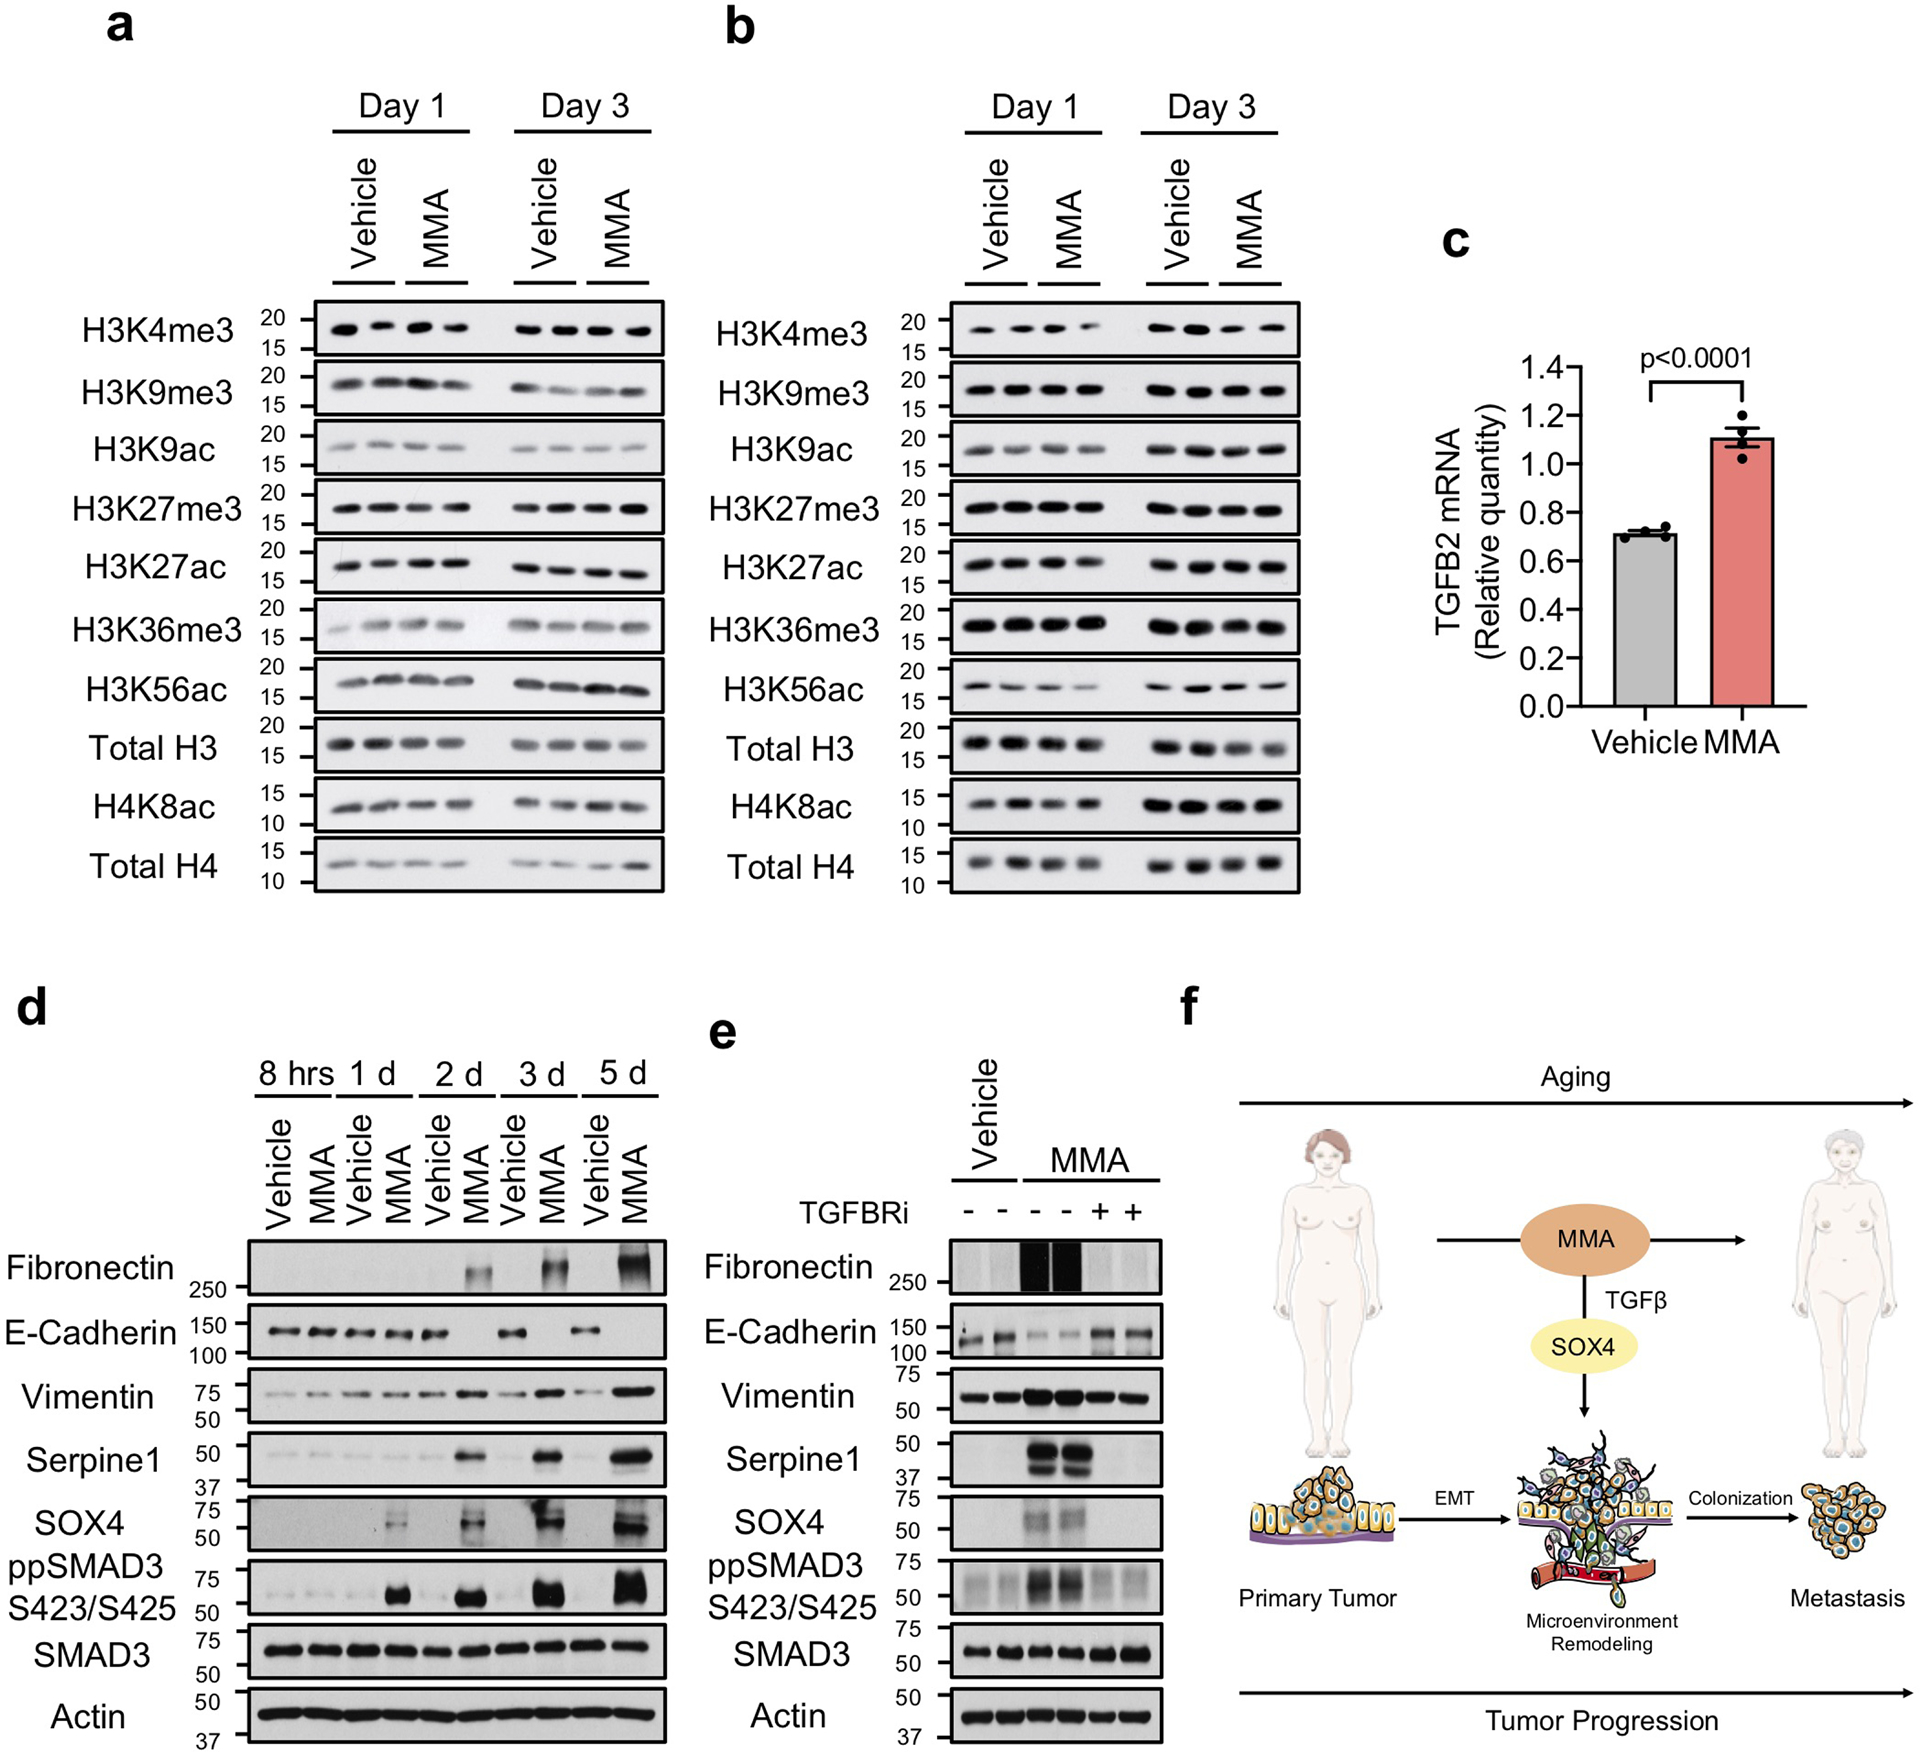
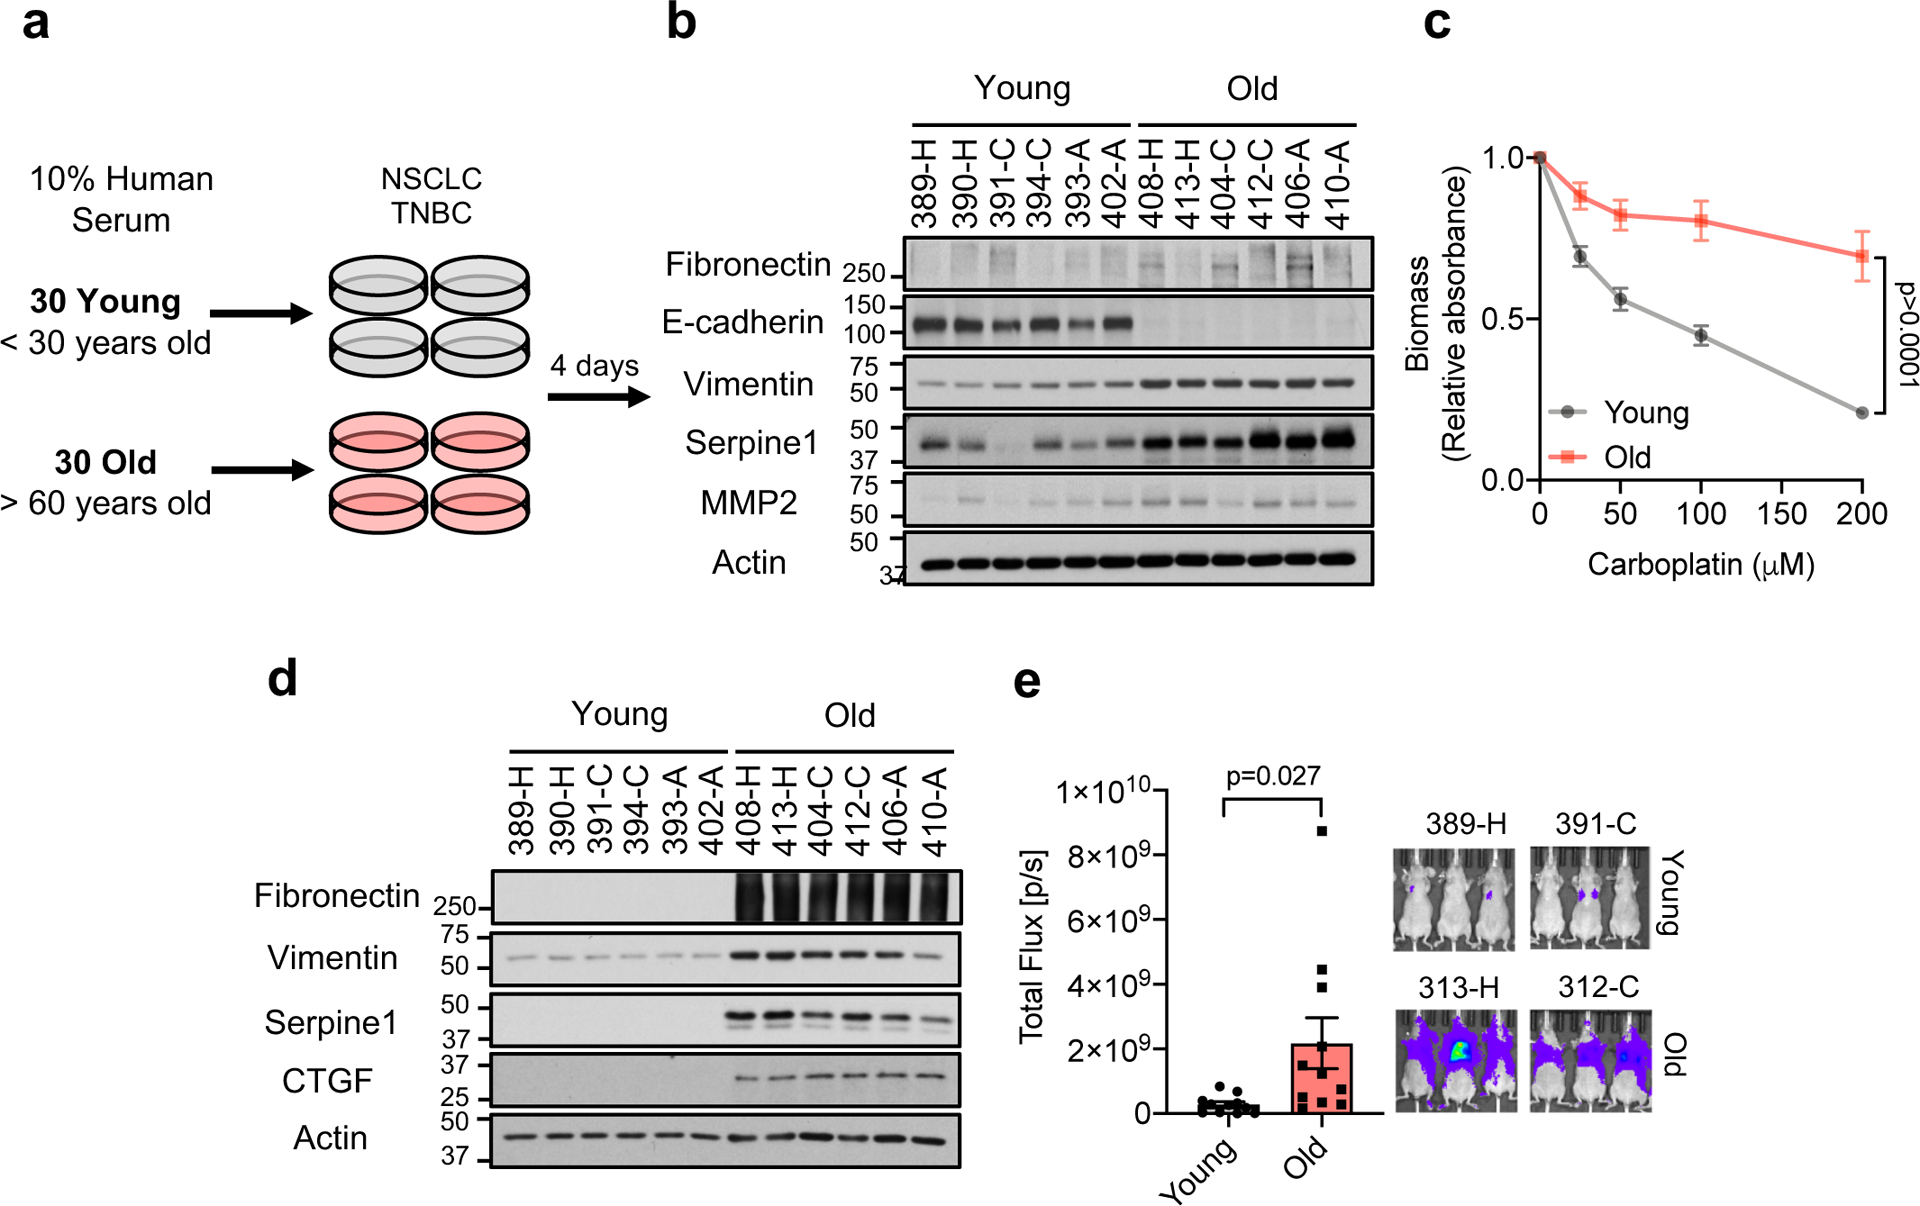
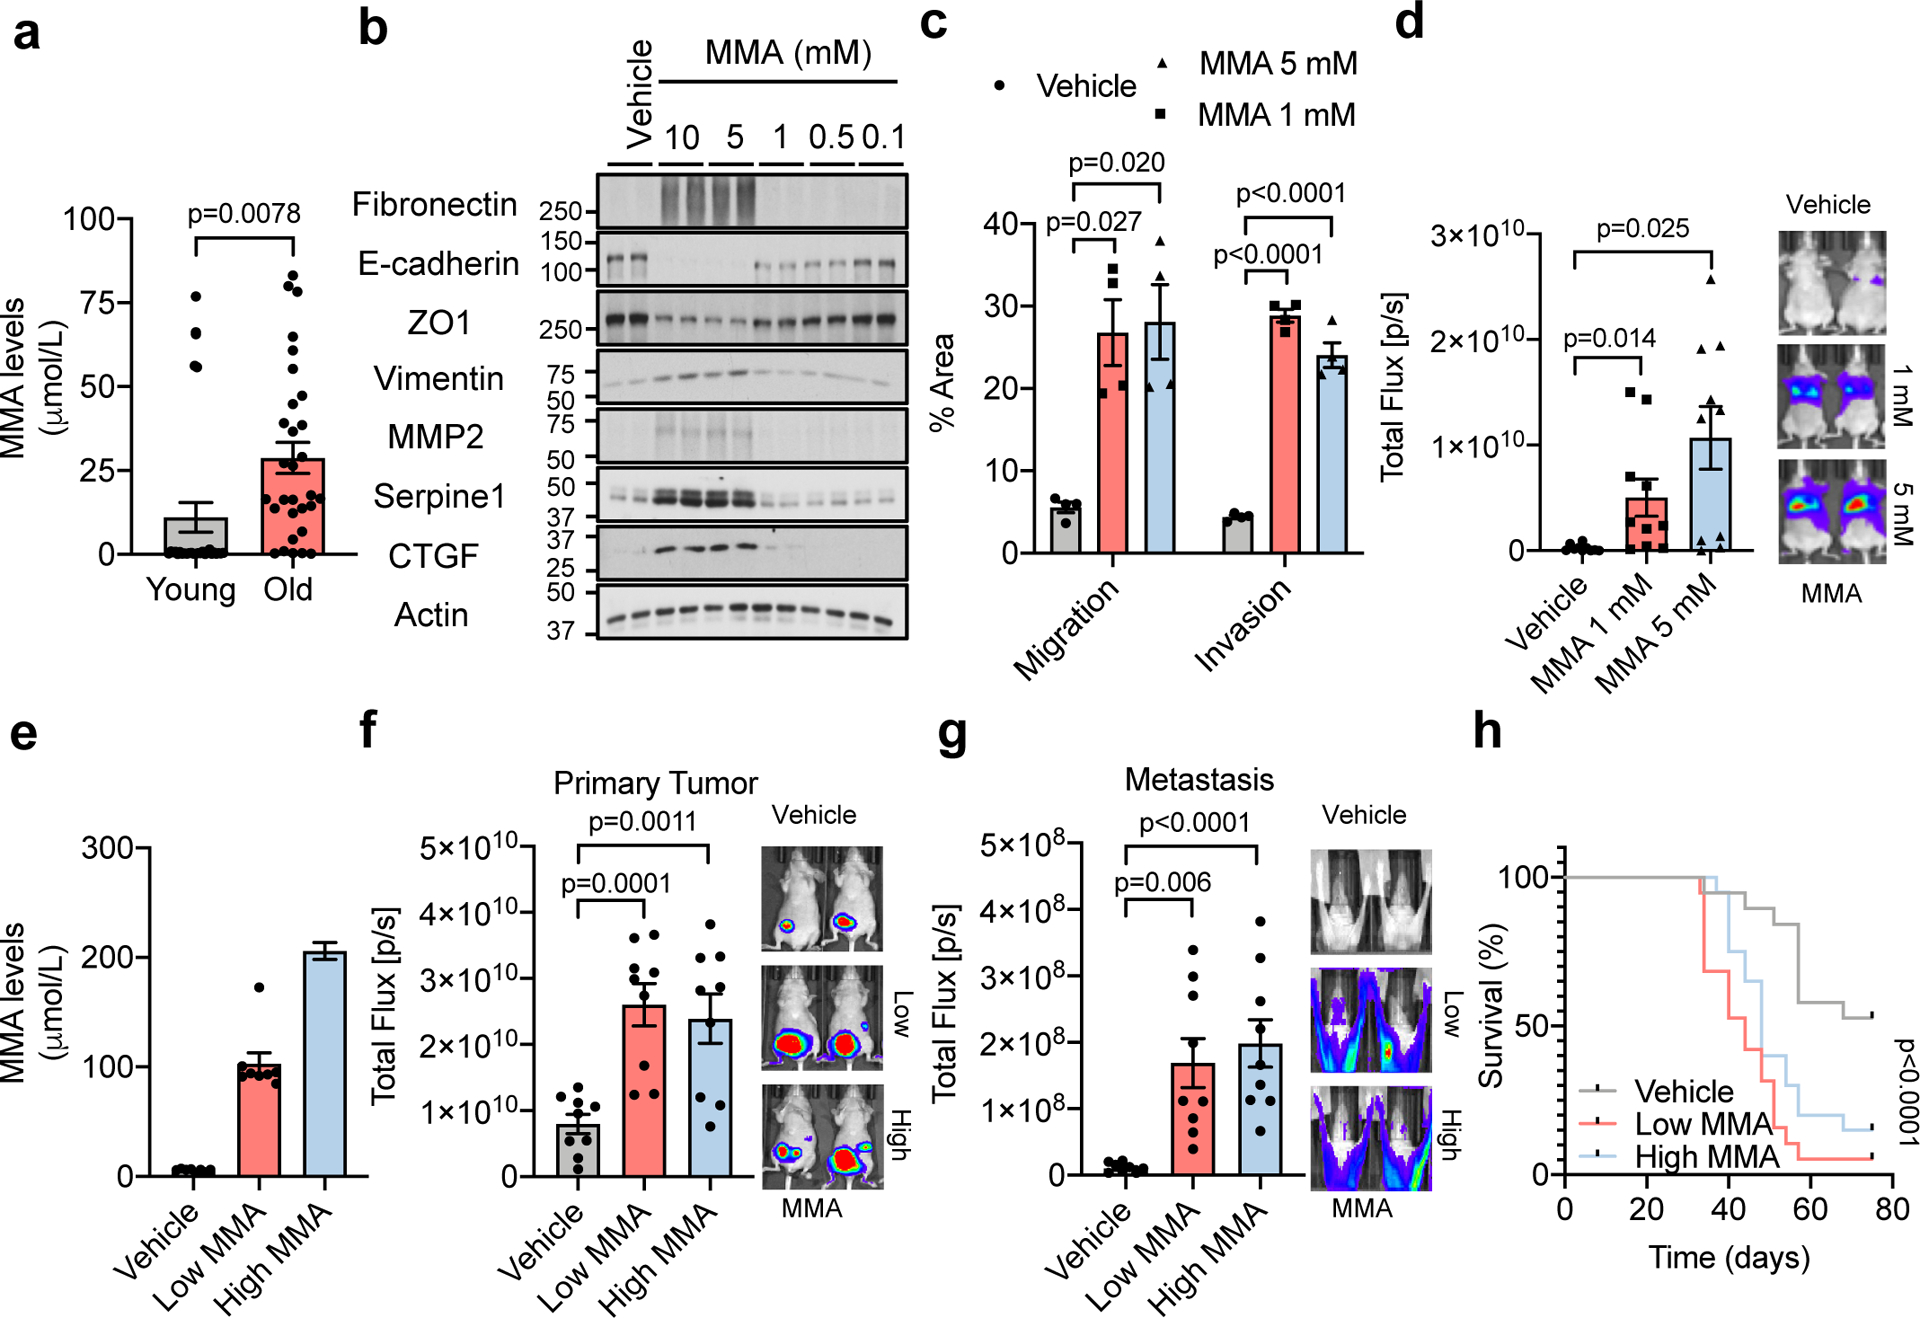
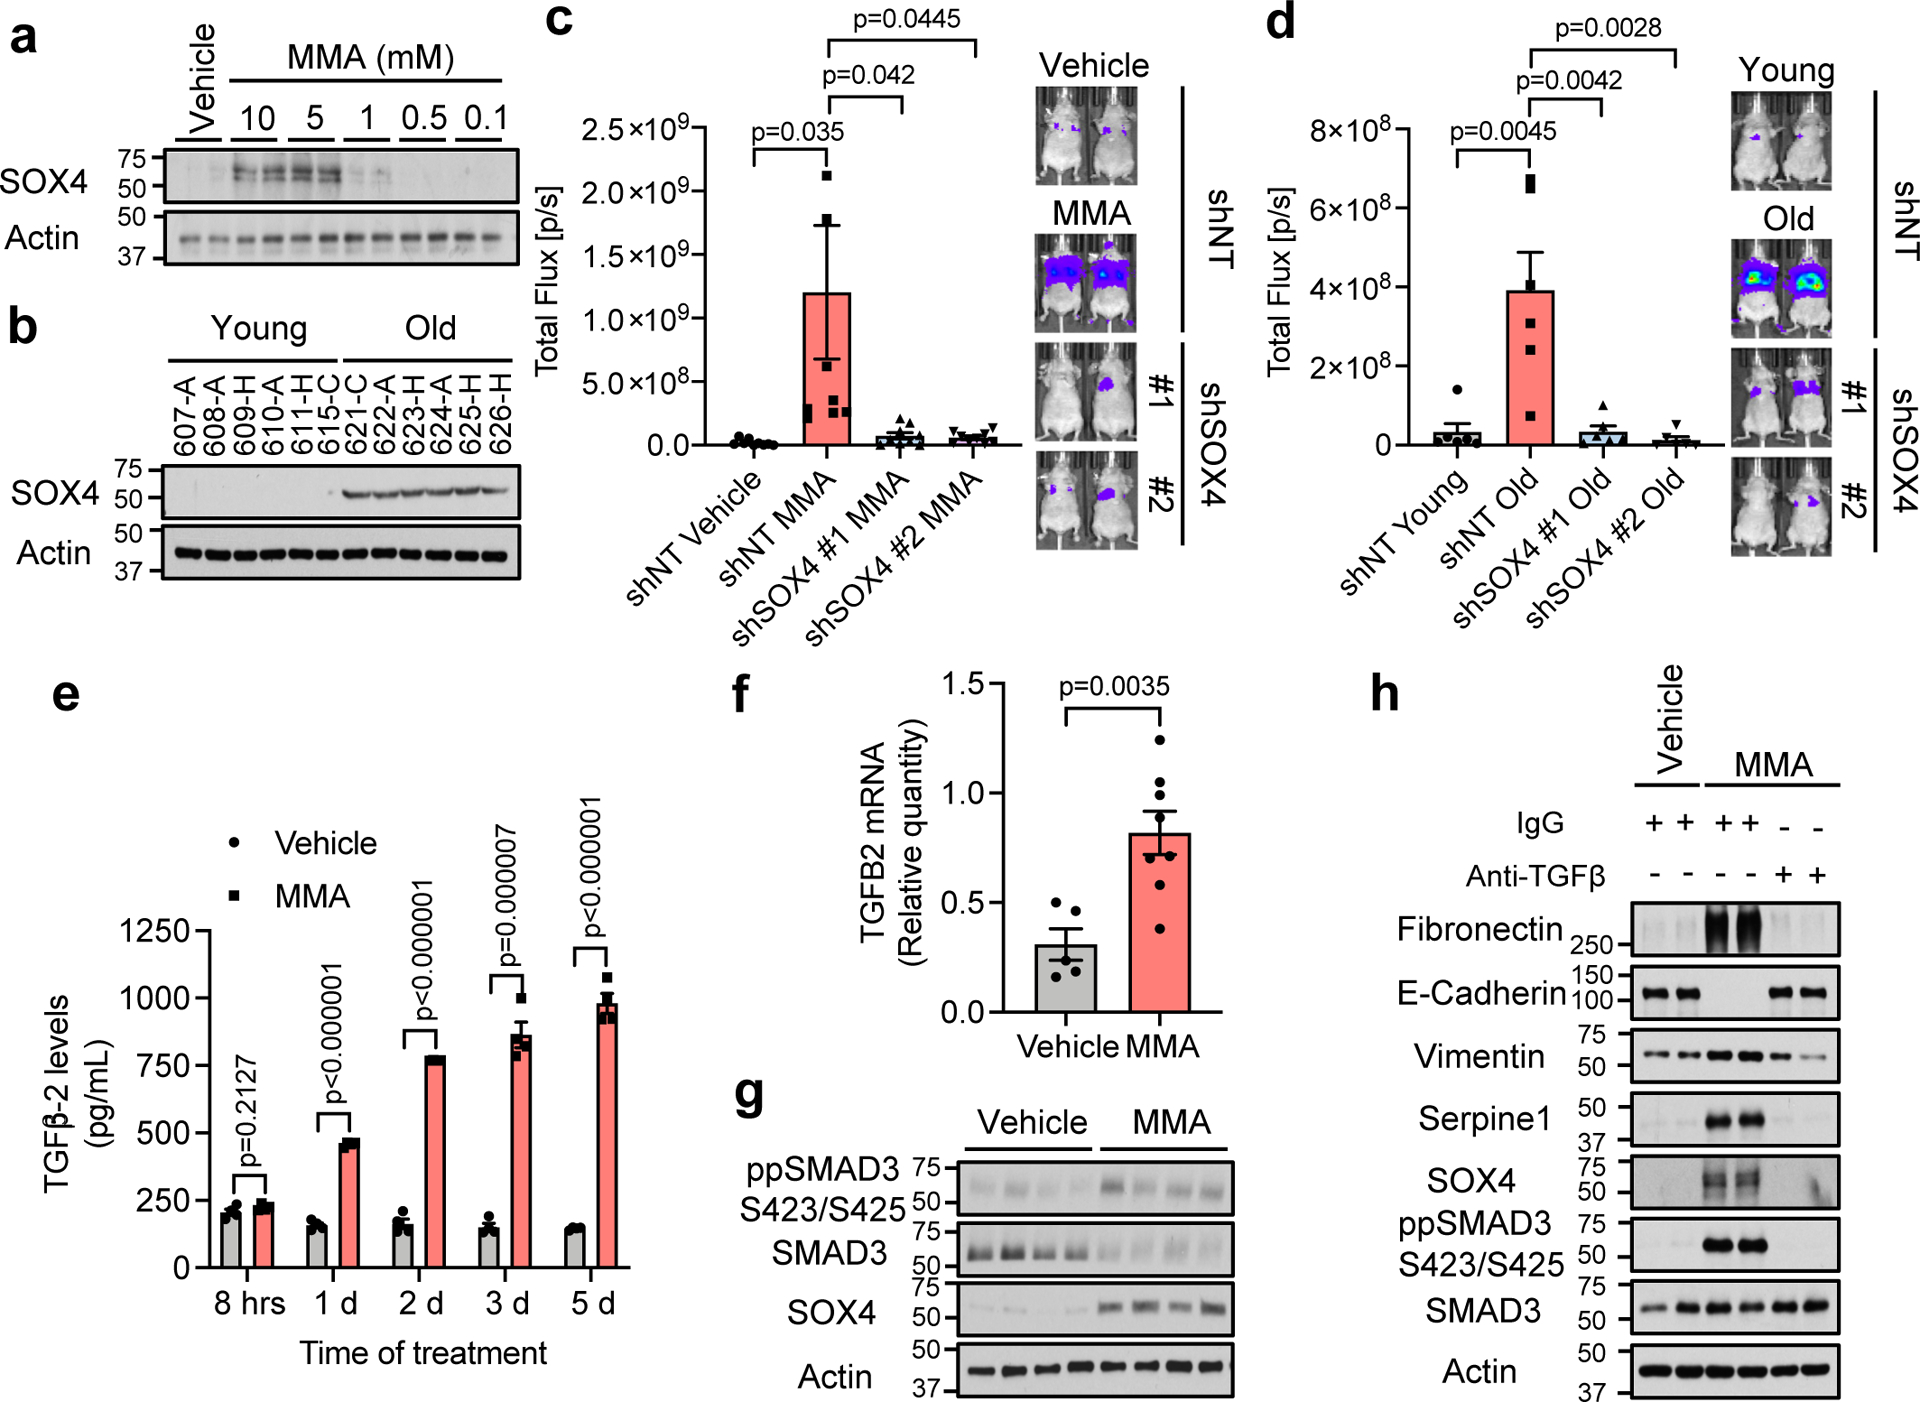
The risk of cancer and associated mortality increases substantially in humans from the age of 65 years onwards1-6. Nonetheless, our understanding of the complex relationship between age and cancer is still in its infancy2,3,7,8. For decades, this link has largely been attributed to increased exposure time to mutagens in older individuals. However, this view does not account for the established role of diet, exercise and small molecules that target the pace of metabolic ageing9-12. Here we show that metabolic alterations that occur with age can produce a systemic environment that favours the progression and aggressiveness of tumours. Specifically, we show that methylmalonic acid (MMA), a by-product of propionate metabolism, is upregulated in the serum of older people and functions as a mediator of tumour progression. We traced this to the ability of MMA to induce SOX4 expression and consequently to elicit transcriptional reprogramming that can endow cancer cells with aggressive properties. Thus, the accumulation of MMA represents a link between ageing and cancer progression, suggesting that MMA is a promising therapeutic target for advanced carcinomas.


Conflict of interest statement

Ethics Declaration

L.C.C. owns equity in, receives compensation from, and serves on the Board of Directors and Scientific Advisory Board of Agios Pharmaceuticals and Petra Pharma Corporation. No potential conflicts of interest were disclosed by the other authors.

Figures

Extended Data Fig. 1
Extended Data Fig. 1. Serum of old donors induces a mesenchymal-like phenotype in non-small cell lung cancer cells.
Morphology of A549 cells cultured for 4 days with HS (n=15 biologically independent samples per HS donor group, first batch of donors). Scale bar = 100 μm; red label indicates outlier donors.
Extended Data Fig. 2
Extended Data Fig. 2. Serum of old donors induces an epithelial-to-mesenchymal transition phenotype in non-small cell lung cancer cells.
Morphology of A549 cells cultured for 4 days with HS (n=15 biologically independent samples per HS donor group, second batch of donors). Scale bar = 100 μm; red label indicates outlier donors.
Extended Data Fig. 3
Extended Data Fig. 3. Serum of old donors induces a mesenchymal-like phenotype in triple negative breast cancer cells.
Morphology of HCC1806 cells cultured for 4 days with HS (n=15 biologically independent samples per HS donor group, second batch of donors). Scale bar = 100 μm; red label indicates outlier donors.
Extended Data Fig. 4
Extended Data Fig. 4. Serum of old donors induces aggressive properties in cancer cells and displays a distinct metabolic profile.
a, b, Immunoblots of A549 (total of n=30 biologically independent samples per HS donor group, see Fig. 1b) (a) and HCC1806 (n=15 biologically independent samples per HS donor group) (b) cells cultured for 4 days with HS c, Resistance to paclitaxel in A549 cells cultured for 4 days with HS (n=15 biologically independent samples per HS donor group, two-way ANOVA). d, Volcano plot summarizing the proteomics analysis of all 60 human serum samples used in this study. e, List of all metabolites that are increased at a statistically significant level in the sera of old donors (n=11 biologically independent HS donors, two-sided t-test). f, Immunoblots of A549 cells treated with 5 mM of each metabolite for 10 days; representative images (n=4 independent experiments; QA: quinolinate, PEP: phosphoenolpyruvate, MMA: methylmalonic acid) g, Concentrations of MMA in 10 outlier human sera (serum from 5 young and 5 old donors, each bar represents the concentration of a single donor) h, i, Concentrations of vitamin B12 in all HS samples (n=30 biologically independent samples per HS donor group, two sided t-test) (h) and 10 outlier human sera (serum from 5 young and 5 old donors, each bar represents the concentration of a single donor) (i). For (c, h) data are presented as mean ± SEM. For gel source data, see Supplementary Fig. 2.
Extended Data Fig. 5
Extended Data Fig. 5. Methylmalonic acid promotes epithelial-to-mesenchymal transition and metastatic-like properties.
a, b, Immunoblots of MCF-10A (a) and HCC1806 (b) cells treated with MMA for 10 days (n=4 independent experiments). c, d, Immunoblots of MCF-10A (c), A549 and HCC1806 (d) cells treated with 5 mM of the indicated acids for 10 days (n=4 independent experiments). e-h, Resistance to carboplatin and paclitaxel in A549 (e, f) and HCC1806 (g, h) cells treated with 5 mM MMA for 10 days (n=4 independent experiments, two-way ANOVA). i. Transwell migration assay of A549 cells treated with 5 mM MMA for 10 days (n=4 independent experiments, two-sided t test). j, k, Stemness evaluated by the increase in the CD44 marker in MCF-10A cells treated with MMA for 10 days (j) and by the increase in the CD44 marker and the decrease in CD24 marker in A549 cells treated with 5 mM MMA for 10 days (k) (n=4 independent experiments, two-sided t test). l, Immunoblots of MDA-MB-231-luciferase cells treated with 5 mM MMA for 5 days (n=4 independent experiments). For (e-k) data are presented as mean ± SEM; (a-d, l) are representative images. For gel source data, see Supplementary Fig. 2.
Extended Data Fig. 6
Extended Data Fig. 6. Methylmalonic acid delivery is regulated by lipidic structures (LSs) in the sera of old donors
a, b, Intracellular MMA concentrations in A549 cells cultured with HS for 4 hr (n=6 biologically independent samples per HS donor group, two-sided t test) (a) and with 5 mM MMA for indicated time periods (n=6 independent experiments, two-sided t test) (b). c, d, Immunoblots of MCF-10A (c), A549 and HCC1806 (d) cells treated with various concentrations (5–0.001 mM) of dimethyl methylmalonic acid for 10 days (n=4 independent experiments). e, Immunoblots of A549 cells cultured for 4 days with young and old untreated HS, or old HS that was passed through size exclusion columns or delipidated (n=6 biologically independent samples per HS donor group). f, MMA concentrations in the human serum used in (e) (n=6 biologically independent samples per HS donor group, two-sided t test). g-i, Immunoblots of A549 cells treated with complexes of lipofectamine (LA) with indicated amounts of MMA (n=3 independent experiments) (g) and with LSs isolated from FBS that were complexed with indicated amounts of MMA (n=4 independent experiments) (h), or of MCF10A treated with LSs isolated from FBS that were complexed with indicated amounts of MMA (n=4 independent experiments) (i). j, Intracellular MMA concentrations in A549 cells cultured with MMA-loaded FBS lipidic structures (LSs) for 4 hr (n=6 independent experiments, two-sided t test). k, Immunoblots of A549 cells treated with LSs isolated from young/old HS, and MMA-loaded LSs isolated from young HS (10 μM MMA) (n=6 biologically independent samples per HS donor group). l, MMA concentrations in serum from old donors after depletion of LSs compared to control HS (n=6 biologically independent samples per HS donor group, two-sided t test). m, Immunoblots of A549 cells treated for 4 days with HS from old donors after depletion of LSs or from control donors (n=6 biologically independent samples per HS donor group). For (a, b, f, j, l) data are presented as mean ± SEM; (c, d, e, h, i, k, m) are representative images. For gel source data, see Supplementary Fig. 2.
Extended Data Fig. 7
Extended Data Fig. 7. Methylmalonic acid induces tumor progression through regulation of pro-aggressive and poor prognosis genes.
a-c, End-point serum MMA concentrations (n=8 mice per group, two-sided t test) (a), bioluminescence intensity of the primary tumors (n=9 mice on vehicle group and n=10 on Low and High MMA group, two-sided t test) (b), and metastases (n=10 mice per group) (c) in mice that were xenografted with MDA-MB-231-luciferase cells and treated with MMA in their drinking water. d-f, Summary of RNA-seq analysis in A549 cells treated with 5 mM MMA for 10 days: a heatmap representation of hierarchical clustering of the top 100 changed mRNAs (d), functional annotation clustering analysis of the >1.5-fold changed mRNAs detected by RNA-seq analysis in A549 cells treated with 5 mM MMA for 10 days (e), and a volcano plot representation of the complete curated data set (the statistically significantly (FDR≤0.05) altered mRNAs that are changed more than 1.5-fold are displayed in red) (f) (n=3 independent experiments). g, h, mRNA levels of pro-aggressive cell intrinsic factors (g) and secreted factors (h) evaluated by qPCR in A549 cells treated with 5 mM MMA for 10 days (n=4 independent experiments, two-sided t test). i, mRNA levels of transcription factors evaluated by qPCR in A549 cells treated with 5 mM MMA for 3 days (n=3 independent experiments, two-sided t test). j, k, Immunoblots of MCF-10A and HCC1806 cells treated with MMA for 10 days (j) and of MDA-MB-231-luciferase cells treated with 5 mM MMA for 5 days (k) (n=4 independent experiments) l, Immunoblots of HCC1806 and MD-MBA-231-luciferase cells cultured with HS for 4 days (n=6 biologically independent samples per HS donor group) m, Venn diagram showing the overlap of altered mRNAs between A549 cells treated with MMA for 10 days and the genes altered by SOX4 induction (Fisher’s exact test). For (a-c, g-i) data are presented as mean ± SEM; (j, k) are representative images. For gel source data, see Supplementary Fig. 2.
Extended Data Fig. 8
Extended Data Fig. 8. SOX4 mediates methylmalonic acid-induced pro-aggressive transcriptional reprogramming.
a-d, mRNA levels of fibronectin (FN) (a), IL32 (b), N-cadherin (CDH2) (c) and TGFB1I1 (d) evaluated by qPCR in A549 cells with SOX4 knockdown and treated with 5 mM MMA for 10 days (n=4 independent experiments, two-sided t test). e, f, Immunoblots (e) and transwell migration/invasion assays (f) of MDA-MB-231-luciferase cells with SOX4 knockdown and treated with 5 mM MMA for 5 days (n=4 independent experiments, two-sided t test). g, Immunoblots of MDA-MB-231-luciferase cells with SOX4 knockdown and treated with HS for 5 days (n=6 biologically independent samples per HS donor group) h, i, Resistance to carboplatin and paclitaxel in A549 cells with SOX4 knockdown and treated with 5 mM MMA for 10 days (h) and in MDA-MB-231-luciferase cells with SOX4 knockdown and treated with 5 mM MMA for 5 days (i) (n=4 independent experiments, two-way ANOVA). For (a-d, f, h, i) data are presented as mean ± SEM; (e, g) are representative images. For gel source data, see Supplementary Fig. 2.
Extended Data Fig. 9
Extended Data Fig. 9. Methylmalonic acid induces SOX4 through activation of TGFβ signaling.
a, b, Immunoblots for histone marks in A549 (a) and MCF-10A (b) cells treated with 5 mM MMA for 1 or 3 days (n=4 independent experiments). c, TGFB2 mRNA levels determined by qPCR in A549 cells treated with 5 mM MMA for 3 days (n=4 independent experiments, two-sided t test). d, e, Immuno-blots of A549 cells treated with 5 mM MMA for the indicated time points (d) or with 5 mM MMA in the presence of TGFBR inhibitor for 5 days (e) (n=4 independent experiments). f, Age-induced accumulation of circulatory MMA induces SOX4 expression through the TGFβ pathway and elicits a transcriptional reprogramming that supports aggressiveness, promoting tumor progression and metastasis formation; This illustration was created using the Smart Servier Medical Art library (https://smart.servier.com/), which is licensed under a Creative Commons Attribution 3.0 Unported License. For (c) data are presented as mean ± SEM; (a, b, d, e) are representative images. For gel source data, see Supplementary Fig. 2.
Fig. 1:
Fig. 1:. An age-induced circulatory factor promotes aggressiveness.
a, Diagram showing experimental design (see Online Methods). b, Immunoblots of A549 cells cultured for 4 days in HS; see Extended Data Fig. 4a (total of n=30 biologically independent samples per HS donor group). c, Resistance to carboplatin in A549 cells cultured for 4 days in HS (n=15 biologically independent samples per HS donor group, two-sided ANOVA). d, e, Metastatic properties of MDA-MB-231-luciferase cells cultured for 5 days in HS evaluated by immunoblots (n=6 biologically independent samples per HS donor group) (d) and lung colonization assay (n=11 biologically independent samples, which are each average of 3 mice used as technical replicates, per HS donor group, two-sided t-test) (e). For (c, e) data are presented as mean ± SEM. For gel source data, see Supplementary Fig. 2.
Fig. 2:
Fig. 2:. MMA induces aggressive traits of cancer cells.
a, Concentrations of MMA in all HS samples (n=30 biologically independent samples per HS donor group). b, Immunoblots of A549 cells treated with MMA for 10 days; representative images (n=4 independent experiments). c, Transwell migration/invasion assays of MCF-10A cells treated with MMA for 10 days (n=4 independent experiments). d, Lung colonization assay of MDA-MB-231-luciferase cells treated with MMA for 5 days (n=10 mice per group). e-g, End-point serum MMA concentrations (n=8 mice per group) (e), bioluminescence intensity of the primary tumors (n=9 mice per group) (f), and metastases (n=9 mice per group) (g) in mice that were xenografted with MDA-MB-231-luciferase cells and subcutaneously injected with MMA daily. h, Kaplan-Meier curve of mice xenografted with MDA-MB-231-luciferase cells and treated with MMA either subcutaneously or through drinking water. (n=19 mice per experimental group). For (a, c-g) two-sided t-test was performed and data are presented as mean ± SEM; for (h) a Mantel-Cox test was utilized. For gel source data, see Supplementary Fig. 2.
Fig. 3:
Fig. 3:. MMA triggers a pro-aggressive transcriptional reprogramming by activation of TGFβ signaling and consequent induction of SOX4.
a, b Immunoblots of A549 cells treated with MMA for 10 days (n=4 independent experiments) (a) and HS for 4 days (n=6 biologically independent samples, which are each average of 3 mice used as technical replicates, per HS donor group,) (b). c, d, Lung colonization assay of MDA-MB-231-luciferase cells with SOX4 knockdown and treated with 5 mM MMA (n=8 mice per group) (c) or HS from old donors (n=6 mice per group) (d) for 5 days. e, Levels of TGFβ−2 ligand in conditioned media from A549 cells treated with 5mM MMA (n=4 independent experiment). f, g, TGFB2 mRNA levels determined by qPCR (vehicle n=5, MMA n=8 mice) (f) and immunoblots (representative images, n=8 mice per group) (g) in tumor samples from mice subcutaneously injected with the lower dose of MMA daily. h, Immunoblots of A549 cells treated with 5 mM MMA in the presence of TGFβ neutralizing antibody; representative images (n=4 independent experiments). For (c-f) two-sided t-test were performed and data are presented as mean ± SEM. For gel source data, see Supplementary Fig. 2.

Comment in

Similar articles

Cited by

References

    1. Wu LE, Gomes AP & Sinclair DA Geroncogenesis: metabolic changes during aging as a driver of tumorigenesis. Cancer Cell 25, 12–19, (2014). - PMC - PubMed
    1. Thigpen T et al. Age as a prognostic factor in ovarian carcinoma. The Gynecologic Oncology Group experience. Cancer 71, 606–614 (1993). - PubMed
    1. Deng F et al. Age is associated with prognosis in serous ovarian carcinoma. J Ovarian Res 10, 36, (2017). - PMC - PubMed
    1. Gloeckler Ries LA, Reichman ME, Lewis DR, Hankey BF & Edwards BK Cancer survival and incidence from the Surveillance, Epidemiology, and End Results (SEER) program. Oncologist 8, 541–552, (2003). - PubMed
    1. White MC et al. Age and cancer risk: a potentially modifiable relationship. Am J Prev Med 46, S7–15, (2014). - PMC - PubMed

Publication types

MeSH terms