. 2020 Aug;584(7822):589-594.
doi: 10.1038/s41586-020-2635-8. Epub 2020 Aug 19.

Genetic and functional insights into the fractal structure of the heart

Affiliations

Genetic and functional insights into the fractal structure of the heart

Hannah V Meyer et al. Nature. 2020 Aug.

Abstract

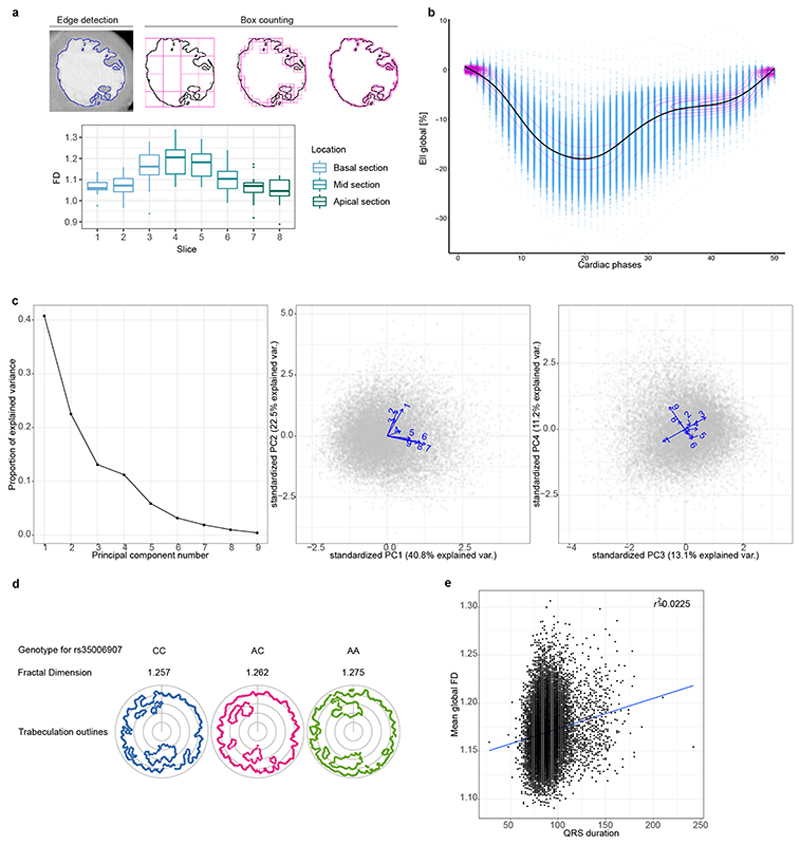
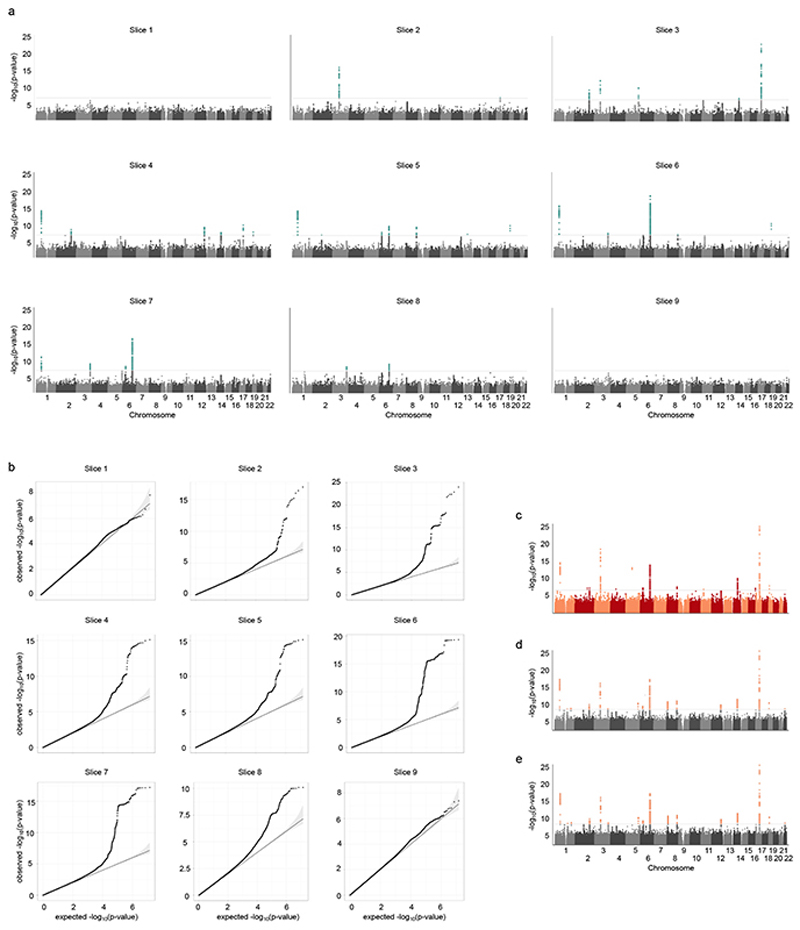
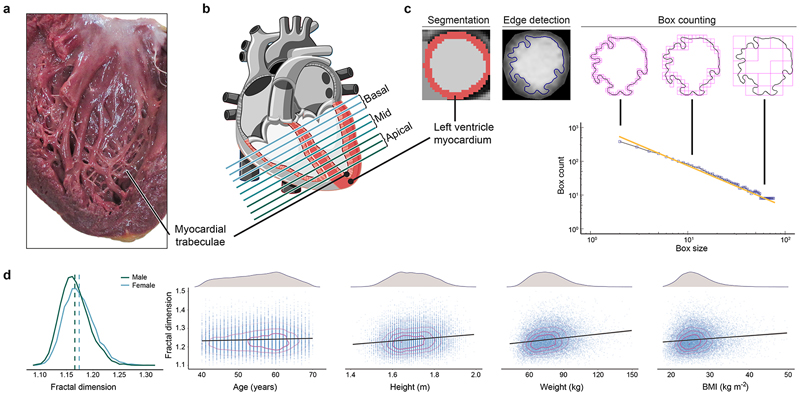
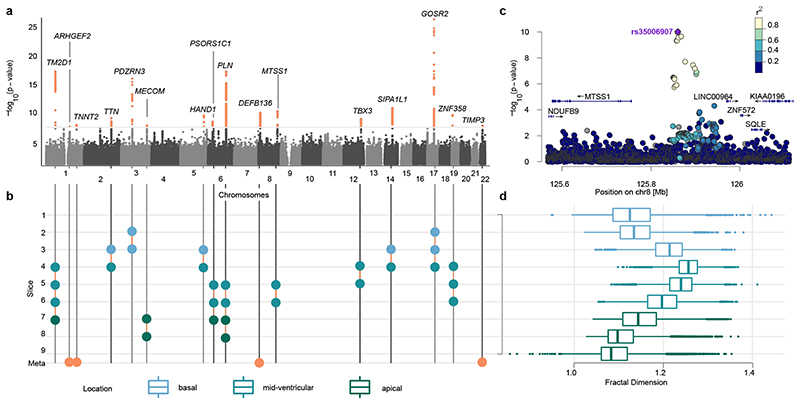
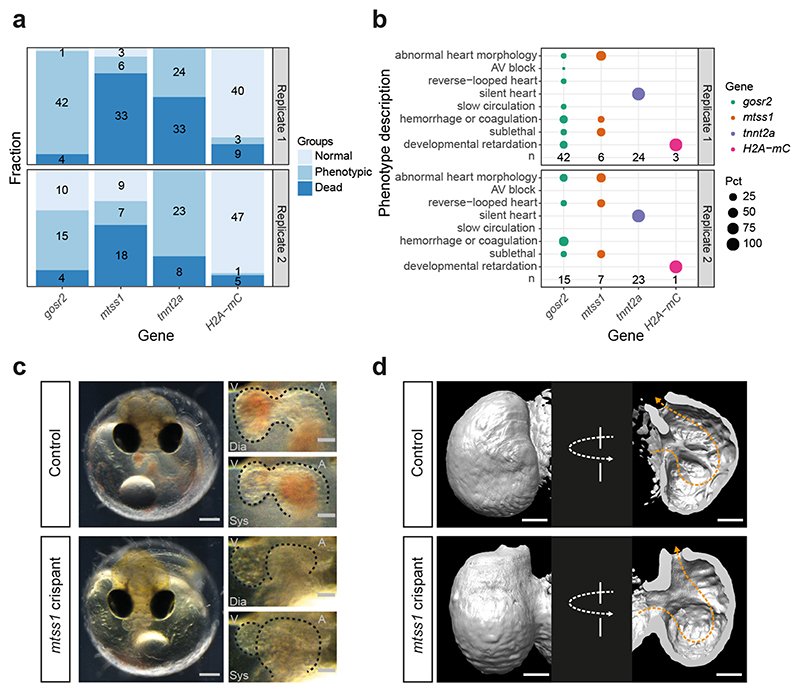
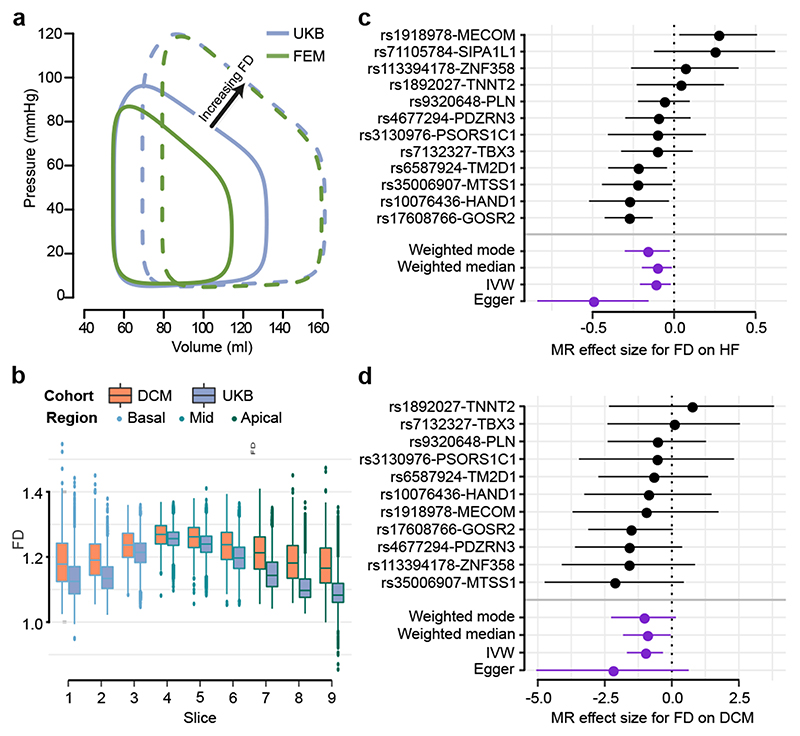
The inner surfaces of the human heart are covered by a complex network of muscular strands that is thought to be a remnant of embryonic development1,2. The function of these trabeculae in adults and their genetic architecture are unknown. Here we performed a genome-wide association study to investigate image-derived phenotypes of trabeculae using the fractal analysis of trabecular morphology in 18,096 participants of the UK Biobank. We identified 16 significant loci that contain genes associated with haemodynamic phenotypes and regulation of cytoskeletal arborization3,4. Using biomechanical simulations and observational data from human participants, we demonstrate that trabecular morphology is an important determinant of cardiac performance. Through genetic association studies with cardiac disease phenotypes and Mendelian randomization, we find a causal relationship between trabecular morphology and risk of cardiovascular disease. These findings suggest a previously unknown role for myocardial trabeculae in the function of the adult heart, identify conserved pathways that regulate structural complexity and reveal the influence of the myocardial trabeculae on susceptibility to cardiovascular disease.


Conflict of interest statement

Competing interests

The authors declare no competing interests.

Figures

Extended Data Figure 1
Extended Data Figure 1. Participant ethnicities in discovery and replication.
Principal components 1 and 2 of the principal component analysis on the combined genotypes of the HapMap III datasets (n=1184) and either a. the discovery cohort UK Biobank (n=19,262; 159,243 independent genetic variants) and b. the UK Digital Heart study (n=2,985; 149,707 independent genetic variants). UK Biobank (a) or UK Digital Heart cohort (b) are depicted in blue, HapMap individuals colored by their ethnicity. Cohort individuals within 1.5 standard deviations distance from the center of the European HapMap individuals (grey) are selected for further analyses.
Extended Data Figure 2
Extended Data Figure 2. FD phenotypes.
The upper panels show the distribution of CMR image slices where FD was successfully measured. Missing FD measurements per slice can either arise because a slice was not measured (NA) or the FD estimation failed due to poor image quality or estimated FD failing quality control (NaN). a. depicts the distribution in the UK Biobank samples (n=19,761), b. the distribution in the UK Digital Heart samples (n=1,901). The lower panels show the correlation between FD summary measures derived from the observed FD slice measurements and interpolated FD measurements per sample. Interpolated FD measurements per sample were derived by using a Gaussian kernel local fit to a different numbers of slice templates, allowing for direct slice comparisons across individuals. Different numbers of slices for interpolation were tested (rows). Columns show different summary measures, either mean FD across all measured slices or mean FD per slice region. c. Linear model of measured interpolated (r 2) of the summary measures between measured and interpolated FD in the UK Biobank samples (n=19,761), d. linear model in the UK Digital Heart samples (n=1,901).
Extended Data Figure 3
Extended Data Figure 3. Phenotypes acquisition and processing.
a. Fractal dimension analysis on cardiac CT images. Fractal dimension was calculated using the same method as for CMR, but with manual regions of interest, in a set of gated cardiac computed tomography (CT) images. a. Analogous processing as described in Fig. 1c, using edge detection of the trabeculae and subsequent box-counting across a range of sizes. b. Analogous to Fig. 2a, box-plots of the FD measurements for 20 individuals per slice, colour-coded by cardiac region. The lower and upper hinges in the boxplot correspond to the 25th and 75th percentiles (IQR), the horizontal line in the boxplot the median. The lower/upper whisker extends from the hinge to the smallest/largest value no further than 1.5 * IQR. b. Myocardial strain. Global longitudinal Lagrangian strain at each cardiac phase for all UK Biobank participants with CMR imaging (n=26,893). Individual data points shown with a smoothed mean and density contours. c. Principal component analysis of trabeculation phenotypes. Principal component analysis of FD measurements across all 9 slices in the 18,096 individuals of the UK Biobank discovery cohort. Proportion of variance explained of each prinicipal component (left). Biplot of individuals’ first and second/third and fourth principal components (grey points) and the corresponding loadings for FD of slices 1-9 as vectors (middle and right). d. Genotype, FD and trabeculation outlines for rs35006907. Representative, registered, trabecular outlines at slice 5 representing the median FD for individuals with homozygous major (blue), heterozygous (pink) and homozygous minor (green) genotype for rs35006907. Pearson correlation of global FD and QRS duration (n=18,096). QRS duration phenotype from UKB ID: qrs_duration_f12340_2_0. The Pearson correlation coefficient is indicated in the upper right corner.
Extended Data Figure 4
Extended Data Figure 4. Per-slice FD GWAS and inclusion of additional covariates.
a. Manhattan plots and b. quantile-quantile plots of the independently conducted, nine univariate GWAS on the per-slice FD measurements for 18,096 samples. In the Manhattan plots (a), the p-values (derived from linear association t statistic) were multiplied by the effective number of independent phenotypic tests Teff = 6.6 and min(padjust, 1) reported. In the qq-plots, the unadjusted p-values are plotted against equally spaced values in [0, 1] of the same sample size (expected p-values). The diagonal line starts at the origin and has slope one. The genomic control λ values for each qqplot are: 1.0557, 1.0436, 1.0496, 1.0557, 1.0649, 1.0679, 1.0679, 1.0618, 1.0436. λ were generated with LD score regression, for details see Supplementary Table 1. c, d. Manhattan plot based on meta-analysis GWAS (sample size n=18,096) with end-diastolic volume of the left ventricle (c.) or myocardial strain (d.) as co-variate. e. Manhattan plot based on meta-analysis GWAS (same as Fig. 2a; shown for comparison). Other co-variates and analysis parameters (as described in methods) were kept the same in a-c. P-values are meta-analysis p-values, not adjusted for multiple testing derived from the transformation of the univariate signed t-statistics (associations on 14,134,301 genetic variants at 16 independent loci from 18,096 samples) and χ 2 distribution with 9 degrees of freedom. In a. and c., the horizontal grey line is drawn at the level of genome-wide significance: p = 5 × 10⁻⁸.
Extended Data Figure 5
Extended Data Figure 5. GWAS effect size estimates and replication.
a. Effect size distribution of loci with genetic variant associations of padjust = 5*10−8 in any uni-variate per-slice FD GWAS (sample size n=18,096). P-values derived from linear association t statistic. Distribution shown for each locus (indicated by chromosomal position and lead genetic variant in subplot title) across all slices and effect size colour-coded by p-value of the association. Variants with no padjust < 5 *10−8 in the univariate per-slice FD GWAS (all blue) were discovered in the multi-trait meta-analyses. b, c. Effect size estimate concordance in discovery and replication cohorts. For each of the nine uni-variate, per-slice FD GWAS, the effect size estimates of the genetic variants with the smallest p-value for each of the independent loci in the discovery cohort (n=18,096) were selected. For some variants, associations passing the GWAS threshold of padjust < 5 * 10−8 were discovered in more than one of the nine uni-variate GWAS FD slices; for these variants all effect size estimates were selected. Estimates were plotted against the corresponding slice-variant associations in the replication GWAS (b: UK Biobank replication, n=6,356; c: UK Digital Heart cohort, n=1,029). Non-concordant estimate pairs are depicted in light grey. Effect size estimates passing the Bonferroni-adjusted validation p-value threshold of p <0.05/16 = 0.003 are depicted as triangles. r 2 for linear model of β^discoveryβ^replication.
Extended Data Figure 6
Extended Data Figure 6. Annotation of trabeculation associated loci.
a. Gene expression of GTEx associated genes and tissues. Gene expression in log10 transcripts per million (TPM) for genes whose expression is associated with trabeculation loci (via GTEx look-up, Supplementary Data 3). Gene expression values and tissues were downloaded from https://www.ebi.ac.uk/gxa/home by querying: gene name AND tissue AND species, i.e. GTEx gene AND heart component AND Homo sapiens. Light grey tiles indicate NA gene expression values for gene/tissue pair. b. Enrichment of trabeculation associated variants in DNaseI Hypersensitive sites for all available tissues in GARFIELD. GARFIELD was used to compute the functional enrichment (odds ratio, OR) of genetic variants associated with the trabeculation phenotypes (GWAS: n=18,096, p-values derived from linear association t statistic) at p < 10−6 for open chromatin regions. The results across all available studies per tissue are depicted in boxplots. Lower/upper hinges: 25th and 75th percentiles (IQR); horizontal line: median; lower/upper whisker extends from the hinge to the smallest/largest value no further than 1.5 × IQR.
Extended Data Figure 7
Extended Data Figure 7. Biomechanical model, genetic correlation and disesase associations.
a. Left ventricular pressure-volume loops from finite-element modelling across range of atrial pressures. Solid and dashed lines indicate smooth and trabeculated ventricles, respectively. Mid short axis cross sections of the finite element model of the left ventricle, looking towards the apex, at different trabecular complexities. The ventricular model was in series with pre-load (red) and after-load circuits (blue) defining left atrial pressure (PLA), right atrial pressure (PRA), inflow resistance (R1), aortic resistance (R2), peripheral resistance (R3) and vascular capacitance (c). Initial parameters calibrated to approximate UK Biobank observations; the reference model was a trabeculated left ventricle with a PLA of 5 mmHg. d. FD association p-values (depicted on -log10 scale, uncorrected for multiple comparisons; estimated by transformation of univariate signed t-statistic with χ 2 distribution with 9 degrees of freedom; univariate GWAS with n=18,096 samples) for the chr17 GOSR2 locus and variants associated with mixed aetiology heart failure (HF; ncases = 47, 309, ncontrols = 930, 014) and DCM (ncases = 510, ncontrols = 1, 136) highlighted in purple. Summary statistics of basal, mid and apical trabeculation GWAS were analysed for genetic correlation with all available summary statistics on LDhub (e-g). e. Additive heritability estimates h 2 for regional summary statistics based on 1,208,036 genetic variants. f. Genetic correlation p-values (based on LD score regression correlation of 1,208,036 genetic variants) by region summarised in LDhub categories (color-code). Heart and cardiovascular phenotypes (Supplementary Table 13 and y-axis in panel g are depicted in dark red. g. Association p-values of heart and cardiovascular phenotypes with corresponding estimate of genetic correlation (encoded by size). P-values are derived from cross-trait correlation analysis and block-jackknife approach for standard error estimation, Supplementary Table 13; depicted on -log10 scale, uncorrected for multiple comparisons.
Extended Data Figure 8
Extended Data Figure 8. MR analysis of trabeculation on heart failure (HF) and dilated cardiomyopathy (DCM).
a. MR on HF with HF effect size estimates based on ncases = 47, 309 and ncontrols = 930, 014 in HERMES study. b. MR on DCM with DCM effect size estimates based on ncases = 1, 136 and ncontrols = 510. For all panels in a. and b. FD effect size estimates from uni-variate GWAS results on n=18,096 samples. Scatter plots (upper left) depict the genetic variant-exposure effect versus the genetic variant-outcome effect. Center values show effect size estimate on FD and DCM, error bars indicate standard error of association test (t-statistic for FD, logistic regression for HF). Forest plots (upper right) show the contribution of each genetic variant to the overall estimate (black; estimated by Wald ratio) and combined as a single genetic instrument (purple; estimated by indicated method) for the four tested MR methods (see legend). Funnel plots (lower left) depict the instrument strength against the causal effect of each instrument as a single IV. Vertical lines indicate the average estimated effect for the tested MR methods. Strong instruments are close to the estimated average effect, while weak instruments spread evenly on both sides. Leave-one-out plots (lower right) show the results of MR analysis (IVW only) where each genetic variant is sequentially excluded and can indicate if there are any single variants that drive the MR results. In right panels, center values mark effect size point estimates, error bars the 95% confidence intervals.
Figure 1
Figure 1. Trabeculation phenotypes and covariates.
a) Macroscopic cut pathological section of the left ventricle demonstrating the branching network of muscular trabeculae lining the endocardial surface (Arpatsara/Shutterstock.com). b) Diagram of the heart illustrating the positioning of sections acquired during cardiac magnetic resonance (CMR) imaging for the assessment of trabecular complexity (GraphicsRF/Shutterstock.com). c) Deep learning image segmentation was used for anatomical annotation of each pixel in the CMR dataset and to define an outer region of interest for subsequent fractal analysis. A binary mask was taken of the image followed by edge detection of the trabeculae. Box-counting across a range of sizes generated a log-log plot from which the gradient of a least-squares linear regression defined the fractal dimension. d) Distribution of fractal dimension and its relation to covariates used in the association study (n=18,096).
Figure 2
Figure 2. Genetic associations of left ventricular trabeculation.
a) Manhattan plot (number of variants = 14,134,301) of meta-analysis p-values, depicted on log10 scale, uncorrected for multiple comparisons. Meta-analysis p-values estimated based on transformation of univariate signed t-statistic and χ 2 distribution with 9 degrees of freedom. Loci passing the genome-wide significance threshold 5*10−8 highlighted in orange (top). b) Diagram showing the slices driving the genetic association signal (compare Extended Data Fig 4): circles indicate a locus being associated (panel a) with respective slice and region (panel d). Loci marked in orange circles have no individual association padjusted = p *Teff < 5 *10−8 (where Teff = 6.6 is the effect number of independent phenotypic tests) and were only discovered in the meta-analysis. Loci are labeled by their nearest protein coding gene. c) Locus zoom of the locus on chromosome 8, associated with slices 5 and 6. d) Box-plot of FD measurements per slice, colour-coded by cardiac region. The lower and upper hinges in the boxplot correspond to the 25th and 75th percentiles (IQR), the horizontal line in the boxplot the median. The lower/upper whisker extends from the hinge to the smallest/largest value no further than 1.5 × IQR. Association (a) and phenotype (d) sample size: n=18,096.
Figure 3
Figure 3. Knock-out of mtss1 leads to reduction of cardiac trabeculation in medaka.
a) Counts (numbers) and corresponding proportion (bars) of normal, phenotypic and dead embryos after CRISPR-Cas9-mediated KO of gosr2, mtss1, and tnnt2a (positive control), and H2A-mCherry (H2A-mC, injection control) at 4 days post fertilization (DPF). b) Percentages of cardiovascular phenotypes, sublethal phenotypes, and developmental retardation. c) A moderately affected mtss1 crispant (total n=13) in comparison to a control embryo (total n=87) at 4 DPF; overview of injected embryos (left), magnifications of the heart region (right) captured in end-diastolic (Dia) and end-systolic (Sys) phase, respectively; scale bars: 200 μm (whole embryos) and 50 μm (hearts), atrium (A), ventricle (V). Corresponding videos of the control and mtss1 crispant embryo in Supplementary Data Video 1 and 2. d) Surface rendering of light-sheet microscopy recordings of control-injected embryo (n=1) at 6 DPF and mtss1 crispant (n=1) at 7 DPF, images cropped to the ventricle; frontal view (left), and 180° rotated (right, cut open to visualize the endocardial surface); direction of blood flow (orange line), scale bars: 50 μm.
Figure 4
Figure 4. Relationship between trabecular complexity and cardiac function and disease
a) Variation in pressure-volume relationship with respect to trabecular fractal dimension (FD) in UK Biobank participants (UKB) and in silico biomechanical modelling (FEM) showing a positive association with left ventricular volumes and stroke work. b) Per-slice distribution of FD in the UK Biobank cohort (n=18,096) and dilated cardiomyopathy (DCM; n=307) patients. Boxplot: lower and upper hinges are 25th and 75th percentiles (IQR), the horizontal line at median; lower/upper whisker from hinge to the smallest/largest value no further than 1.5 * IQR. c). and d). Forest plots for FD effect on HF and DCM estimated by four MR methods. The contribution of each genetic variant to the overall estimate (black; estimated by Wald ratio) and their combined effect as a single genetic instrument (purple; estimated by indicated method) are shown for the four tested MR methods. Center values mark effect size point estimates, error bars the 95% confidence intervals. FD effect size estimates from uni-variate GWAS results on n=18,096 samples. HF samples sizes: ncases = 47,309, ncontrols = 930,014; DCM sample sizes: ncases = 510, ncontrols = 1,136.

References

    1. Sedmera D, McQuinn T. Embryogenesis of heart muscle. Heart Fail Clin. 2008;4:235–245. - PMC - PubMed
    1. Sizarov A, et al. Formation of the building plan of the human heart: morphogenesis, growth, and differentiation. Circulation. 2011;123:1125–35. - PubMed
    1. Kawabata Galbraith K, et al. MTSS1 regulation of actin-nucleating formin DAAM1 in dendritic filopodia determines final dendritic configuration of Purkinje cells. Cell Rep. 2018;24:95–106.e9. - PubMed
    1. Praschberger R, et al. Mutations in Membrin/GOSR2 reveal stringent secretory pathway demands of dendritic growth and synaptic integrity. Cell Rep. 2017;21:97–109. - PMC - PubMed
    1. Chen X, et al. Knockout of SRC-1 and SRC-3 in mice decreases cardiomyocyte proliferation and causes a noncompaction cardiomyopathy phenotype. Int J Biol Sci. 2015;11:1056–72. - PMC - PubMed

Publication types

MeSH terms