. 2020 Oct;586(7830):612-617.
doi: 10.1038/s41586-020-2629-6. Epub 2020 Aug 19.

A single-cell transcriptome atlas of marsupial embryogenesis and X inactivation

Affiliations

A single-cell transcriptome atlas of marsupial embryogenesis and X inactivation

Shantha K Mahadevaiah et al. Nature. 2020 Oct.

Erratum in

Abstract

Single-cell RNA sequencing of embryos can resolve the transcriptional landscape of development at unprecedented resolution. To date, single-cell RNA-sequencing studies of mammalian embryos have focused exclusively on eutherian species. Analysis of mammalian outgroups has the potential to identify deeply conserved lineage specification and pluripotency factors, and can extend our understanding of X dosage compensation. Metatherian (marsupial) mammals diverged from eutherians around 160 million years ago. They exhibit distinctive developmental features, including late implantation1 and imprinted X chromosome inactivation2, which is associated with expression of the XIST-like noncoding RNA RSX3. Here we perform a single-cell RNA-sequencing analysis of embryogenesis and X chromosome inactivation in a marsupial, the grey short-tailed opossum (Monodelphis domestica). We resolve the developmental trajectory and transcriptional signatures of the epiblast, primitive endoderm and trophectoderm, and identify deeply conserved lineage-specific markers that pre-date the eutherian-marsupial divergence. RSX coating and inactivation of the X chromosome occurs early and rapidly. This observation supports the hypothesis that-in organisms with early X chromosome inactivation-imprinted X chromosome inactivation prevents biallelic X silencing. We identify XSR, an RSX antisense transcript expressed from the active X chromosome, as a candidate for the regulator of imprinted X chromosome inactivation. Our datasets provide insights into the evolution of mammalian embryogenesis and X dosage compensation.


Figures
Extended Data Figure 1
Extended Data Figure 1. Illustration of late opossum embryo and single-cell clustering.
a. Schematic representation of opossum E8 – E12.5 embryos. b. Single-cell correlation coefficients. c. Principal component analysis.
Extended Data Figure 2
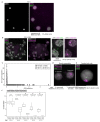
Extended Data Figure 2. EGA and gene ontology analysis of genes in the clusters by unsupervised 3D t-SNE.
a. Y-gene expression in scRNA-seq data derived from oocytes (n = 6 cells), E1.5 (n = 7 embryos) and E2.5 (n = 5 embryos), and E3.5 to E7.5 presumptive male embryos (n = 20 embryos). Y-transcripts cannot be maternally deposited, because the Y chromosome is inherited from the father. Their appearance must therefore signify the initiation of embryonic transcription. b. Immature and mature (asterisk) nucleolar morphology in E2.5 and E3.5 embryos, respectively. Images are maximum projection. Scale bars, 10um. c. Percentage of multi-allelic X- and autosomally-encoded SNP variants in male bulk RNA-seq data (n = 28 embryos). When multiple SNPs for X-encoded RNAs are detected, maternal RNA is still present. However, when single SNPs are detected, it has been degraded. d. Unsupervised clustering of scRNA-seq data. e. Gene ontology analysis for genes in d.
Extended Data Figure 3
Extended Data Figure 3. Identification of lineage specific genes.
a. Pseudotemporal ordering for Fig. 2c in 3D. b. pseudotemporal ordering from Fig. 2c separated by sex. c. Pseudotemporal from 2c with cells coloured according to developmental age. d. Full heat map of genes defining cluster 1, cluster 2, early-EPI, EPI, PrE, early-TE and TE. e. Gene ontology analysis for cluster 1 and cluster 2, early-EPI and early-TE.
Extended Data Figure 4
Extended Data Figure 4. Lineage marker genes expression and immunostaining
a. Expression of representative genes in cluster 1, EPI, PrE, early-TE and TE. b. Expression of GATA6 and TEAD4 at E5.5. All cells are TEAD4 negative, even those not expressing GATA6 (encircled). Images are maximum projection. Scale bars, 10um.
Extended Data Figure 5
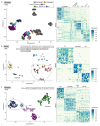
Extended Data Figure 5. Early embryo lineages in eutherians using the same approach used for opossum embryo scRNA-seq.
Semi-supervised 3D t-SNE (left) and heatmap (right) of a. mouse, b. macaque and c. human embryos, with single cells colored according to cluster.
Extended Data Figure 6
Extended Data Figure 6. Eutherian and metatherian lineage conservation.
a. Genes expressed in EPI, PrE and TE in mouse, macaque and human. b. Heatmap showing expression of conserved genes in opossum. c. expression of opossum genes whose orthologues are associated with naïve and primed pluripotency in macaque. d. expression heatmap of opossum genes whose mouse orthologues are expressed specifically in mouse E6.5 EPI (CORO1A) of E4.5 EPI (all other genes).
Extended Data Figure 7
Extended Data Figure 7. EGA and RSX expression.
a. RSX expression in females. b. Dual RSX and MSN RNA-FISH in E2.5 embryo (16 embryos = 68 cells). c. Dual RSX and MSN RNA-FISH (left), followed by Y chromosome DNA-FISH (right) in E4.5 male embryo; blastomeres magnified in insets. d. Y-gene versus RSX expression. e. MSN RNA-FISH followed by Y chromosome DNA-FISH in opossum spermatids. f, Dual RSX and MSN RNA-FISH in female opossum brain cells. Images are maximum projection. Scale bars 10um. g. Percentage of multi-allelic X-SNP variants in female (n = 15 embryos) and male (n = 28 embryos) bulk RNA-seq data from E3.5 – E7.5. Mann-Whitney test was used to calculate p-values. For RNA-FISH data quantitation shown below images. h. SNP analysis showing expression of eleven genes from Xp in E3.5 (n = 3) and E4.5 (n = 2) embryos. Location of RSX shown. Asterisks denote instances where informative SNPs were not present. ATRX is the only gene exhibiting no Xp expression at E3.5 (star): expression from Xm at this age could represent maternal products, with activation of embryonic ATRX initiating at E4.5.
Extended Data Figure 8
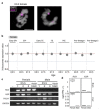
Extended Data Figure 8. Dosage compensation and XSR expression.
a. RSX localization to the inactive X chromosome (identified using MSN DNA FISH) in dividing cells. Images are maximum projection. Scale bar, 10um. b. X:A ratios in female clusters at E6.0 - E7.5. c. RTPCR analysis of RSX, XSR, TFE3Y and GAPDH in E5.5 female and male embryos. d. RSX and XSR expression in adult female and male tissues. e. Dual RSX / XSR RNA FISH in E3.5 female and male embryos. See Materials and Methods for explanation why RSX and XSR FISH signals are the same colour.
Figure 1
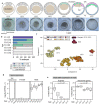
Figure 1. Opossum embryogenesis and single-cell clustering.
a. Schematic representation and light microscopy images of E1.5 – E7.5 opossum embryos. Scale bar 100 μm. b. Developmental progression of preimplantation opossum embryos. Number of embryos in parentheses. c. Unsupervised 3D t-SNE of scRNA-seq data.
Figure 2
Figure 2. Opossum lineage formation.
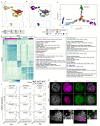
a. Semi-supervised clustering 3D t-SNE with cells colored according to developmental age. b. same 3D t-SNE with cells colored according to cluster. c. Pseudotemporal ordering showing developmental trajectories between clusters. d. Heat map of genes defining early-EPI, EPI, PrE, early-TE and TE (developmental age ribbon shown). e. Gene ontology analysis for EPI, PrE and TE. f. Expression of POU5F3 / GATA6 at E5.5 (n = 3 embryos) and E6.5 (n = 5 embryos) and GATA6 / TEAD4 at E6.5 (n = 3 embryos). Dotted lines in bottom panel encircle putative EPI cells, which are negative for GATA6 and TEAD4. Images are maximum projection. Scale bars, 20um.
Figure 3
Figure 3. Ontogeny of opossum X-dosage compensation.
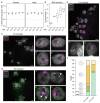
a. X:A ratios in male (n = 20) and female (n = 26) embryos and adult soma. b. RSX RNA-FISH in E3.5 female embryo; blastomeres magnified in insets. c,d. Dual RSX and MSN RNA-FISH in E3.5 (c, arrow head points to MSN RNA-FISH signal) and E4.5 (d) female embryos; blastomeres magnified in insets. Brightness is increased in (d) insets to more clearly visualize DAPI. Insets within insets in c and d show that the RSX-positive region is not DAPI-enriched (E3.5, n = 30 number of cells from 4 embryos, E4.5, n = 31 number of cells from 2 embryos). e. Summary of RSX and MSN expression data (E3.5, n = 12 embryos; E4.5, n = 5 embryos; total cell number in parentheses). Images are maximum projection. Scale bars, 10um. Blastomeres exhibit minimal cell-cell adhesion and thus separate during processing.
Figure 4
Figure 4. XCI in the EPI and characterization of XSR.
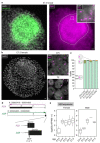
a, Combined RSX RNA-FISH (EPI blastomeres magnified in upper inset) and POU5F3 immunostaining (whole EPI magnified in lower inset) in an E7.5 female embryo. b, Dual RSX and MSN RNA-FISH in an E7.5 female embryo (EPI and TE blastomeres magnified in insets). Images are maximum projection, inset to show that the RSX-positive region is not DAPI-enriched (EPI, n = 100, TE, n = 100 number of cells from 2 embryos). c. Summary of RSX and MSN expression data in E6.5, n = 2 embryos; E7.5, n = 2 embryos; and E8.5, n = 2 embryos; total cell number in parentheses. Asterisk denotes that cells with biallelic MSN-expression are observed both in the EPI and TE. d, RSX and XSR genomic organization and location of SNP used for parent-of-origin analysis. e. XSR locus organization and expression in females (n = 26 embryos) and males (n = 20 embryos) from E3.5 to E7.5. Scale bars, 20um.

Similar articles

Cited by

References

    1. Frankenberg SR, de Barros FR, Rossant J, Renfree MB. The mammalian blastocyst. Wiley Interdiscip Rev Dev Biol. 2016;5:210–232. doi: 10.1002/wdev.220. - DOI - PubMed
    1. Sharman GB. Late DNA replication in the paternally derived X chromosome of female kangaroos. Nature. 1971;230:231–232. - PubMed
    1. Grant J, et al. Rsx is a metatherian RNA with Xist-like properties in X-chromosome inactivation. Nature. 2012;487:254–258. doi: 10.1038/nature11171. - DOI - PMC - PubMed
    1. Graves JA, Renfree MB. Marsupials in the age of genomics. Annu Rev Genomics Hum Genet. 2013;14:393–420. doi: 10.1146/annurev-genom-091212-153452. - DOI - PubMed
    1. Samollow PB. The opossum genome: insights and opportunities from an alternative mammal. Genome Res. 2008;18:1199–1215. doi: 10.1101/gr.065326.107. - DOI - PMC - PubMed

Publication types